
Recommended
More Related Content
What's hot
What's hot (18)
Recently uploaded
Recently uploaded (20)
Exchange rate and devaluation nigeria
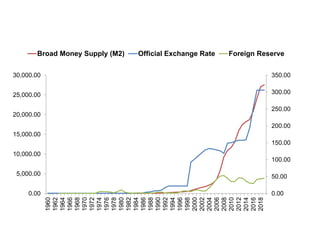
- 1. 0.00 50.00 100.00 150.00 200.00 250.00 300.00 350.00 0.00 5,000.00 10,000.00 15,000.00 20,000.00 25,000.00 30,000.00 1960 1962 1964 1966 1968 1970 1972 1974 1976 1978 1980 1982 1984 1986 1988 1990 1992 1994 1996 1998 2000 2002 2004 2006 2008 2010 2012 2014 2016 2018 Broad Money Supply (M2) Official Exchange Rate Foreign Reserve