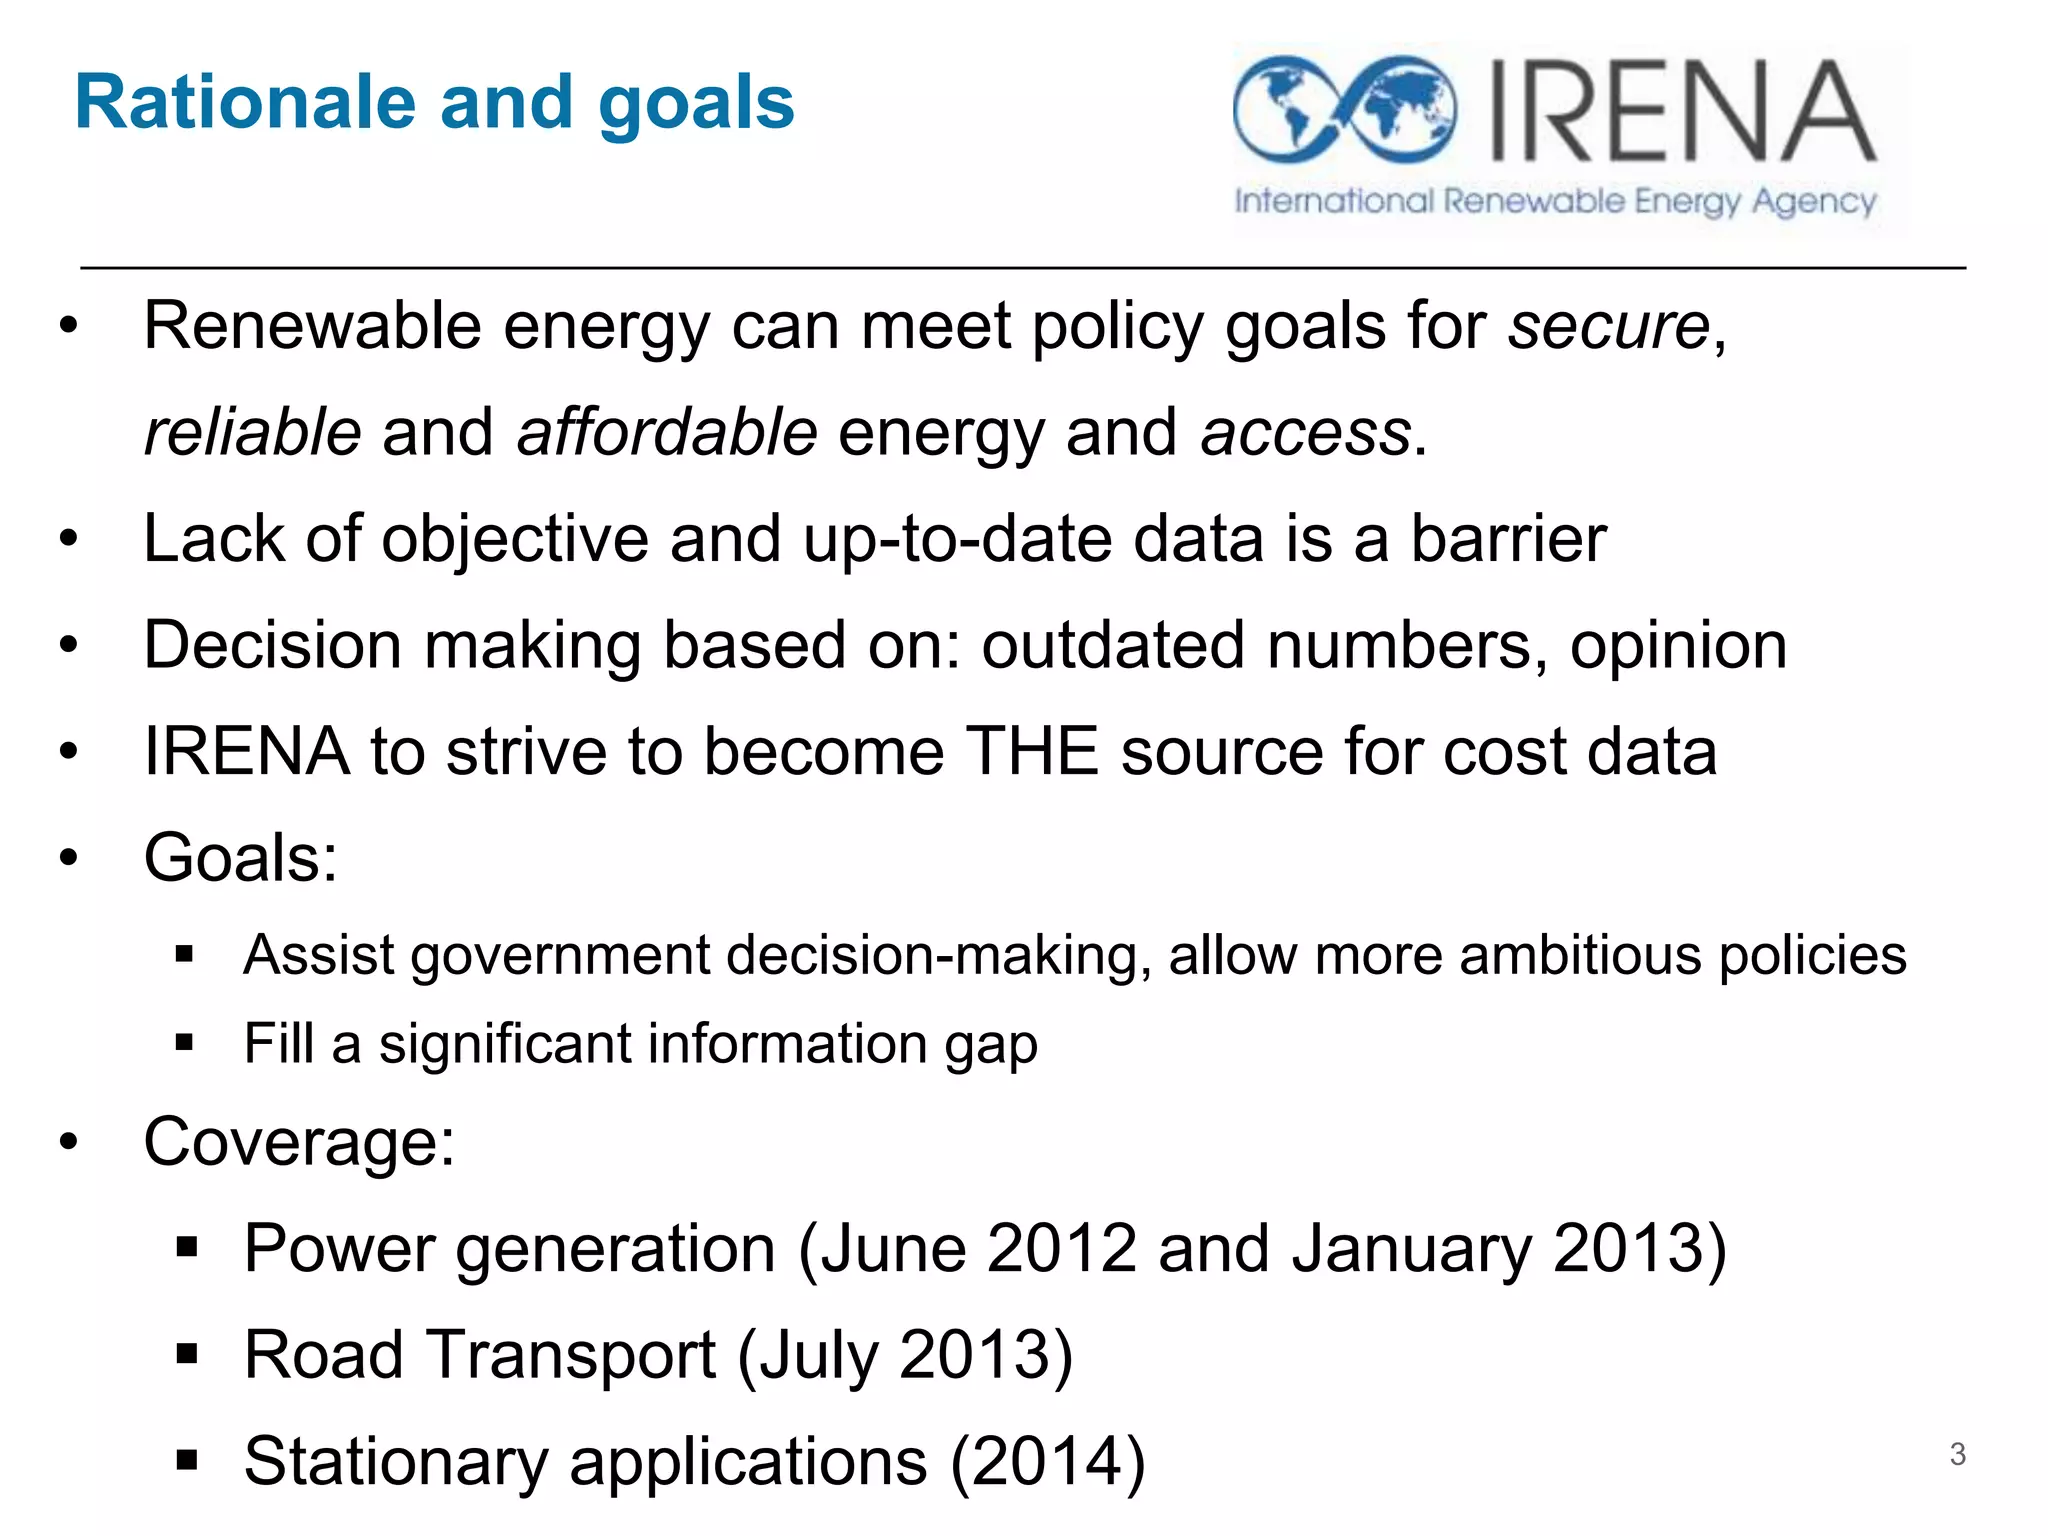
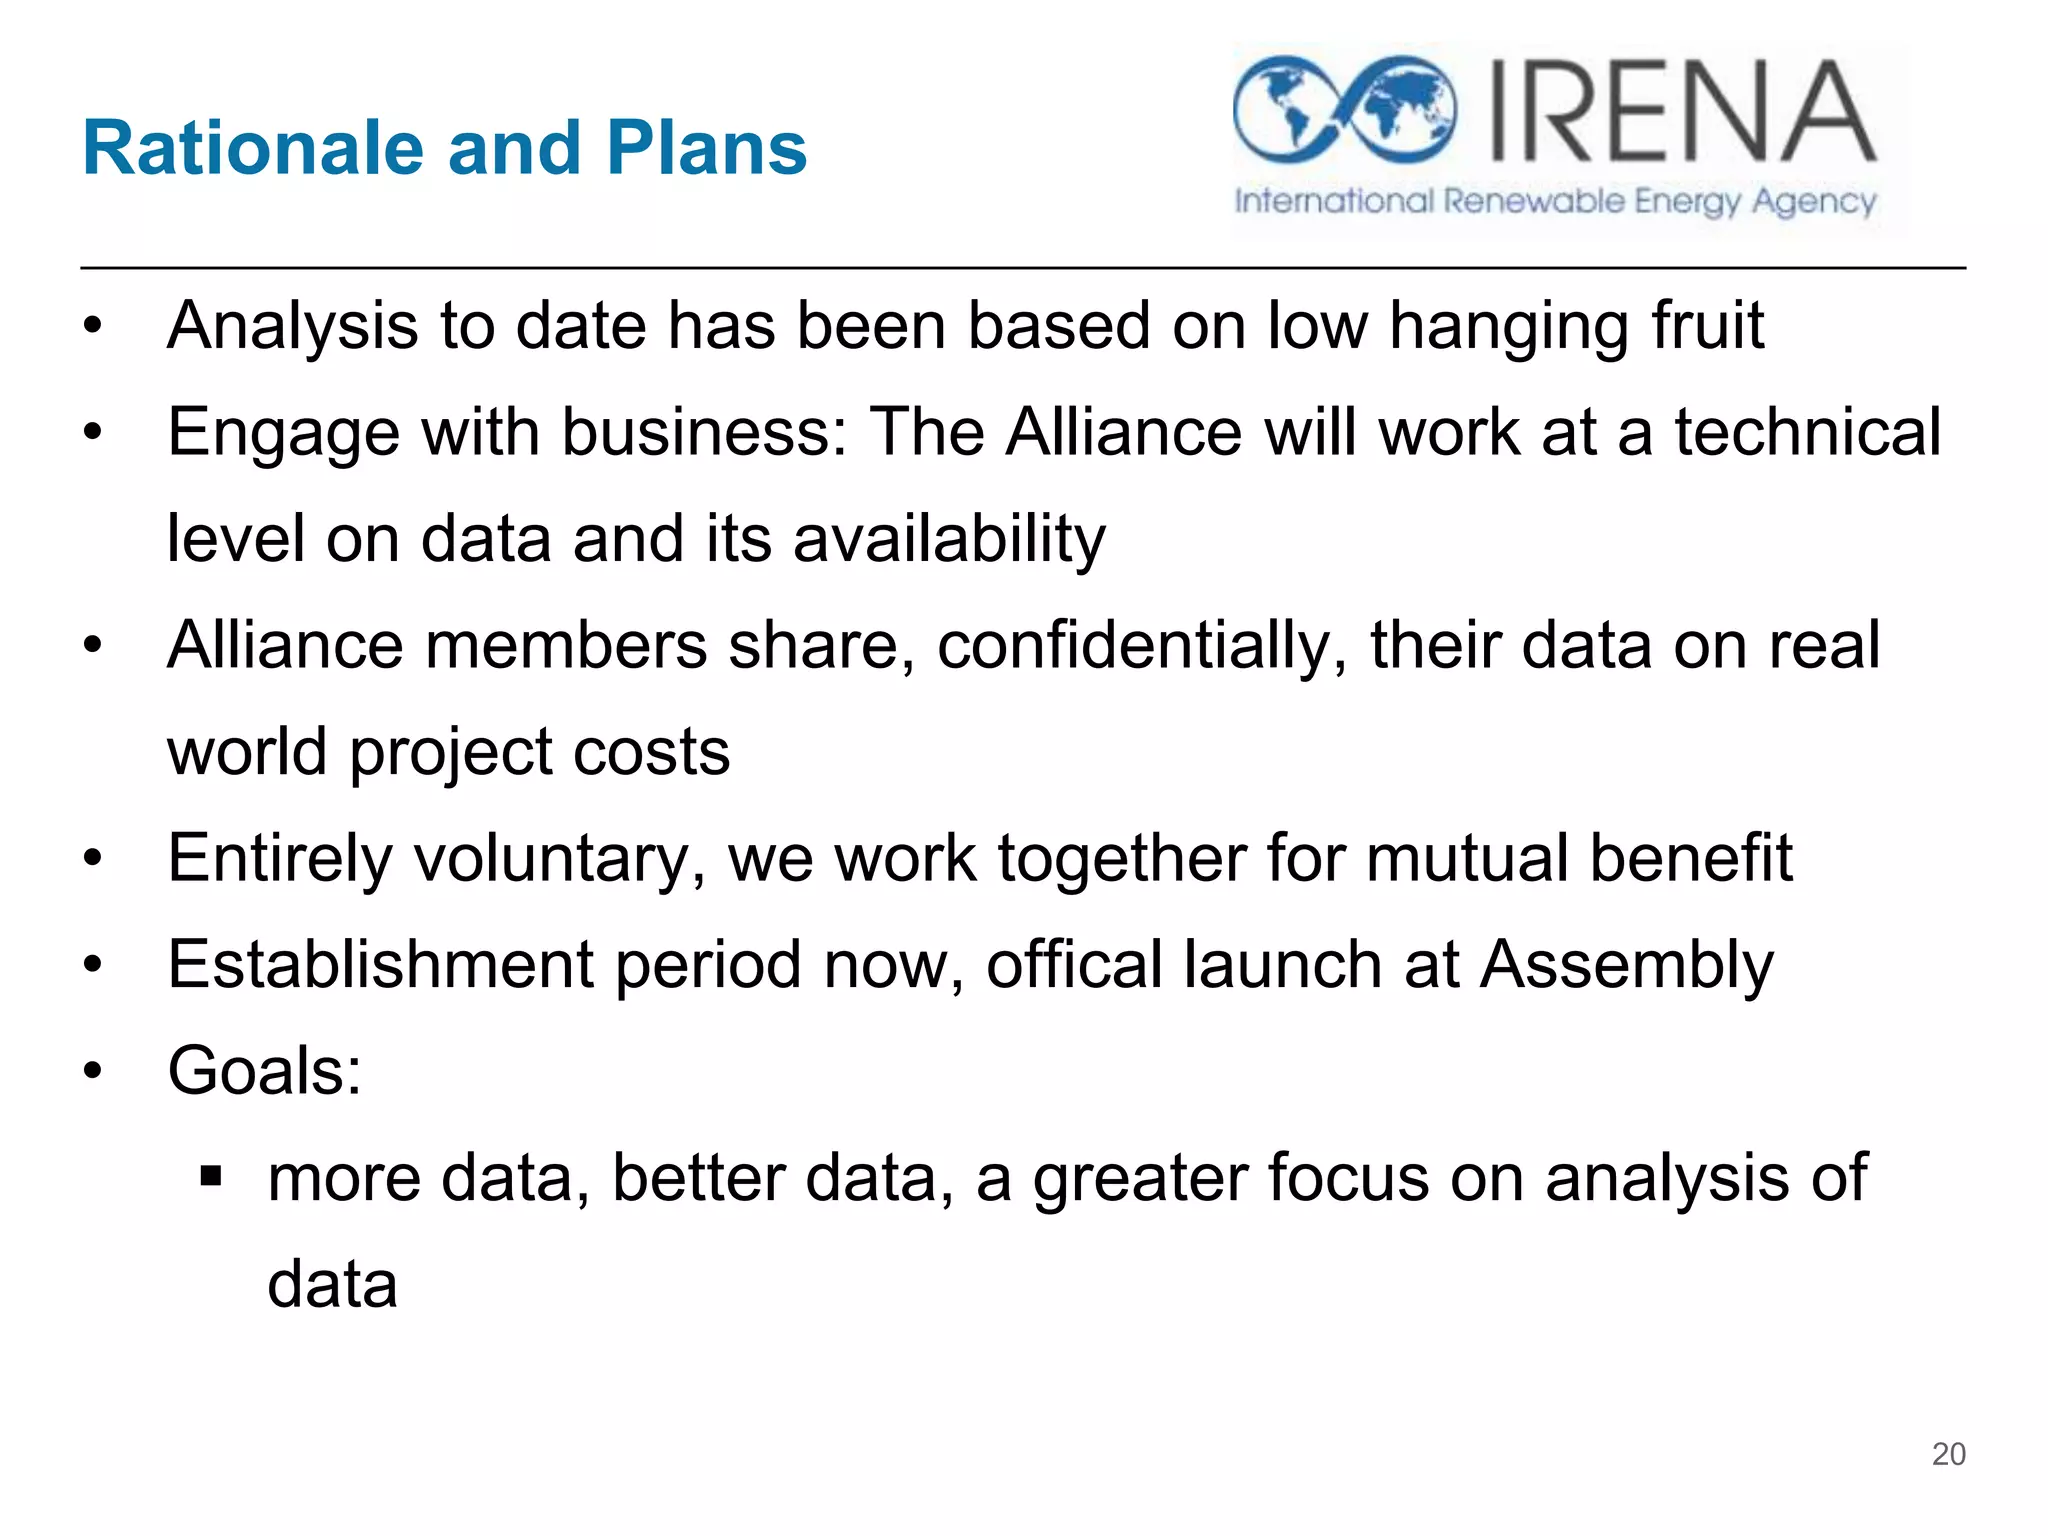
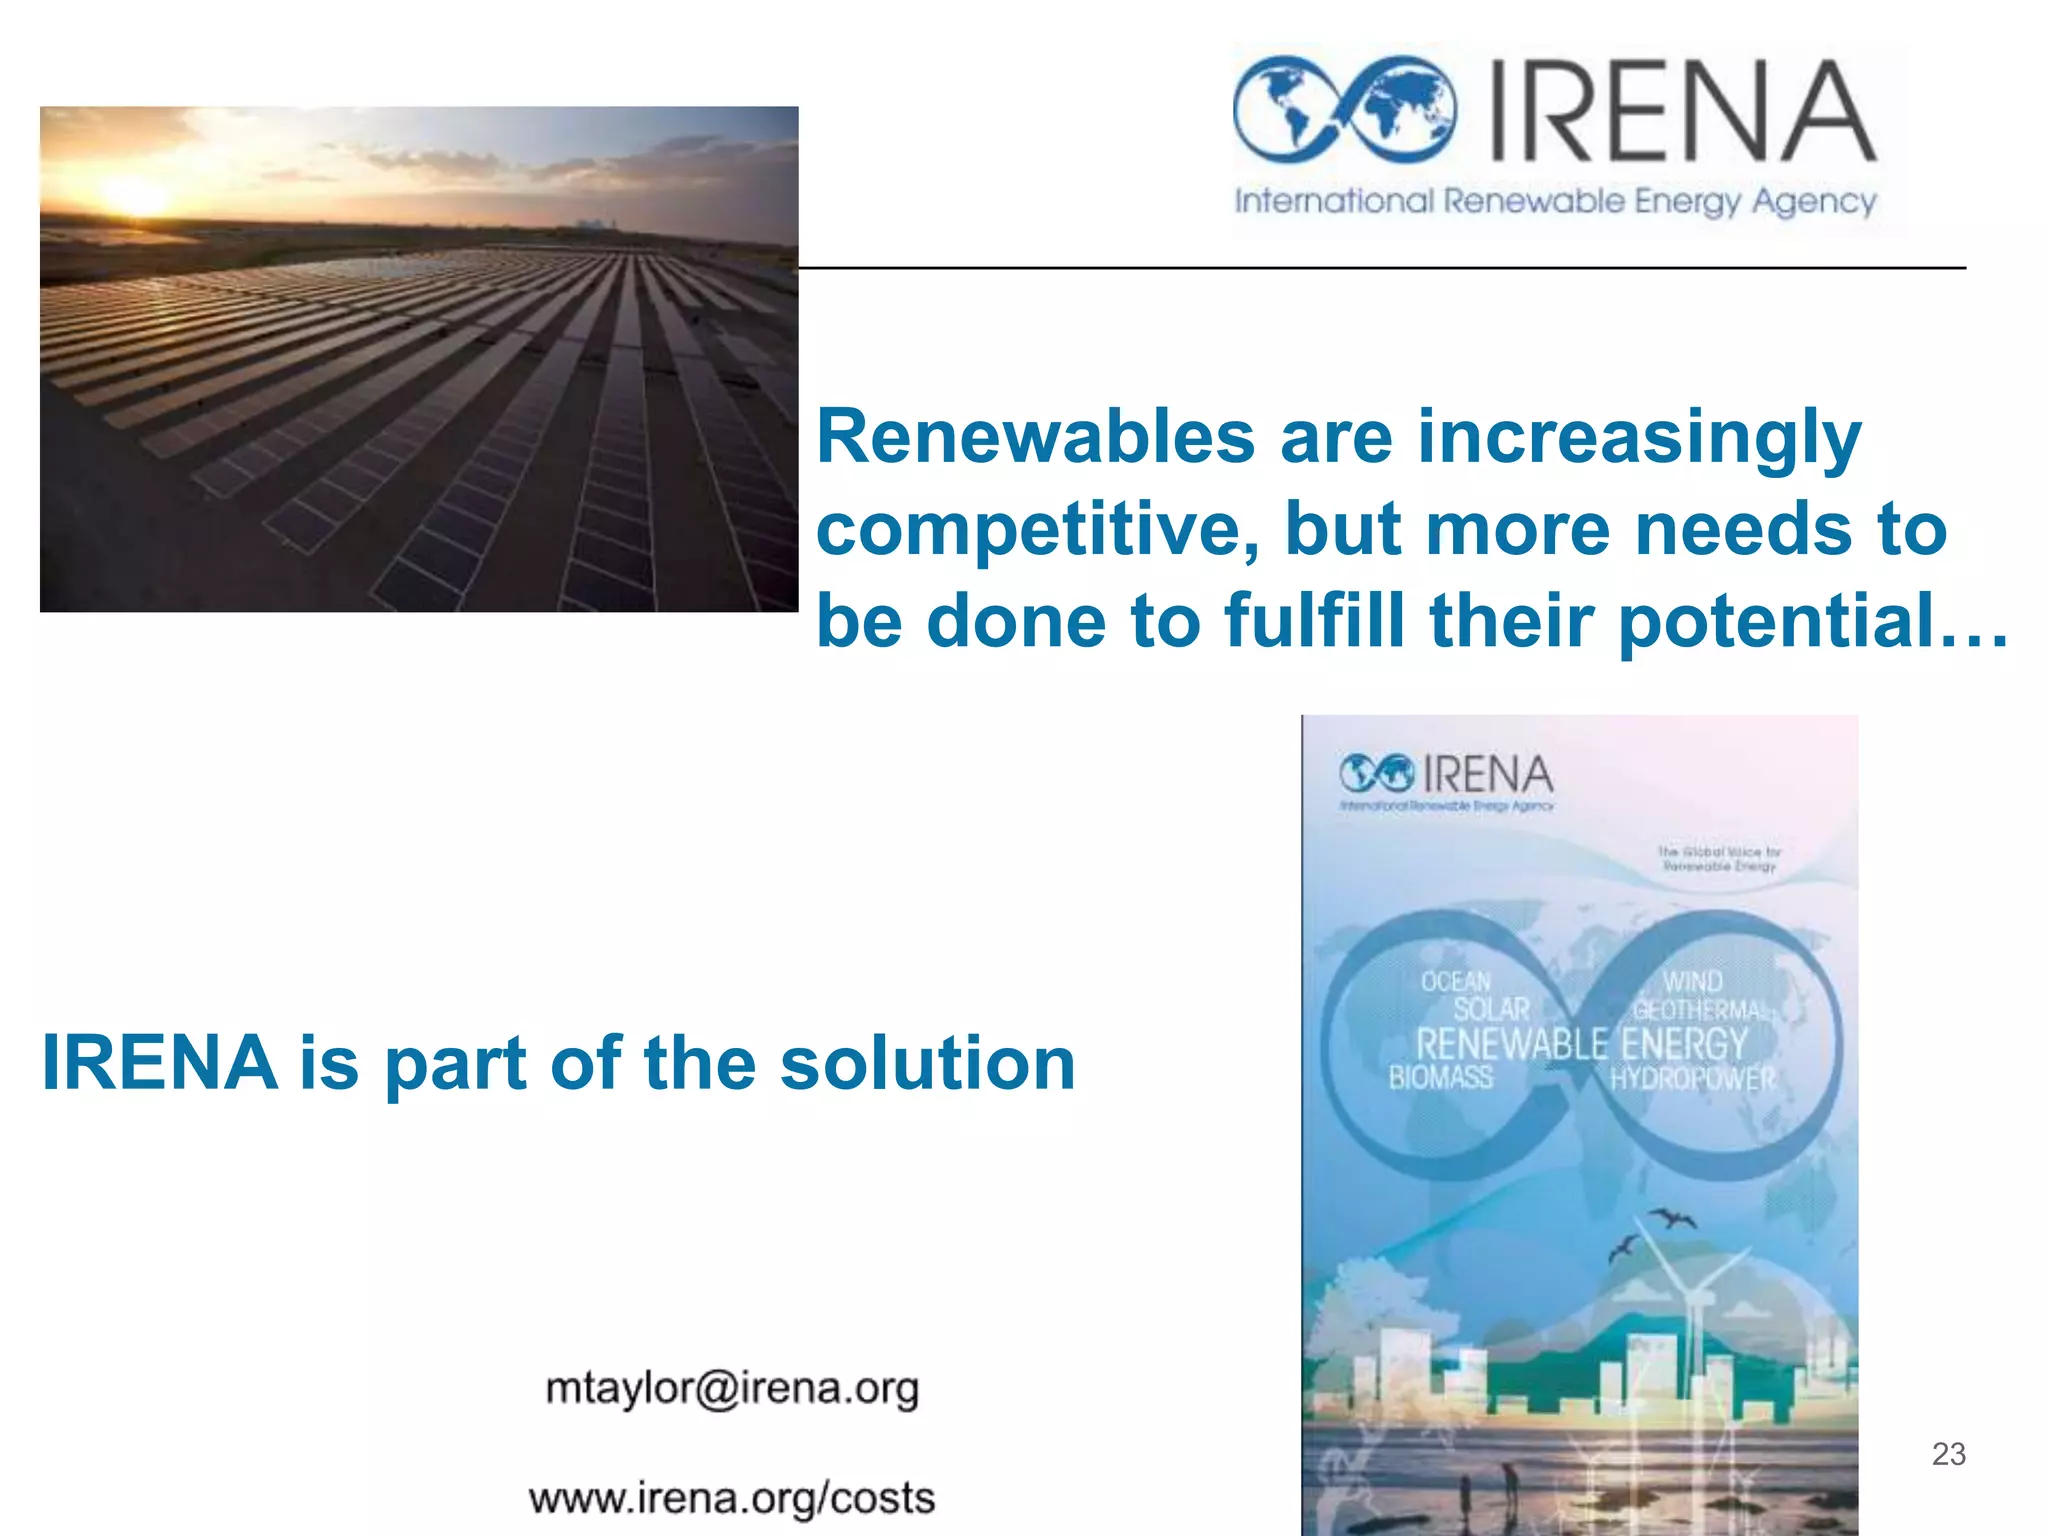
IRENA’s Power Generation
Costing Analysis:
PV in Focus
July 2013
Michael Taylor
mtaylor@irena.org
IRENA Innovation and Technology Centre
COSTING….
WHY?
HOW?
WITH WHOM?
2
Rationale and goals
• Renewable energy can meet policy goals for secure,
reliable and affordable energy and access.
• Lack of objective and up-to-date data is a barrier
• Decision making based on: outdated numbers, opinion
• IRENA to strive to become THE source for cost data
• Goals:
 Assist government decision-making, allow more ambitious policies
 Fill a significant information gap
• Coverage:
 Power generation (June 2012 and January 2013)
 Road Transport (July 2013)
 Stationary applications (2014) 3
Framework
4
Where to set the boundaries? How to get data?
Are costs even available? Prices, or price indicators?
Levelised cost of electricity (LCOE)
RENEWABLE POWER
GENERATION 2012
5
Key findings
6
• Renewables now THE economic solution off-grid and for
mini-grids, increasingly competitive for grid supply
• A shift in policy focus will need to come
• Dramatic price reductions for Solar PV. Onshore wind
competitive at best sites, CSP has great potential.
Hydropower, geothermal and biomass more mature
• Equipment cost declines and technology improvements
LCOEs are falling
• A convergence in LCOEs
• Data collection poses challenges
LCOE ranges and averages
7
Levelised cost of electricity
by country/region
8Note: assumes a 10% cost of capital
The LCOE of wind
© IRENA
2013 9
Higher
capacity
factors from
improved
technology
Wind
turbine
cost
reductions
Hydropower
• Mature technology, flexibility in design in many cases
• Lowest cost electricity of any source in many cases
• Importance will grow with penetration of variable RE
10
SOLAR PV:
11
Introduction
• Solar PV is democratising not only electricity but also
renewables
• Huge potential economic, environmental and social
dividends for developing countries in the sun belt
• Solar PV module prices have fallen rapidly, but much more
stable in 2013
• Grid parity for residential customers will become
increasingly the norm in Europe, but…
• Globally a very narrow market, deployment is not typically
where the sun is….much work needs to be done
12
PV modules prices
13
Learning rates for PV modules
14
Source: Bloomberg New Energy Finance, February, 2011
2013
Non-OECD installed costs for PV
(utility-scale)
15
Solar PV installed costs
16
An emerging/persistent issue:
Balance of system costs?
17
Cost reduction pass-through will be strongly tied to success in reducing BoS costs
Source: Seel, Barbose and Wiser, 2012
So what does all this mean?
18
REMAP: doubling the share of renewables by 2030
• Power sector has
the lowest costs
• Solar PV is an important
part of the solution
…and is set to become a
major source of electricity
PLANS FOR THE
IRENA RENEWABLE
COSTING ALLIANCE
AND
FUTURE WORK ON PV19
Rationale and Plans
• Analysis to date has been based on low hanging fruit
• Engage with business: The Alliance will work at a technical
level on data and its availability
• Alliance members share, confidentially, their data on real
world project costs
• Entirely voluntary, we work together for mutual benefit
• Establishment period now, offical launch at Assembly
• Goals:
 more data, better data, a greater focus on analysis of
data
20
Structure
Member countries:
Steering group for costing analysis focus
One workshop a year
Must nominate institution to deliver data
Quarterly newsletter
Alliance Members:
Provide data, confidentially
One workshop a year
Ability to query the database in detail
Quarterly newsletter
Observers:
Quarterly newsletter
Mailing list for new publications/analysis
21
Predicting solar flares…
or at least IRENA’s plans for PV
• PV Parity Indicators
• Economic opportunities mapping with the IRENA
Global Atlas
• In-depth analysis of emerging market costs and
market development
22
Renewables are increasingly
competitive, but more needs to
be done to fulfill their potential…
23
IRENA is part of the solution

Solar PV a major electricity source - An IRENA View

  • 1.
    IRENA’s Power Generation CostingAnalysis: PV in Focus July 2013 Michael Taylor mtaylor@irena.org IRENA Innovation and Technology Centre
  • 2.
  • 3.
    Rationale and goals •Renewable energy can meet policy goals for secure, reliable and affordable energy and access. • Lack of objective and up-to-date data is a barrier • Decision making based on: outdated numbers, opinion • IRENA to strive to become THE source for cost data • Goals:  Assist government decision-making, allow more ambitious policies  Fill a significant information gap • Coverage:  Power generation (June 2012 and January 2013)  Road Transport (July 2013)  Stationary applications (2014) 3
  • 4.
    Framework 4 Where to setthe boundaries? How to get data? Are costs even available? Prices, or price indicators? Levelised cost of electricity (LCOE)
  • 5.
  • 6.
    Key findings 6 • Renewablesnow THE economic solution off-grid and for mini-grids, increasingly competitive for grid supply • A shift in policy focus will need to come • Dramatic price reductions for Solar PV. Onshore wind competitive at best sites, CSP has great potential. Hydropower, geothermal and biomass more mature • Equipment cost declines and technology improvements LCOEs are falling • A convergence in LCOEs • Data collection poses challenges
  • 7.
    LCOE ranges andaverages 7
  • 8.
    Levelised cost ofelectricity by country/region 8Note: assumes a 10% cost of capital
  • 9.
    The LCOE ofwind © IRENA 2013 9 Higher capacity factors from improved technology Wind turbine cost reductions
  • 10.
    Hydropower • Mature technology,flexibility in design in many cases • Lowest cost electricity of any source in many cases • Importance will grow with penetration of variable RE 10
  • 11.
  • 12.
    Introduction • Solar PVis democratising not only electricity but also renewables • Huge potential economic, environmental and social dividends for developing countries in the sun belt • Solar PV module prices have fallen rapidly, but much more stable in 2013 • Grid parity for residential customers will become increasingly the norm in Europe, but… • Globally a very narrow market, deployment is not typically where the sun is….much work needs to be done 12
  • 13.
  • 14.
    Learning rates forPV modules 14 Source: Bloomberg New Energy Finance, February, 2011 2013
  • 15.
    Non-OECD installed costsfor PV (utility-scale) 15
  • 16.
  • 17.
    An emerging/persistent issue: Balanceof system costs? 17 Cost reduction pass-through will be strongly tied to success in reducing BoS costs Source: Seel, Barbose and Wiser, 2012
  • 18.
    So what doesall this mean? 18 REMAP: doubling the share of renewables by 2030 • Power sector has the lowest costs • Solar PV is an important part of the solution …and is set to become a major source of electricity
  • 19.
    PLANS FOR THE IRENARENEWABLE COSTING ALLIANCE AND FUTURE WORK ON PV19
  • 20.
    Rationale and Plans •Analysis to date has been based on low hanging fruit • Engage with business: The Alliance will work at a technical level on data and its availability • Alliance members share, confidentially, their data on real world project costs • Entirely voluntary, we work together for mutual benefit • Establishment period now, offical launch at Assembly • Goals:  more data, better data, a greater focus on analysis of data 20
  • 21.
    Structure Member countries: Steering groupfor costing analysis focus One workshop a year Must nominate institution to deliver data Quarterly newsletter Alliance Members: Provide data, confidentially One workshop a year Ability to query the database in detail Quarterly newsletter Observers: Quarterly newsletter Mailing list for new publications/analysis 21
  • 22.
    Predicting solar flares… orat least IRENA’s plans for PV • PV Parity Indicators • Economic opportunities mapping with the IRENA Global Atlas • In-depth analysis of emerging market costs and market development 22
  • 23.
    Renewables are increasingly competitive,but more needs to be done to fulfill their potential… 23 IRENA is part of the solution