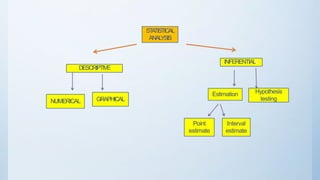
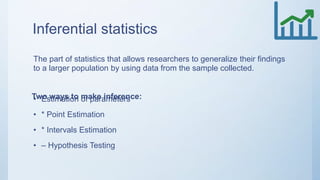
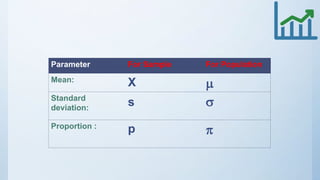
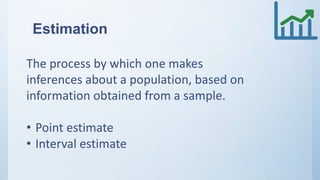
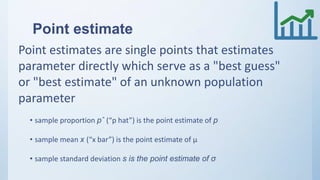
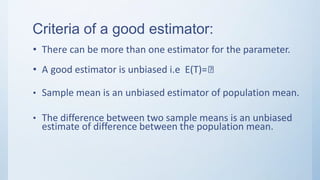
Estimation
and
Hypothesis
Testing for sample Mean
Group Members
 Junaid Ijaz
 Wajahat Saadat
 Asfand Yar Tahir
 Sohaib Arshad
 Daud Amir
 Salman Abbasi
 Aqib Sharif
Content
• Inferential statistics
• Estimation
• Application of Estimation
• Hypothesis
• Application of Hypothesis
• References
STATISTICAL
ANALYSIS
DESCRIPTIVE
INFERENTIALL
NUMERICAL GRAPHICAL
Estimation Hypothesis
testing
Point
estimate
Interval
estimate
Inferential statistics
The part of statistics that allows researchers to generalize their findings
to a larger population by using data from the sample collected.
• Estimation of parameters
• * Point Estimation
• * Intervals Estimation
• – Hypothesis Testing
Two ways to make inference:
Parameter For Sample For Population
Mean: X 
Standard
deviation:
s 
Proportion : p 
Estimation
The process by which one makes
inferences about a population, based on
information obtained from a sample.
• Point estimate
• Interval estimate
Point estimate
Point estimates are single points that estimates
parameter directly which serve as a "best guess"
or "best estimate" of an unknown population
parameter
• sample proportion pˆ (“p hat”) is the point estimate of p
• sample mean x (“x bar”) is the point estimate of μ
• sample standard deviation s is the point estimate of σ
Criteria of a good estimator:
• There can be more than one estimator for the parameter.
• A good estimator is unbiased i.e E(T)=
• Sample mean is an unbiased estimator of population mean.
• The difference between two sample means is an unbiased
estimate of difference between the population mean.
Disadvantages of point estimates
• Point estimate do not provide
(i) Information about sample to sample variability
(ii) How precise is x(Sample mean) as an estimate of μ(Population mean)
(iii) How much can we expect x vary from μ
Interval Estimation:
• In interval estimation, an interval is constructed around the point estimate, and it is
stated that this interval is likely to contain the corresponding population parameter.
In general an interval estimate may be expressed as follows
margin of error
estimator (reliability coefficient) (standarderror)
• 𝑥  z(1   / 2 )x
Standard Error
• The standard error(SE) is very similar to standard deviation. Both are
measures of spread. The higher the number, the more spread out your
data is. To put it simply, the two terms are essentially equal — but there
is one important difference. While the standard error
uses statistics (sample data) standard deviations
use parameters (population data).
• isthe probability that the interval computed from the sampledata includes
the population parameter of interest
Confidence level:
n

(1- a )100%
Process for Constructing Confidence
Intervals
• Compute the sample statistic (e.g. amean)
• Compute the standard error of themean
• Make adecision about level of confidence thatis desired (usually 95%or
99%)
• Find tabled value for 95%or 99%confidence interval
• Multiply standard error of the mean by thetabled value
• Forminterval by adding andsubtracting calculated value to and
from themean
Z- Distribution
• When Population parimeters (Standard daviation) Are Known
• Then we use confidence level to find value of reliability coefficient From
table of standard normal distribution
T- Distribution
• When Population parimeters (Standard daviation) Are not Known
• Then we use confidence level and degree of fredom to find value of
reliability coefficient From table of T-distribution
FACTORSAFFECTING CONFIDENCE
INTERVAL
• (a)Level of confidence:
Greater the level of confidence greater will be the interval
• (b)Sample size (N):
Greater the sample size greater will be the interval
• (c)Data variability():
 value of a sample is not under the control of the
investigator. Hence, the width of a confidence interval cannot be
controlled using 
Application of Estimation in Civi
Engineering
COST ESTIMATION
• ESTIMATING MATERIALS
• ESTIMATING PROJECT TIME
• ESTIMATING LABOR
Environmental Engineering
• ESTIMATING ANNUAL INCREASE IN TEMPERATURE
• GLOBAL WARMING
• ANNUAL RAINFALL
• ESTIMATING PARAMETER CONTRIBUTING TO
POLUUTION
URBAN PLANNING
• A city planning estimate is the estimation of the maximum permissible
construction parameters, conditions of combining the architectural planning
and maintenance system, engineering communications, and transport
service.
• It may include estimation of population parameter, water requirement and
drainage.
TRAFFIC ENGINEERING
• ESTIMATING TRAFFIC DENSITY:
Traffic density is a major congestion indicator, and because its
measurement is difficult, it is usually estimated from other readily
measurable parameters.
Traffic flow model is formulate, and using this model, a model-based
estimation scheme is designed.
What is aHypothesis?
I assume the mean SBPof
An assumption about population is 120mmHg
thepopulation
parameter.
Hypothesis
• Hypothesis is a predictive statement, capable of being tested
by scientific methods, that relates an independent variables
to some dependent variable.
• A hypothesis states what we are looking for and it is a
proportion which can be put to a test to determine its validity
• e.g.
• Students who receive counseling will show a greater increase
in creativity than students not receiving counseling
Characteristics of Hypothesis
• Clear and precise.
• Capable of being tested.
• Stated relationship between variables.
• limited in scope and must be specific.
• Stated as far as possible in most simple terms so that the same is
easily understand by all concerned. But one must remember that
simplicity of hypothesis has nothing to do with its significance.
• Consistent with most known facts.
• Responsive to testing with in a reasonable time. One can’t spend a
life time collecting data to test it.
• Explain what it claims to explain; it should have empirical reference.
Types of Hypothesis
• NullHypothesis
• AlternativeHypothesis
Null Hypothesis
• It is an assertion that we hold as true unless we have sufficient
statistical evidence to conclude otherwise.
• Null Hypothesis is denoted by 𝐻0
• If a population mean is equal to hypothesised mean then Null
Hypothesis can be written as
• 𝐻0: 𝜇 =𝜇0
Alternative Hypothesis
The Alternative hypothesis is negation
of null hypothesis and is denoted by 𝐻 𝑎
IfNull is given as 𝐻0: 𝜇 =𝜇0
Then alternative Hypothesis can
be written as
𝐻 𝑎: 𝜇 ≠𝜇0
𝐻 𝑎: 𝜇 >𝜇0
𝐻 𝑎: 𝜇 <𝜇0
Level of significanceand confidence
• Significance means the percentage risk to reject a null
hypothesis when it is true and it is denoted by 𝛼. Generally
taken as 1%,5%,10%
• (1 − 𝛼) is the confidence interval in which the null hypothesis
will exist when it istrue.
Two tailed test@5% Significance
level
Acceptance and Rejection
regions in case of a Two
tailed test
𝑅𝑒𝑗𝑒𝑐𝑡𝑖𝑜𝑛 𝑟𝑒𝑔𝑖𝑜𝑛
/𝑠𝑖𝑔𝑛𝑖𝑓𝑖𝑐𝑎𝑛𝑐𝑒 𝑙𝑒𝑣𝑒𝑙
(𝛼 =0.025 𝑜𝑟 2.5%)
𝑅𝑒𝑗𝑒𝑐𝑡𝑖𝑜𝑛 𝑟𝑒𝑔𝑖𝑜𝑛
/𝑠𝑖𝑔𝑛𝑖𝑓𝑖𝑐𝑎𝑛𝑐𝑒 𝑙𝑒𝑣𝑒𝑙
(𝛼 = 0.025 𝑜𝑟 2.5%)
Suitable
When
𝐻0: 𝜇 = 𝜇0
𝐻 𝑎: 𝜇 ≠ 𝜇0
𝑇𝑜𝑡 𝑎𝑙𝐴𝑐𝑐𝑒𝑝𝑡𝑎𝑛𝑐𝑒 𝑟𝑒𝑔𝑖 𝑜 𝑛
𝑜𝑟𝑐𝑜𝑛𝑓𝑖 𝑑𝑒𝑛𝑐𝑒 𝑙𝑒𝑣𝑒𝑙
(1 −𝛼) = 95%
𝐻0: 𝜇 = 𝜇0
Left tailed test@5% Significancelevel
Acceptance and Rejection
regions in case of a left tailed
test
𝐻0: 𝜇 = 𝜇0
𝑇𝑜𝑡𝑎𝑙𝐴𝑐𝑐𝑒𝑝𝑡𝑎𝑛𝑐𝑒 𝑟𝑒𝑔𝑖 𝑜 𝑛
𝑜𝑟𝑐𝑜𝑛𝑓𝑖 𝑑𝑒𝑛𝑐𝑒𝑙𝑒𝑣𝑒𝑙(1 −
𝛼) = 95%
𝑅𝑒𝑗𝑒𝑐𝑡𝑖𝑜 𝑛𝑟𝑒𝑔𝑖 𝑜 𝑛
/𝑠𝑖 𝑔 𝑛𝑖 𝑓𝑖𝑐 𝑎𝑛𝑐𝑒𝑙𝑒𝑣𝑒𝑙
(𝛼 =0.05 𝑜𝑟5%)
SuitableWhen 𝐻0: 𝜇 = 𝜇0
𝐻 𝑎: 𝜇 < 𝜇0
Right tailed test@5% Significancelevel
Acceptance and Rejection
regions in case of a Right
tailed test
SuitableWhen 𝐻0: 𝜇 = 𝜇0
𝐻 𝑎: 𝜇 > 𝜇0
𝑇𝑜𝑡 𝑎𝑙𝐴𝑐𝑐𝑒𝑝𝑡𝑎𝑛𝑐𝑒 𝑟𝑒𝑔𝑖 𝑜 𝑛
𝑜𝑟𝑐𝑜𝑛𝑓𝑖 𝑑𝑒𝑛𝑐𝑒 𝑙𝑒𝑣𝑒𝑙
(1 −𝛼) = 95%
𝐻0: 𝜇 = 𝜇0
𝑅𝑒𝑗𝑒𝑐𝑡𝑖𝑜 𝑛𝑟𝑒𝑔𝑖 𝑜 𝑛
/𝑠𝑖 𝑔 𝑛𝑖 𝑓𝑖𝑐 𝑎𝑛𝑐𝑒𝑙𝑒𝑣𝑒𝑙
(𝛼 =0.05 𝑜𝑟 5%)
Procedure for Hypothesis Testing
State the null
(Ho)and alternate
(Ha) Hypothesis
State a
significance level;
1%,5%,10%etc.
Decide a test
statistics; z-test, t-
test.
Calculate the
value of test
statistics
Do the required
calculations
Define the
critical
region
through z
table
If z fall in
critical
region
If z doesn’t
fall in the
critical
region
Accept Ho
Reject Ho
Hypothesis Testing of Means
• Z-TEST
• T-TEST
Z-Testfor testing
means
TestCondition
Population normal and
infinite
Sample size large orsmall,
Population variance is
known
Ha may be one-sided or
two sided
TestStatistics
𝑋−𝜇 𝐻0
𝑧= 𝜎 𝑝
𝑛
Z-Testfor testing
means
TestCondition
Population is infinite and
may not be normal,
Sample size islarge,
Population variance is
unknown
Ha may be one-sided or
two sided
TestStatistics
𝑋−𝜇 𝐻0
𝑧= 𝜎 𝑠
𝑛
T-Testfor testing
means
TestCondition
Population is infinite and
normal,
Sample size issmall,
Population variance is
unknown
Ha may be one-sided or
two sided
TestStatistics
𝑋−𝜇 𝐻0
𝑡= 𝜎 𝑠
𝑛
𝑤𝑖𝑡ℎ 𝑑. 𝑓.= 𝑛−1
𝜎𝑠 =
𝑋𝑖−𝑋 2
(𝑛 −1)
Type Iand Type IIError
Situation
Decision
Accept Null Reject Null
Null istrue Correct Type Ierror
( 𝛼 𝑒𝑟𝑟𝑜𝑟)
Null isfalse Type IIerror
( 𝛽 𝑒𝑟𝑟𝑜𝑟)
Correct
Limitations of the testof Hypothesis
• Testing of hypothesis is not decision making itself; but help for
decision making
• Test does not explain the reasons as why the difference exist, it
only indicate that the difference isdue to fluctuations of
sampling or because of other reasons but the tests do not tell
about the reason causing the difference.
• Tests are based on the probabilities and as such cannot be
expressed with fullcertainty.
• Statistical inferences based on the significancetests cannot
be said to be entirely correct evidences concerning the
truth of the hypothesis.
Practical Uses of
Hypothesis Testing
In Civil Engineering
• A failure of civil structure can cause fatal destructions which could have
devastating effects on contractor’s firm and engineer’s career.
• Engineers can predict the outcomes of any hypothesis precisely by
using statistical hypothesis testing.
• Data like seismic activity, annual precipitation, rate of silt deposition in
dams etc. can be used in hypothesis testing.
Human Gender Ratio
• It is the ratio of males to the females in a population.
• Gender Imbalance may leads to many problems that are prevailing in
some parts of the world.
• Consequences of Gender imbalance may include:
– Rapid decline in fertility
– Differential marital statistics
– Increase in antisocial behavior and violence
• The earliest use of statistical hypothesis testing is to the
question of whether male and female births are equally
likely (null hypothesis), which was addressed in the
1700s by John Arbuthnot (1710)
• John Arbuthnot, in 1710, was the first person who used
hypothesis testing to question whether male and female
births are equally likely or not.
• Arbuthnot examined birth records in London for each of
the 82 years from 1629 to 1710.
• He concluded that every year, the number of males born
in London exceeded the number of females. The
probability of the observed outcome is 0.582.
• Laplace, 1770, considered the statistics of almost half a
million births.
• The statistics showed an excess of boys compared to
girls.
• He concluded by calculation of a p-value that the
excess was a real, but unexplained, effect.
Courtroom Trial
• A defendant is considered not guilty as long as his/her guilt is not
proven. Only when there is enough evidence for the prosecution then
the defendant is convicted.
• A criminal trial can be regarded as either or both of two decision
processes: guilty vs not guilty or evidence vs a threshold.
• A hypothesis test can be regarded as either a judgment of a hypothesis
or as a judgment of evidence.
Business Applications
• Generally firms proposes a monthly income investment plan that
promises a variable return each month.
• The real challenge is taking precise decisions at appropriate times.
• Hypothesis Testing can make a businessman’s life easier.
Medical Applications
• Sometimes medics have to take risks while conducting operations or
proposing a medicine which may have side reactions on a patient.
• A wrong decision can consume a life.
• By visualizing genetics data and reactions of medicine/surgery on
various patients, doctors and surgeons can precisely take correct
decisions.
References
• http://stattrek.com/estimation/estimation-in-statistics.aspx
• http://www.cabrillo.edu/~evenable/Ch08.pdf
• https://courses.lumenlearning.com/wmopen-concepts-statistics/chapter/estimating-a-
population-mean-1-of-3/
• https://www.cliffsnotes.com/study-guides/statistics/principles-of-testing/point-
estimates-and-confidence-intervals
• https://www.cliffsnotes.com/study-guides/statistics/principles-of-testing/point-
estimates-and-confidence-intervals
Thanks

Estimation and hypothesis

  • 1.
  • 2.
    Group Members  JunaidIjaz  Wajahat Saadat  Asfand Yar Tahir  Sohaib Arshad  Daud Amir  Salman Abbasi  Aqib Sharif
  • 3.
    Content • Inferential statistics •Estimation • Application of Estimation • Hypothesis • Application of Hypothesis • References
  • 4.
  • 5.
    Inferential statistics The partof statistics that allows researchers to generalize their findings to a larger population by using data from the sample collected. • Estimation of parameters • * Point Estimation • * Intervals Estimation • – Hypothesis Testing Two ways to make inference:
  • 6.
    Parameter For SampleFor Population Mean: X  Standard deviation: s  Proportion : p 
  • 7.
    Estimation The process bywhich one makes inferences about a population, based on information obtained from a sample. • Point estimate • Interval estimate
  • 8.
    Point estimate Point estimatesare single points that estimates parameter directly which serve as a "best guess" or "best estimate" of an unknown population parameter • sample proportion pˆ (“p hat”) is the point estimate of p • sample mean x (“x bar”) is the point estimate of μ • sample standard deviation s is the point estimate of σ
  • 9.
    Criteria of agood estimator: • There can be more than one estimator for the parameter. • A good estimator is unbiased i.e E(T)= • Sample mean is an unbiased estimator of population mean. • The difference between two sample means is an unbiased estimate of difference between the population mean.
  • 10.
    Disadvantages of pointestimates • Point estimate do not provide (i) Information about sample to sample variability (ii) How precise is x(Sample mean) as an estimate of μ(Population mean) (iii) How much can we expect x vary from μ
  • 11.
    Interval Estimation: • Ininterval estimation, an interval is constructed around the point estimate, and it is stated that this interval is likely to contain the corresponding population parameter. In general an interval estimate may be expressed as follows margin of error estimator (reliability coefficient) (standarderror) • 𝑥  z(1   / 2 )x
  • 12.
    Standard Error • Thestandard error(SE) is very similar to standard deviation. Both are measures of spread. The higher the number, the more spread out your data is. To put it simply, the two terms are essentially equal — but there is one important difference. While the standard error uses statistics (sample data) standard deviations use parameters (population data). • isthe probability that the interval computed from the sampledata includes the population parameter of interest Confidence level: n  (1- a )100%
  • 13.
    Process for ConstructingConfidence Intervals • Compute the sample statistic (e.g. amean) • Compute the standard error of themean • Make adecision about level of confidence thatis desired (usually 95%or 99%) • Find tabled value for 95%or 99%confidence interval • Multiply standard error of the mean by thetabled value • Forminterval by adding andsubtracting calculated value to and from themean
  • 14.
    Z- Distribution • WhenPopulation parimeters (Standard daviation) Are Known • Then we use confidence level to find value of reliability coefficient From table of standard normal distribution T- Distribution • When Population parimeters (Standard daviation) Are not Known • Then we use confidence level and degree of fredom to find value of reliability coefficient From table of T-distribution
  • 15.
    FACTORSAFFECTING CONFIDENCE INTERVAL • (a)Levelof confidence: Greater the level of confidence greater will be the interval • (b)Sample size (N): Greater the sample size greater will be the interval • (c)Data variability():  value of a sample is not under the control of the investigator. Hence, the width of a confidence interval cannot be controlled using 
  • 17.
    Application of Estimationin Civi Engineering
  • 18.
  • 19.
    • ESTIMATING MATERIALS •ESTIMATING PROJECT TIME • ESTIMATING LABOR
  • 20.
  • 21.
    • ESTIMATING ANNUALINCREASE IN TEMPERATURE • GLOBAL WARMING • ANNUAL RAINFALL • ESTIMATING PARAMETER CONTRIBUTING TO POLUUTION
  • 22.
  • 23.
    • A cityplanning estimate is the estimation of the maximum permissible construction parameters, conditions of combining the architectural planning and maintenance system, engineering communications, and transport service. • It may include estimation of population parameter, water requirement and drainage.
  • 24.
  • 25.
    • ESTIMATING TRAFFICDENSITY: Traffic density is a major congestion indicator, and because its measurement is difficult, it is usually estimated from other readily measurable parameters. Traffic flow model is formulate, and using this model, a model-based estimation scheme is designed.
  • 27.
    What is aHypothesis? Iassume the mean SBPof An assumption about population is 120mmHg thepopulation parameter.
  • 28.
    Hypothesis • Hypothesis isa predictive statement, capable of being tested by scientific methods, that relates an independent variables to some dependent variable. • A hypothesis states what we are looking for and it is a proportion which can be put to a test to determine its validity • e.g. • Students who receive counseling will show a greater increase in creativity than students not receiving counseling
  • 29.
    Characteristics of Hypothesis •Clear and precise. • Capable of being tested. • Stated relationship between variables. • limited in scope and must be specific. • Stated as far as possible in most simple terms so that the same is easily understand by all concerned. But one must remember that simplicity of hypothesis has nothing to do with its significance. • Consistent with most known facts. • Responsive to testing with in a reasonable time. One can’t spend a life time collecting data to test it. • Explain what it claims to explain; it should have empirical reference.
  • 30.
    Types of Hypothesis •NullHypothesis • AlternativeHypothesis
  • 31.
    Null Hypothesis • Itis an assertion that we hold as true unless we have sufficient statistical evidence to conclude otherwise. • Null Hypothesis is denoted by 𝐻0 • If a population mean is equal to hypothesised mean then Null Hypothesis can be written as • 𝐻0: 𝜇 =𝜇0
  • 32.
    Alternative Hypothesis The Alternativehypothesis is negation of null hypothesis and is denoted by 𝐻 𝑎 IfNull is given as 𝐻0: 𝜇 =𝜇0 Then alternative Hypothesis can be written as 𝐻 𝑎: 𝜇 ≠𝜇0 𝐻 𝑎: 𝜇 >𝜇0 𝐻 𝑎: 𝜇 <𝜇0
  • 33.
    Level of significanceandconfidence • Significance means the percentage risk to reject a null hypothesis when it is true and it is denoted by 𝛼. Generally taken as 1%,5%,10% • (1 − 𝛼) is the confidence interval in which the null hypothesis will exist when it istrue.
  • 34.
    Two tailed test@5%Significance level Acceptance and Rejection regions in case of a Two tailed test 𝑅𝑒𝑗𝑒𝑐𝑡𝑖𝑜𝑛 𝑟𝑒𝑔𝑖𝑜𝑛 /𝑠𝑖𝑔𝑛𝑖𝑓𝑖𝑐𝑎𝑛𝑐𝑒 𝑙𝑒𝑣𝑒𝑙 (𝛼 =0.025 𝑜𝑟 2.5%) 𝑅𝑒𝑗𝑒𝑐𝑡𝑖𝑜𝑛 𝑟𝑒𝑔𝑖𝑜𝑛 /𝑠𝑖𝑔𝑛𝑖𝑓𝑖𝑐𝑎𝑛𝑐𝑒 𝑙𝑒𝑣𝑒𝑙 (𝛼 = 0.025 𝑜𝑟 2.5%) Suitable When 𝐻0: 𝜇 = 𝜇0 𝐻 𝑎: 𝜇 ≠ 𝜇0 𝑇𝑜𝑡 𝑎𝑙𝐴𝑐𝑐𝑒𝑝𝑡𝑎𝑛𝑐𝑒 𝑟𝑒𝑔𝑖 𝑜 𝑛 𝑜𝑟𝑐𝑜𝑛𝑓𝑖 𝑑𝑒𝑛𝑐𝑒 𝑙𝑒𝑣𝑒𝑙 (1 −𝛼) = 95% 𝐻0: 𝜇 = 𝜇0
  • 35.
    Left tailed test@5%Significancelevel Acceptance and Rejection regions in case of a left tailed test 𝐻0: 𝜇 = 𝜇0 𝑇𝑜𝑡𝑎𝑙𝐴𝑐𝑐𝑒𝑝𝑡𝑎𝑛𝑐𝑒 𝑟𝑒𝑔𝑖 𝑜 𝑛 𝑜𝑟𝑐𝑜𝑛𝑓𝑖 𝑑𝑒𝑛𝑐𝑒𝑙𝑒𝑣𝑒𝑙(1 − 𝛼) = 95% 𝑅𝑒𝑗𝑒𝑐𝑡𝑖𝑜 𝑛𝑟𝑒𝑔𝑖 𝑜 𝑛 /𝑠𝑖 𝑔 𝑛𝑖 𝑓𝑖𝑐 𝑎𝑛𝑐𝑒𝑙𝑒𝑣𝑒𝑙 (𝛼 =0.05 𝑜𝑟5%) SuitableWhen 𝐻0: 𝜇 = 𝜇0 𝐻 𝑎: 𝜇 < 𝜇0
  • 36.
    Right tailed test@5%Significancelevel Acceptance and Rejection regions in case of a Right tailed test SuitableWhen 𝐻0: 𝜇 = 𝜇0 𝐻 𝑎: 𝜇 > 𝜇0 𝑇𝑜𝑡 𝑎𝑙𝐴𝑐𝑐𝑒𝑝𝑡𝑎𝑛𝑐𝑒 𝑟𝑒𝑔𝑖 𝑜 𝑛 𝑜𝑟𝑐𝑜𝑛𝑓𝑖 𝑑𝑒𝑛𝑐𝑒 𝑙𝑒𝑣𝑒𝑙 (1 −𝛼) = 95% 𝐻0: 𝜇 = 𝜇0 𝑅𝑒𝑗𝑒𝑐𝑡𝑖𝑜 𝑛𝑟𝑒𝑔𝑖 𝑜 𝑛 /𝑠𝑖 𝑔 𝑛𝑖 𝑓𝑖𝑐 𝑎𝑛𝑐𝑒𝑙𝑒𝑣𝑒𝑙 (𝛼 =0.05 𝑜𝑟 5%)
  • 37.
    Procedure for HypothesisTesting State the null (Ho)and alternate (Ha) Hypothesis State a significance level; 1%,5%,10%etc. Decide a test statistics; z-test, t- test. Calculate the value of test statistics Do the required calculations Define the critical region through z table If z fall in critical region If z doesn’t fall in the critical region Accept Ho Reject Ho
  • 38.
    Hypothesis Testing ofMeans • Z-TEST • T-TEST
  • 39.
    Z-Testfor testing means TestCondition Population normaland infinite Sample size large orsmall, Population variance is known Ha may be one-sided or two sided TestStatistics 𝑋−𝜇 𝐻0 𝑧= 𝜎 𝑝 𝑛
  • 40.
    Z-Testfor testing means TestCondition Population isinfinite and may not be normal, Sample size islarge, Population variance is unknown Ha may be one-sided or two sided TestStatistics 𝑋−𝜇 𝐻0 𝑧= 𝜎 𝑠 𝑛
  • 41.
    T-Testfor testing means TestCondition Population isinfinite and normal, Sample size issmall, Population variance is unknown Ha may be one-sided or two sided TestStatistics 𝑋−𝜇 𝐻0 𝑡= 𝜎 𝑠 𝑛 𝑤𝑖𝑡ℎ 𝑑. 𝑓.= 𝑛−1 𝜎𝑠 = 𝑋𝑖−𝑋 2 (𝑛 −1)
  • 42.
    Type Iand TypeIIError Situation Decision Accept Null Reject Null Null istrue Correct Type Ierror ( 𝛼 𝑒𝑟𝑟𝑜𝑟) Null isfalse Type IIerror ( 𝛽 𝑒𝑟𝑟𝑜𝑟) Correct
  • 43.
    Limitations of thetestof Hypothesis • Testing of hypothesis is not decision making itself; but help for decision making • Test does not explain the reasons as why the difference exist, it only indicate that the difference isdue to fluctuations of sampling or because of other reasons but the tests do not tell about the reason causing the difference. • Tests are based on the probabilities and as such cannot be expressed with fullcertainty. • Statistical inferences based on the significancetests cannot be said to be entirely correct evidences concerning the truth of the hypothesis.
  • 44.
  • 45.
    In Civil Engineering •A failure of civil structure can cause fatal destructions which could have devastating effects on contractor’s firm and engineer’s career. • Engineers can predict the outcomes of any hypothesis precisely by using statistical hypothesis testing. • Data like seismic activity, annual precipitation, rate of silt deposition in dams etc. can be used in hypothesis testing.
  • 46.
    Human Gender Ratio •It is the ratio of males to the females in a population. • Gender Imbalance may leads to many problems that are prevailing in some parts of the world. • Consequences of Gender imbalance may include: – Rapid decline in fertility – Differential marital statistics – Increase in antisocial behavior and violence
  • 47.
    • The earliestuse of statistical hypothesis testing is to the question of whether male and female births are equally likely (null hypothesis), which was addressed in the 1700s by John Arbuthnot (1710) • John Arbuthnot, in 1710, was the first person who used hypothesis testing to question whether male and female births are equally likely or not. • Arbuthnot examined birth records in London for each of the 82 years from 1629 to 1710. • He concluded that every year, the number of males born in London exceeded the number of females. The probability of the observed outcome is 0.582.
  • 48.
    • Laplace, 1770,considered the statistics of almost half a million births. • The statistics showed an excess of boys compared to girls. • He concluded by calculation of a p-value that the excess was a real, but unexplained, effect.
  • 49.
    Courtroom Trial • Adefendant is considered not guilty as long as his/her guilt is not proven. Only when there is enough evidence for the prosecution then the defendant is convicted. • A criminal trial can be regarded as either or both of two decision processes: guilty vs not guilty or evidence vs a threshold. • A hypothesis test can be regarded as either a judgment of a hypothesis or as a judgment of evidence.
  • 50.
    Business Applications • Generallyfirms proposes a monthly income investment plan that promises a variable return each month. • The real challenge is taking precise decisions at appropriate times. • Hypothesis Testing can make a businessman’s life easier.
  • 51.
    Medical Applications • Sometimesmedics have to take risks while conducting operations or proposing a medicine which may have side reactions on a patient. • A wrong decision can consume a life. • By visualizing genetics data and reactions of medicine/surgery on various patients, doctors and surgeons can precisely take correct decisions.
  • 52.
    References • http://stattrek.com/estimation/estimation-in-statistics.aspx • http://www.cabrillo.edu/~evenable/Ch08.pdf •https://courses.lumenlearning.com/wmopen-concepts-statistics/chapter/estimating-a- population-mean-1-of-3/ • https://www.cliffsnotes.com/study-guides/statistics/principles-of-testing/point- estimates-and-confidence-intervals • https://www.cliffsnotes.com/study-guides/statistics/principles-of-testing/point- estimates-and-confidence-intervals
  • 53.

Editor's Notes

  • #10 1. For example population mean can be estimated by the sample median or sample mean. 2. But a good estimator should fulfill certain criteria. One such criterion of a good estimator is unbiasedness. 3 An estimator T of the parameter  is said to be an unbiased estimator of  if E(T)= 