Downloaded 374 times


![If the clinical history and the EEG, however, point to a
genetic epilepsy syndrome and neurologic examination
findings are normal, MRI is typically unrevealing. Genetic
epilepsy syndromes without significant imaging abnormali-
ties include rolandic epilepsy, childhood absence epilepsy,
juvenile absence epilepsy, and juvenile myoclonic epilepsy
(see Table 1 in ‘‘Epilepsy Syndromes’’) (Gaillard et al.
2009).
Febrile seizures occur with an incidence of 2–5% until the
age of 5 years. They are defined as seizures occurring in
febrile children between the ages of 6 months and 5 years
who do not have an intracranial infection, metabolic distur-
bance, or a history of febrile seizures. They occur most fre-
quently between the 18th and 24th months of age (90% below
3 years of age, 50% within the second year of life). Febrile
seizures are subdivided into two categories: simple (80–90%)
and complex (10–20%). Simple febrile seizures last for less
than 15 min, are generalized (without a focal component), and
occur once in a 24-h period, whereas complex febrile seizures
are prolonged (mote than 15 min), are focal, or occur more
than once in 24 h. Simple febrile seizures are not associated
with subsequent epilepsy or cognitive deficits, whereas
complex febrile seizures are linked with the development of
temporal lobe epilepsy and hippocampal sclerosis. Whether
temporal lobe epilepsy is the consequence of complex febrile
seizures or the child has complex febrile seizure because the
hippocampus was previously damaged by a prenatal or
perinatal insult or by genetic predisposition is a matter of
debate. The current concept is to consider the association
between complex febrile seizures and temporal lobe epilepsy
resulting from complex interactions between several genetic
and environmental factors. Simple febrile seizures are not an
indication for MRI, whereas complex febrile seizures are
(King et al. 1998; Bernal and Altman 2003). In patients with
temporal lobe epilepsy, 30% of patients with hippocampal
sclerosis as compared with 6% of patients without hippo-
campal sclerosis had complex febrile seizures in childhood
(Falconer et al. 1964).
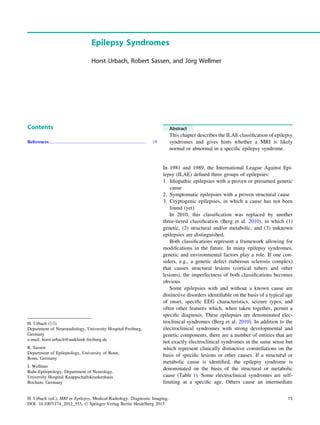
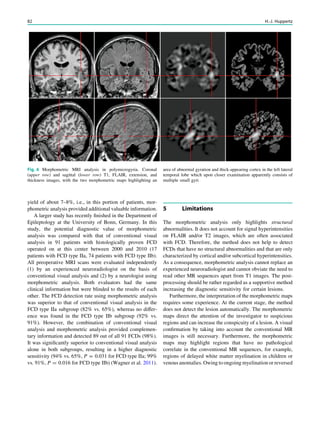
1.2 Children with Epilepsy Syndromes
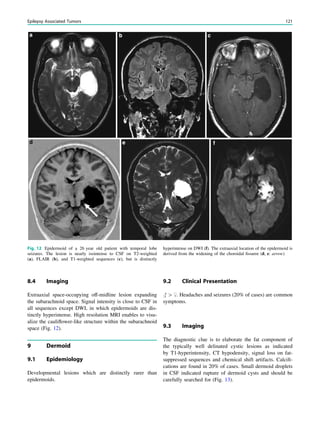
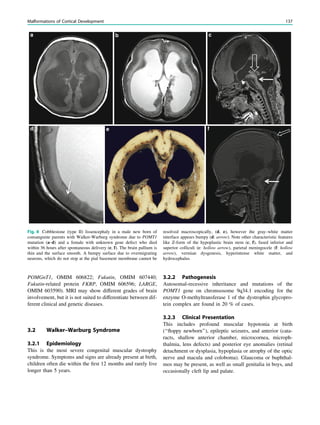
Children with epileptic encephalopathies (see Table 1 in
‘‘Epilepsy Syndromes’’) are studied with MRI to find an
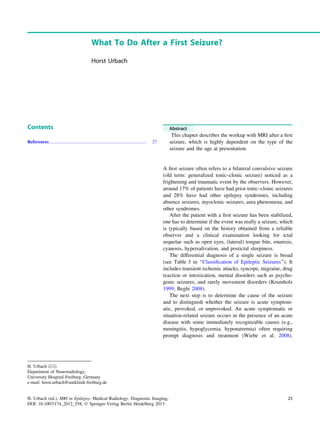
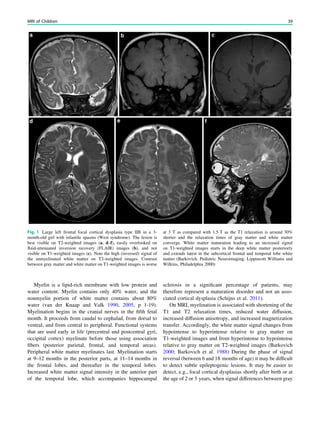
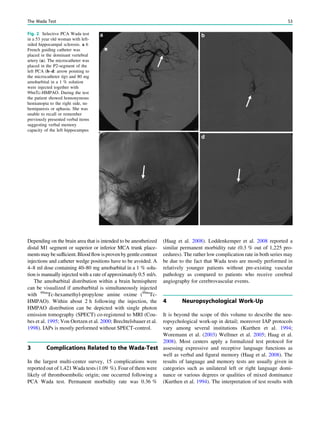
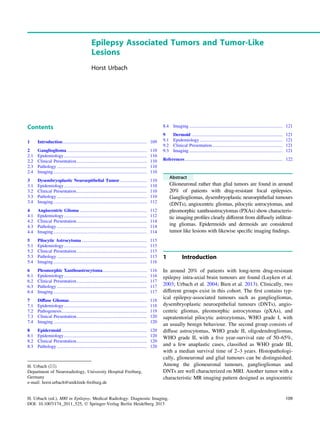
underlying structural lesion. For example, in infants with
infantile spasms (West syndrome) tuberous sclerosis is a
common finding. However, in around 40% of patients with
this encephalopathic syndrome, no lesions are found
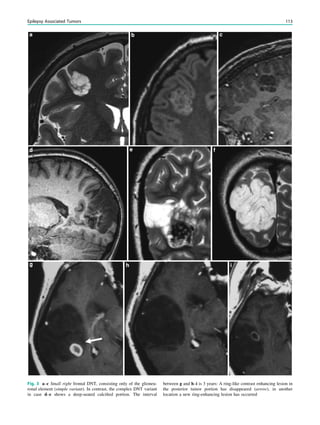
(Osborne et al. 2010). Rarely, a circumscribed lesion may
be found, enabling surgical resection and dramatically
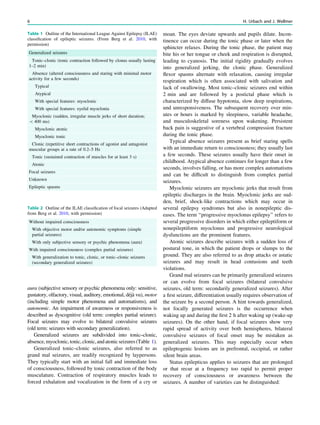
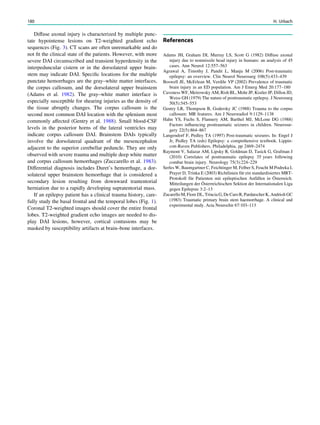
changing the child’s prognosis (Fig. 1).
In children with seizure types, age at presentation, and
EEG findings pointing to a genetic epilepsy syndrome of
(see above), MRI is typically unrevealing. Because some
nongenetic epilepsies may sometimes mimic these genetic
epilepsy syndromes, MRI is recommended in these patients
if they present with any atypical features such as abnormal
neurologic or intellectual development, difficult-to-treat
seizures, or unusual course. There is insufficient evidence to
comment on the role of not imaging in other less common
‘‘benign’’ or generalized epilepsy syndromes which may be
difficult to differentiate from symptomatic epilepsies [e.g.,
other idiopathic focal epilepsies (childhood epilepsy with
occipital paroxysms), primary reading epilepsy, and idio-
pathic generalized epilepsies (benign neonatal convulsions,
benign myoclonic epilepsies of infancy, and epilepsy with
seizures precipitated by specific modes of activation)]
(Caraballo et al. 1997a, b).
In children with focal, possibly drug-resistant epilepsy
syndromes, the effort to generate high-quality magnetic
resonance images is greatest. If these patients are uncoop-
erative and unable to tolerate sequences lasting around 5
min, general anesthesia including sedation and intubation is
needed. This effort is derived from the fact that focal cor-
tical dysplasias which may be subtle are one of the most
common causes of seizures in children with drug-resistant
epilepsy, accounting for nearly 80% of all surgically treated
cases in children under 3 years of age (Cepeda et al. 2006).
2 Preparation
Young children or those with learning difficulties are gen-
erally unable to lie still for neuroimaging. If general anes-
thesia is not available, orally administered chloral hydrate
(50–100 mg/kg body weight, maximum 2 g) may serve as
alternative (Cox et al. 2011; Schulte-Uentrop and Goepfert
2010). Finding the right chloral hydrate dose is difficult
because children may refuse, spit out, or vomit the unpal-
atable syrup. If contrast-medium injection is needed, a
‘‘needle’’ has to be placed before administering chloral
hydrate, otherwise the child will wake up, rendering con-
trast-enhanced MRI impossible. About 20% of the patients
need oxygen to keep oxygen saturation above 92%. Snoring
leads to vibration artifacts and the requirement of a special
head and neck position in the scanner.
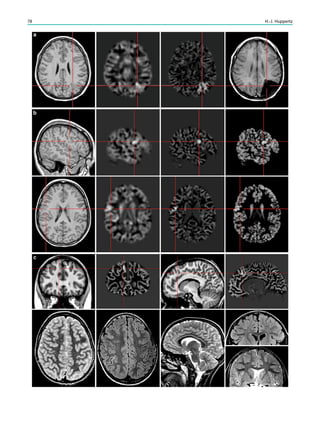
3 Imaging
Brain magnetic resonance images of children up to 3 years
of age are different from those of adults mainly due to
incomplete white matter myelination. After 3 years of age,
the signal characteristics are similar to those in adult brains,
but the heads are smaller. In children 8 years of age or older,
the head size not longer increases appreciably with age.
38 R. Sassen and H. Urbach](https://image.slidesharecdn.com/epilepsymri-140818120139-phpapp02/85/Epilepsy-mri-44-320.jpg)
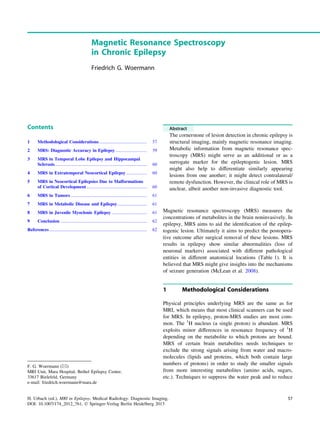
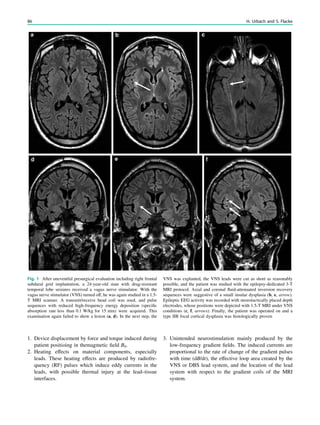
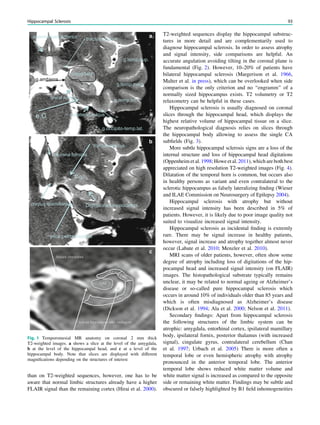
![Prototypically in epilepsy patients with tuberous sclero-
sis, the presence of multiple bilateral lesions can make it
difficult to identify a single lesion responsible for intractable
epileptic seizures. Using MRS, a lactate peak was detected
in the regions corresponding to an epileptic focus in some
patients (Yapici et al. 2005).
In contrast to the numerous 1
H-MRS of TLE, there are
only a few reports in other types of localization-related
epilepsies. These studies suggest that the potential of correct
seizure focus lateralization is less than in TLE.
6 MRS in Tumors
There is a wealth of literature on the use of MR spectroscopy
in neurooncology [for a systematic review, see Hollingworth
et al. (2006)]. Malignant tumors may be characterized by a
relatively large increase in choline, a loss of NAA, and
sometimes the detection of lactate or lipids. A ratio of Cho/
NAA larger than 2 has been associated with brain malig-
nancy, but it remains unclear whether this is more accurate
than results from MRI with contrast enhancement (or whe-
ther this is more accurate than MR perfusion). The incre-
mental benefit of MRS in the differentiation of low- from
high-grade brain tumors is unclear.
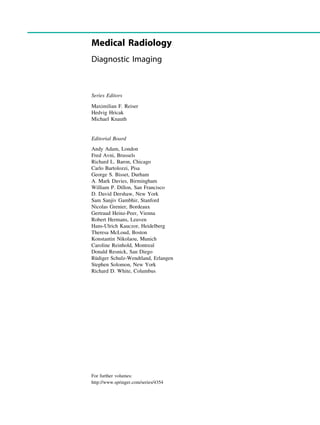
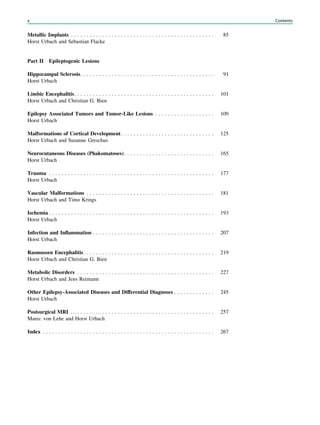
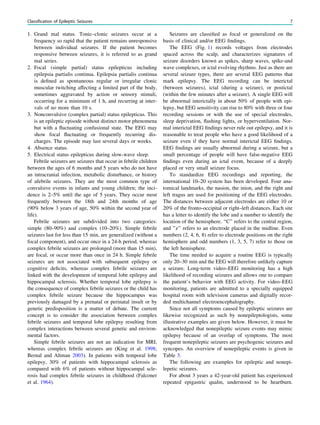
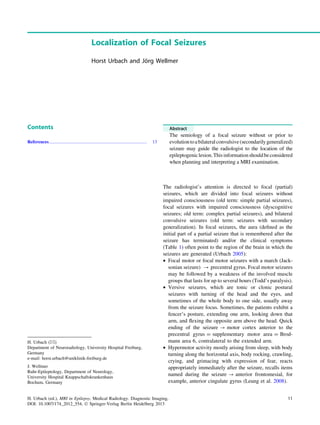
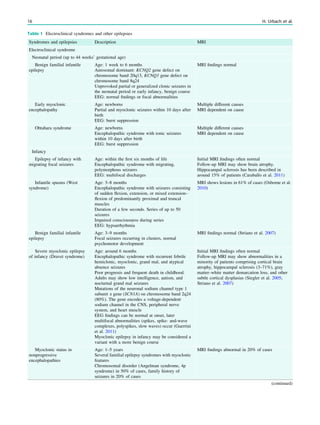
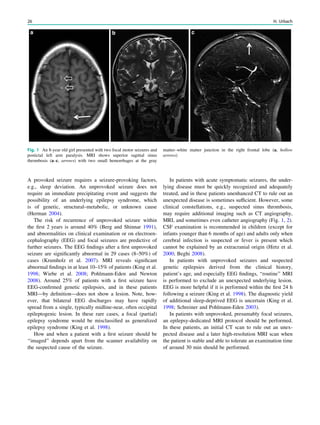
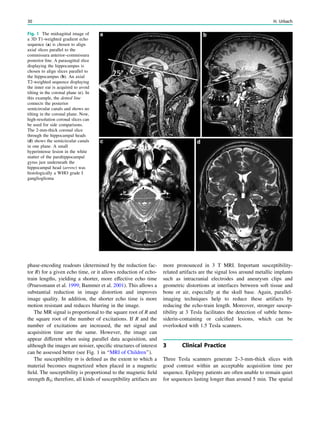
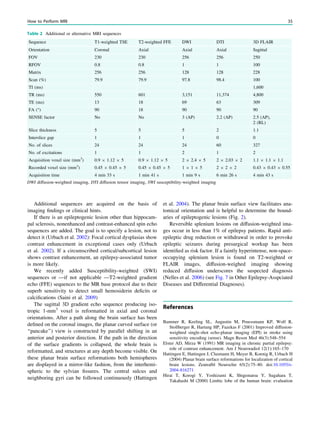
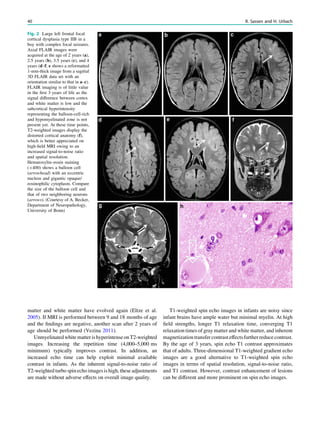
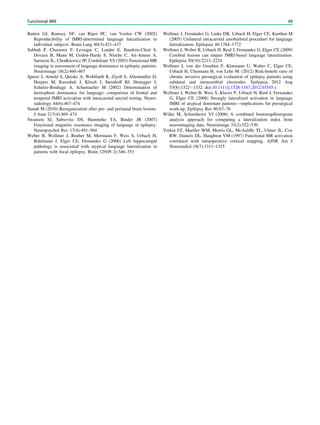
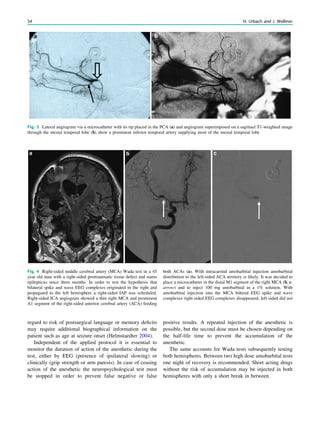
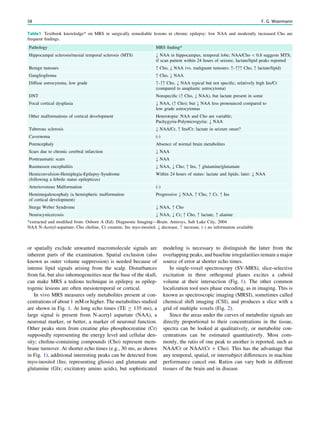
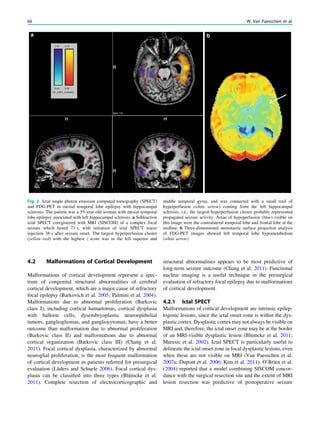
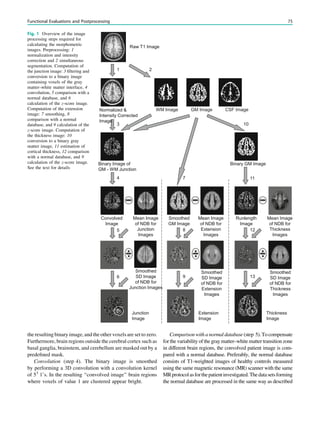
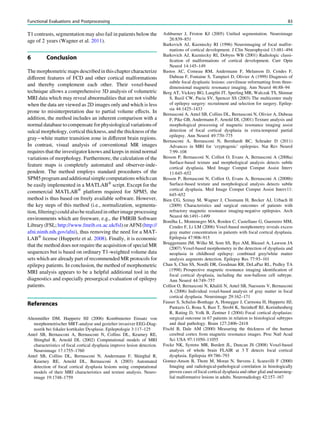
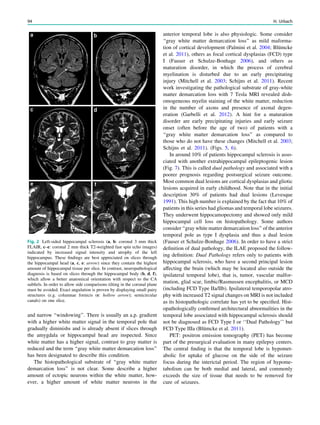
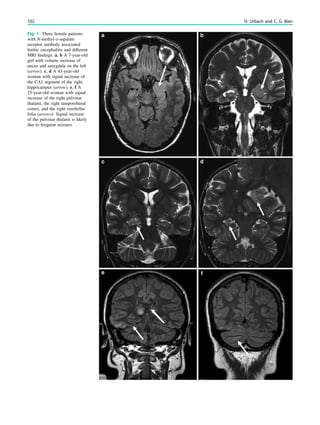
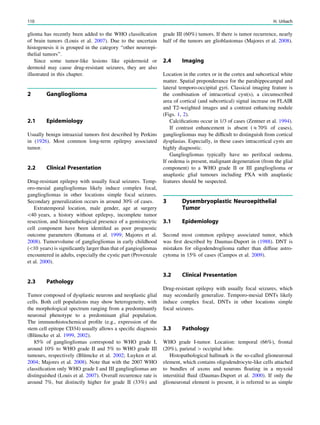
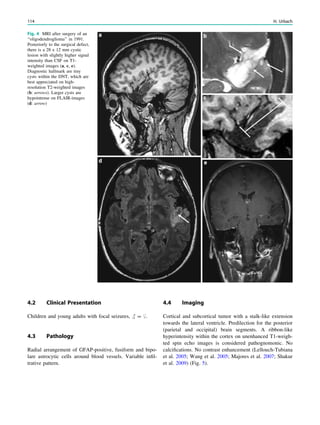
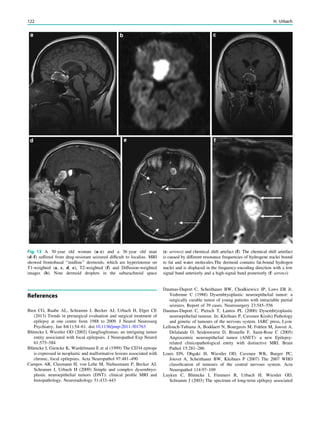
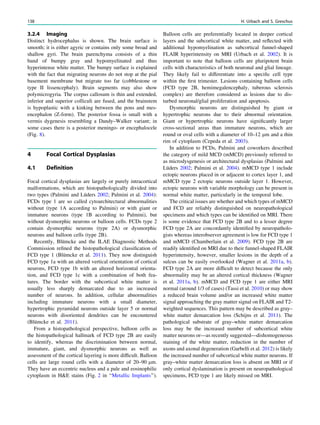
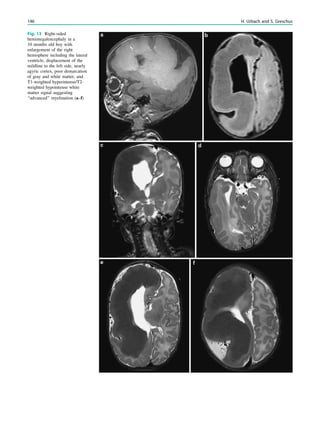
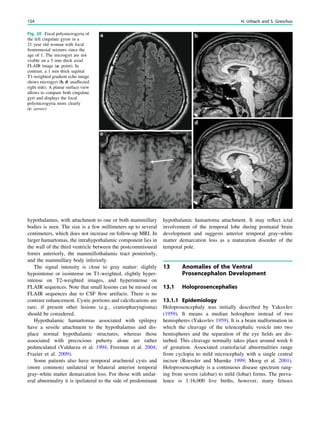
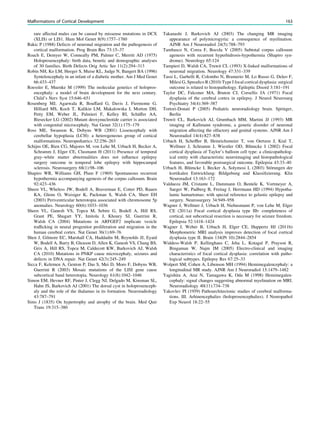
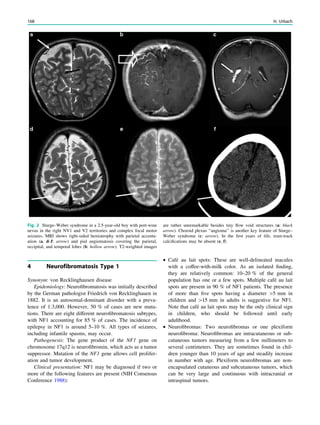
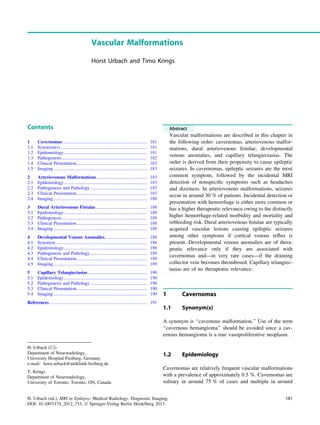
In MRS of low-grade tumors, an increase of choline
might be visible (Fig. 3).
7 MRS in Metabolic Disease and Epilepsy
In the neuronal ceroid lipofuscinoses (NCL), probably the
most common progressive metabolic encephalopathies of
childhood associated with seizures, MRS is said help to
distinguish different subtypes. Infantile NCL was charac-
terized by a complete loss of NAA, a marked reduction of
Cr and Cho, and an elevation of myo-inositol and lactate in
both gray and white matter. Reduced NAA and elevated
lactate were also detected in gray and white matter of late
infantile NCL. In contrast to the infantile forms, juvenile
NCL exhibited normal metabolic profiles (McLean et al.
2008). It is questionable whether these differences are more
important for diagnosis than the age of onset.
Lactate is usually not seen in spectra of normal adult
brain. Lactate has been detected in patients with mito-
chondrial encephalopathies, but as with all other means
used to diagnose rare disorders, MR spectroscopy does not
depict elevated lactate in all cases.
8 MRS in Juvenile Myoclonic Epilepsy
Juvenile myoclonic epilepsy is a frequent electroclinical
epilepsy syndrome. It is considered to be a generalized
epilepsy that is treated medically and not surgically. A long-
Fig. 3 MRS a with increase in
choline b in a low grade tumor in
the right temporal lobe
Magnetic Resonance Spectroscopy in Chronic Epilepsy 61](https://image.slidesharecdn.com/epilepsymri-140818120139-phpapp02/85/Epilepsy-mri-65-320.jpg)
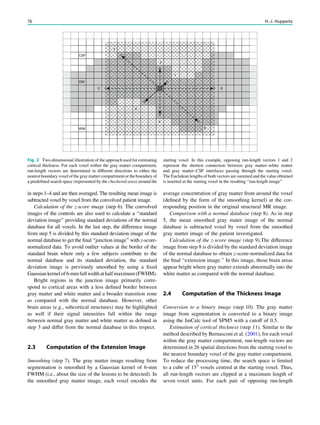
![SPECT and PET
Wim Van Paesschen, Karolien Goffin and Koen Van Laere
Contents
1 Introduction.......................................................................... 63
2 Ictal Onset Zone, Propagation Pathways,
and Functional Deficit Zone............................................... 64
2.1 Ictal SPECT........................................................................... 64
2.2 2-[18
F]Fluoro-2-deoxy-D-glucose PET.................................. 64
3 Coregistration of SPECT and PET with MRI ................ 64
4 Functional Nuclear Imaging in the Presurgical
Evaluation of Refractory Focal Epilepsy ......................... 64
4.1 Mesial Temporal Lobe Epilepsy with Hippocampal
Sclerosis ................................................................................. 64
4.2 Malformations of Cortical Development.............................. 66
4.3 Dual Pathology ...................................................................... 68
4.4 MRI-Negative Refractory Focal Epilepsy............................ 68
5 Conclusion ............................................................................ 70
References...................................................................................... 70
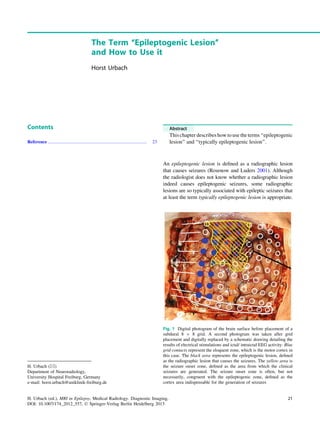
Abstract
Ictal perfusion single photon emission computed tomog-
raphy and positron emission tomography of brain
metabolism are functional nuclear imaging modalities
that are useful in the presurgical evaluation of patients
with refractory focal epilepsy, and provide information
on the ictal onset zone, seizure propagation pathways,
and functional deficit zones. Combined with electro-
physiological and coregistered MRI data, these tech-
niques allow a noninvasive presurgical evaluation in a
growing number of patients with refractory focal
epilepsy, and are particularly useful in patients with
normal MRI findings, focal dysplastic lesions, dual
pathology and discordant seizure symptoms, and elec-
trophysiology and morphological data. In addition, these
techniques may provide crucial information in the
planning of invasive electroencephalography studies.
1 Introduction
Single photon emission computed tomography (SPECT)
and positron emission tomography (PET) are functional
nuclear imaging modalities. SPECT allows the study of
cerebral perfusion during the ictal and interictal states
(Kapucu et al. 2009), and PET allows the study of cerebral
metabolic and neurochemical processes. In the epilepsy
clinic, 2-[18
F]fluoro-2-deoxy-D-glucose PET (FDG-PET) is
commonly used to assess interictal and rarely ictal cerebral
metabolism.
Functional nuclear imaging is most useful in the
presurgical evaluation of patients with refractory focal
epilepsy, and can delineate the ictal onset, seizure
propagation, and functional deficit zones (Rosenow and
Lüders 2001). ‘‘Functional’’ means that the imaging results
are critically dependent on the timing of tracer injection,
i.e., ictal, postictal, or interictal, and the seizure type
(Van Paesschen et al. 2007a; Goffin et al. 2008). For ictal
W. Van Paesschen (&)
Department of Neurology, University Hospital Leuven,
Herestraat 49, 3000 Leuven, Belgium
e-mail: wim.vanpaesschen@uzleuven.be
K. Goffin Á K. Van Laere
Division of Nuclear Medicine, University Hospital
Leuven and Katholieke Universiteit Leuven,
Leuven, Belgium
H. Urbach (ed.), MRI in Epilepsy, Medical Radiology. Diagnostic Imaging,
DOI: 10.1007/174_2012_561, Ó Springer-Verlag Berlin Heidelberg 2013
63](https://image.slidesharecdn.com/epilepsymri-140818120139-phpapp02/85/Epilepsy-mri-67-320.jpg)
![SPECT interpretation, it is, therefore, important to be aware
of the seizure types, the timing of the injection, ictal
symptoms, and electroencephalography (EEG) data. Both
FDG-PET and ictal SPECT can predict seizure-free out-
come after epilepsy surgery (Knowlton et al. 2008). Ictal
SPECT is probably the most sensitive imaging modality to
delineate the ictal onset zone in extratemporal lobe epilepsy
(Knowlton et al. 2008; Kim et al. 2009).
2 Ictal Onset Zone, Propagation
Pathways, and Functional Deficit Zone
Focal seizures start in the ictal onset zone, and can propa-
gate through the brain (Rosenow and Lüders 2001). The
functional deficit zone is the part of the cortex with an
abnormal function between seizures, due to morphological
or functional factors, or both. Understanding these concepts
is crucial for proper interpretation of functional nuclear
images.
2.1 Ictal SPECT
In the absence of seizure propagation, the largest hyper-
perfusion cluster with the highest z score represents the ictal
onset zone. This pattern is usually observed with early ictal
injections during simple or complex focal seizures, or in
brain regions where ictal propagation is slow, and allows a
reliable localization of the ictal onset zone on blinded
assessment without prior knowledge of other data from the
presurgical evaluation (Dupont et al. 2006).
Often, ictal SPECT shows propagated ictal activity,
which is due to the slow time resolution of ictal SPECT
with respect to seizure propagation. The transit time of a
perfusion tracer from an arm vein to cerebral arteries is
around 30 s. In addition, there is often a delay between
seizure onset and injection of the perfusion tracer. Further,
only around 60% of the perfusion tracer is extracted by
nerve cells on the first pass (the other 40% is extracted
later), contributing to the slow time resolution of ictal
SPECT. Propagation patterns can be seen in all focal epi-
lepsies, but most often in frontal lobe epilepsy (Dupont
et al. 2006). Ictal SPECT injections during secondary gen-
eralized seizures show more areas of propagation than
during focal seizures without generalization (Varghese et al.
2009). In the case of propagation, ictal hyperperfusion can
be observed outside the ictal onset zone. The propagated
activity may be represented by the largest hyperperfusion
cluster with the highest z score, and is usually con-
nected with the hyperperfusion cluster of the ictal onset
zone though a small trail of hyperperfusion, which we
have called an ‘‘hourglass pattern’’ (Dupont et al. 2006).
Propagation may be towards another lobe, ipsilateral, or
contralateral. A reliable blinded assessment of subtraction
ictal SPECT coregistered with MRI (SISCOM) data without
knowledge of the other data from the presurgical evaluation
is often not possible.
2.2 2-[18
F]Fluoro-2-deoxy-D-glucose PET
Hypometabolism on FDG-PET usually encompasses the
ictal onset zone, but tends to be larger. There is evidence to
suggest that both the ictal onset zone and seizure propaga-
tion pathways become hypometabolic interictally, repre-
senting the functional deficit zone (Rosenow and Lüders
2001; Van Paesschen et al. 2007a). The pattern of hypo-
metabolism reflects the seizure types prior to PET scanning
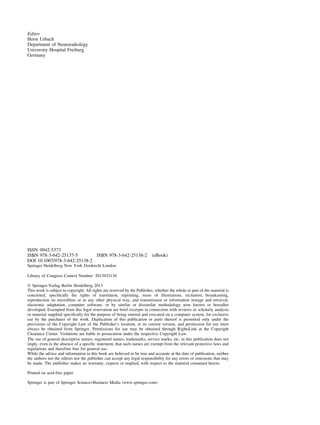
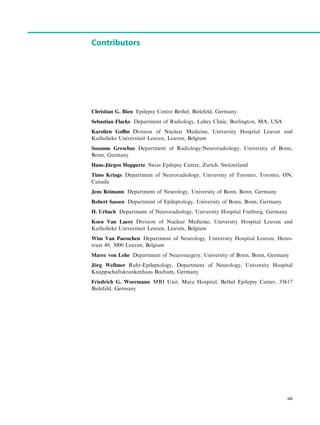
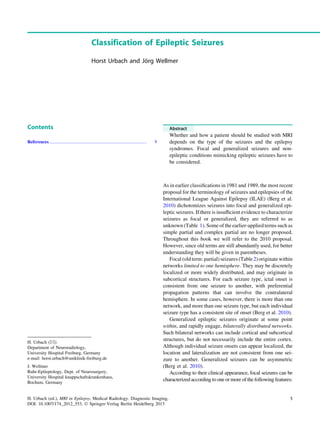
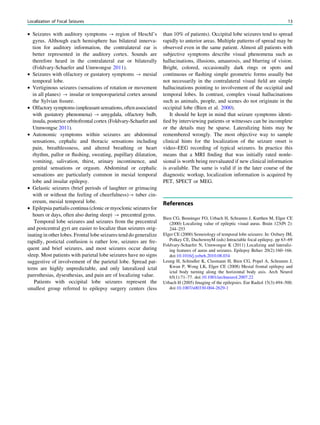
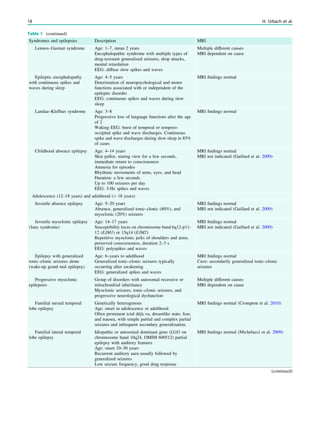
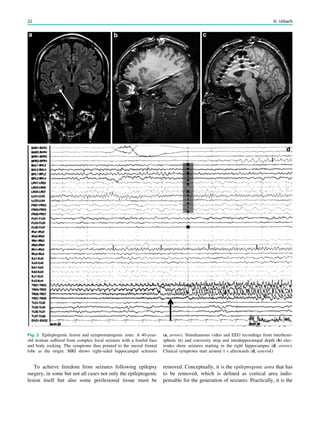
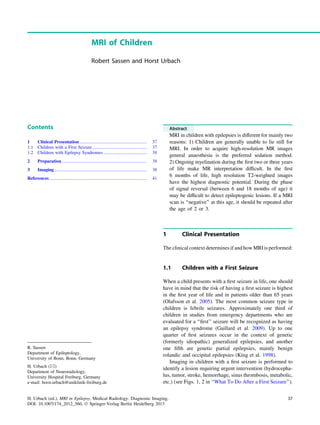
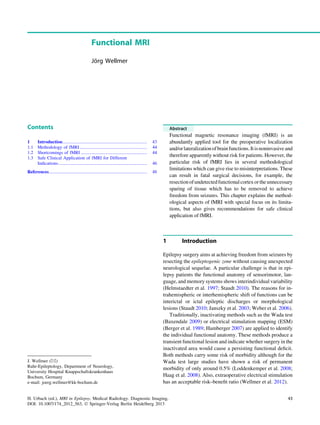
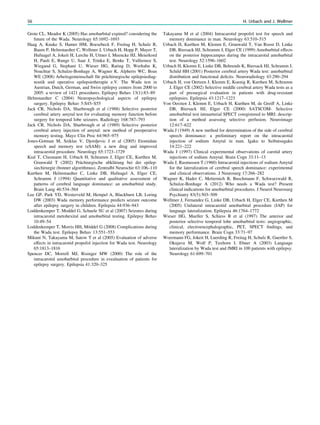
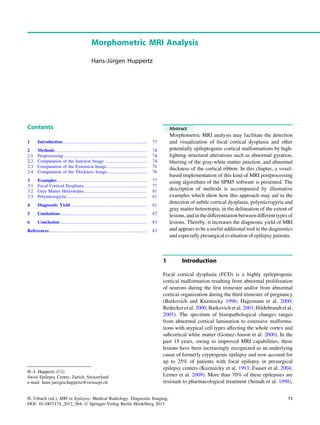
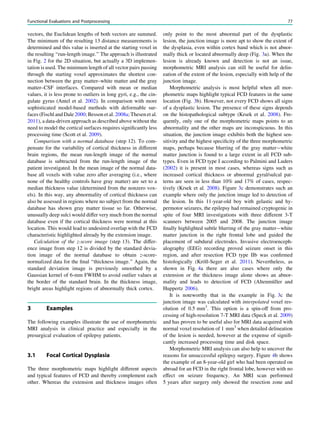
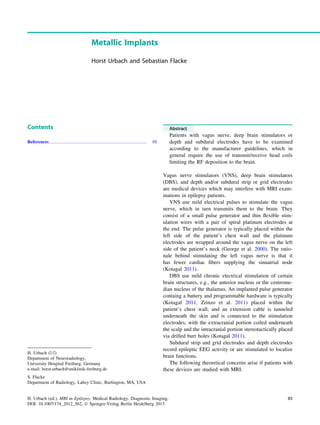
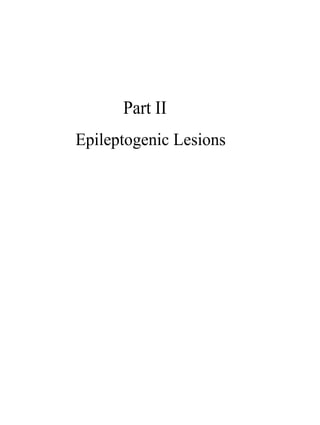
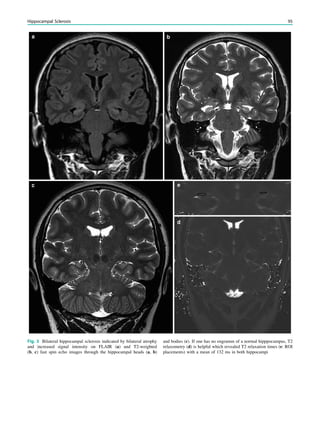
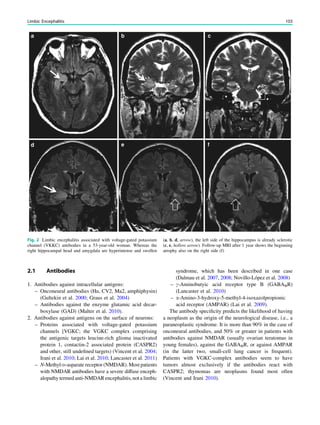
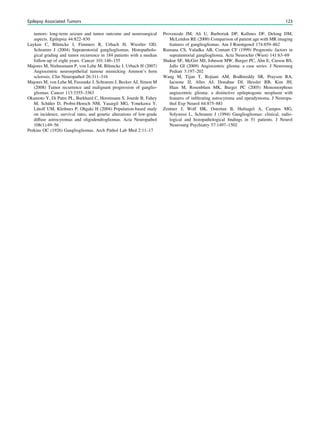
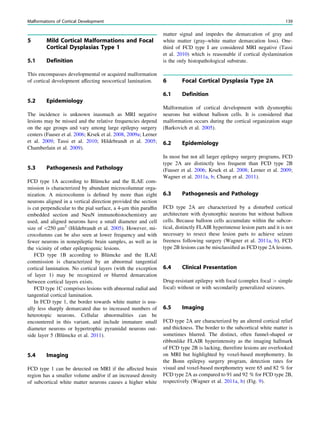
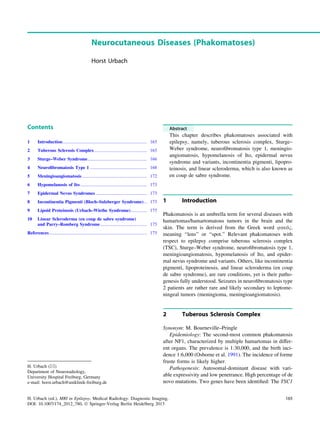
(Savic et al. 1997). The difference between the ictal onset
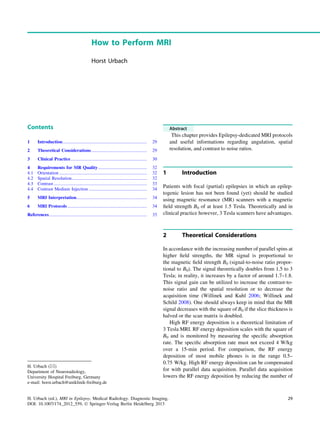
zone and the functional deficit zone is most clearly dem-
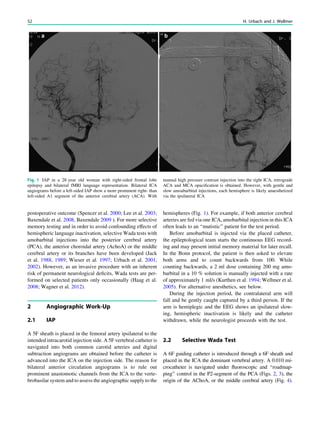
onstrated in the rare event of ictal FDG-PET scanning (Van
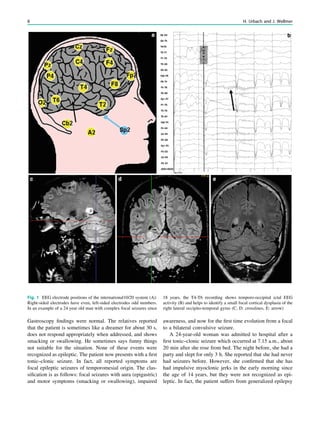
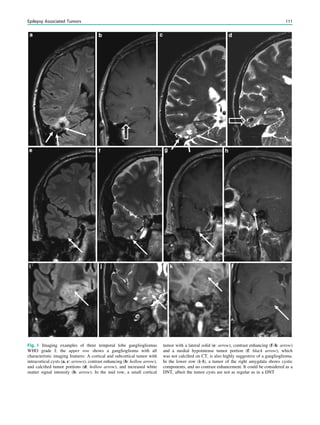
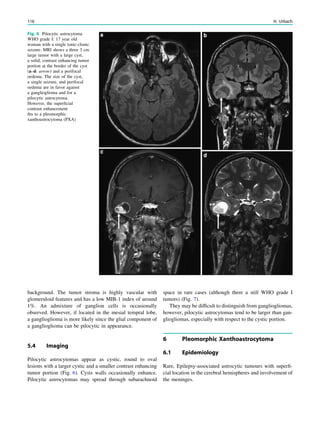
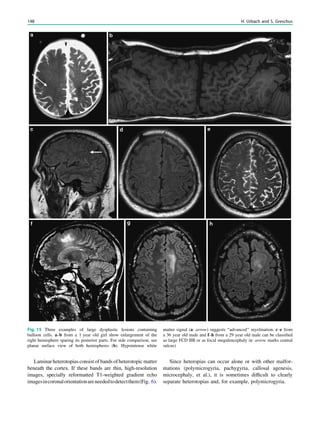
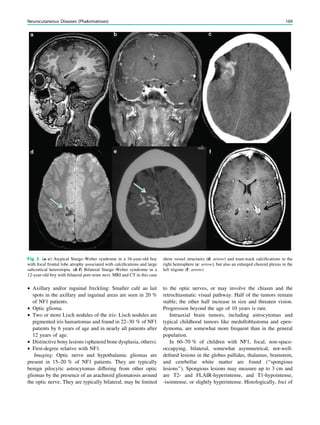
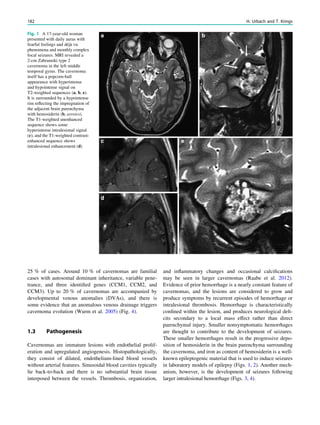
Paesschen et al. 2007b). In these cases, the ictal onset zone
is hypermetabolic and the functional deficit zone is hypo-
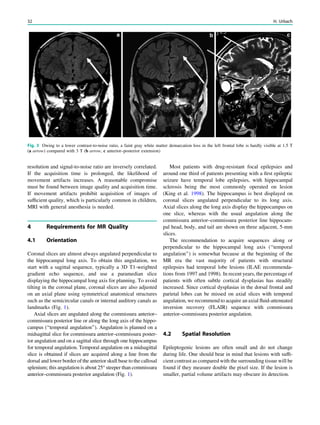
metabolic (Fig. 1).
3 Coregistration of SPECT and PET
with MRI
The most common epileptic lesions causing refractory focal
epilepsy include hippocampal sclerosis, malformations of
cortical development, tumor, vascular malformations, and
infarct/contusion (Li et al. 1995). Subtraction ictal SPECT
is routinely coregistered with MRI (SISCOM) because it
improves the clinical usefulness in localizing the ictal onset
zone and is predictive of seizure outcome (O’Brien et al.
1998, 2000). FDG-PET/MRI coregistration improves the
detection of small dysplastic lesions (Chassoux et al. 2010;
Goffin et al. 2010; Salamon et al. 2008).
4 Functional Nuclear Imaging
in the Presurgical Evaluation
of Refractory Focal Epilepsy
4.1 Mesial Temporal Lobe Epilepsy
with Hippocampal Sclerosis
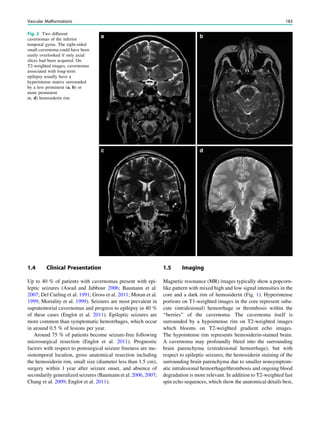
4.1.1 Ictal SPECT
Ictal SPECT during a complex focal seizure in mesial
temporal lobe epilepsy with hippocampal sclerosis usually
shows early ipsilateral neocortical temporal lobe hyperper-
fusion, frontal lobe hypoperfusion (ipsilateral more than
contralateral), contralateral cerebellar hypoperfusion, and
later parietal lobe hypoperfusion (Van Paesschen et al.
64 W. Van Paesschen et al.](https://image.slidesharecdn.com/epilepsymri-140818120139-phpapp02/85/Epilepsy-mri-68-320.jpg)
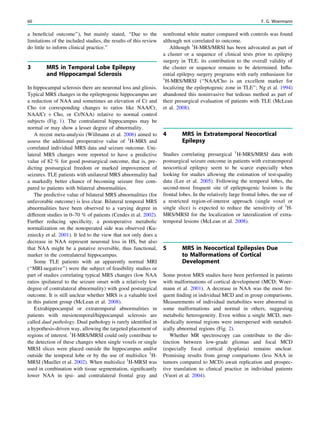
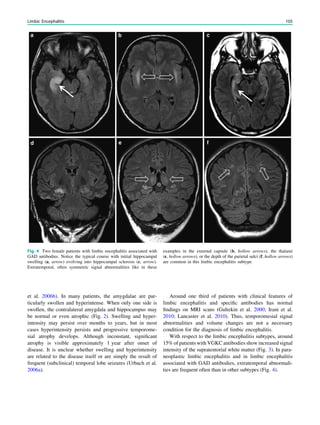
![2003; Blumenfeld et al. 2004) (Fig. 2). Ictal SPECT during
simple focal seizures in mesial temporal lobe epilepsy with
hippocampal sclerosis can show a small hyperperfusion
cluster confined to the temporal lobe, or may reveal no
hyperperfusion in around 40% of cases (Van Paesschen
et al. 2000; Van Paesschen and Ictal 2004), probably
because the hyperperfusion is below the spatial resolution
of ictal SPECT, which is around 7 mm. Seizure propagation
towards the ipsilateral basal ganglia together with hypo-
perfusion of associative brain regions correlates with con-
tralateral dystonic posturing of the arm (Kim et al. 2007;
Chassagnon et al. 2009). Seizures can propagate to the
contralateral temporal lobe, and when the ictal SPECT
injection is given after seizure propagation, SISCOM may
show hyperperfusion in the contralateral temporal lobe
(Cho et al. 2010). Early ictal SPECT injection can obviate
this problem of seizure propagation (Van Paesschen et al.
2000). Different propagation patterns in mesial temporal
lobe epilepsy with hippocampal sclerosis are not of prog-
nostic significance with respect to seizure outcome after
epilepsy surgery (Kim et al. 2007).
4.1.2 2-[18
F]Fluoro-2-deoxy-D-glucose PET
Interictal FDG-PET findings in mesial temporal lobe epi-
lepsy with hippocampal sclerosis have been well described.
Hypometabolism is present in the ipsilateral temporal lobe
in around 95% of cases, but also in regions outside the ictal
onset zone, including the contralateral temporal lobe in up
to 40% of cases, the ipsilateral thalamus in around 65% of
cases, ipsilateral basal ganglia in 45% of cases, the ipsi-
lateral insula in 50% of cases, the ipsilateral basal frontal
lobe in around 30% of cases, and the ipsilateral parietal lobe
in up to 30% of cases (Henry et al. 1990, 1993) (Fig. 2). In
mesial temporal lobe epilepsy with hippocampal sclerosis,
the extent and severity of hypometabolism is not related to
surgical outcome (Lee et al. 2002). Interictal ipsilateral
frontal lobe hypometabolism in mesial temporal lobe epi-
lepsy with hippocampal sclerosis tends to coincide with
ictal SPECT hypoperfusion, which could represent surround
inhibition (Nelissen et al. 2006). Frontal lobe hypometab-
olism in mesial temporal lobe epilepsy with hippocampal
sclerosis could explain frontal lobe cognitive deficits
(Takaya et al. 2006; Jokeit et al. 1997).
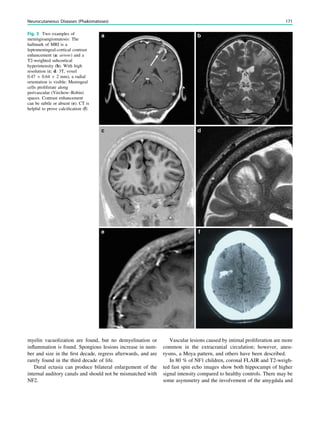
Fig. 1 2-[18
F]Fluoro-2-deoxy-D-glucose positron emission tomogra-
phy (PET) in Rasmussen encephalitis. a Three-dimensional stereotac-
tic surface projection analysis of ictal PET. The patient was a
26-year-old woman with Rasmussen encephalitis affecting the right
cerebral hemisphere, with left-sided focal motor status epilepticus.
Ictal PET was performed because electroencephalography did not
allow lateralization, and showed hypermetabolism in the right
hemisphere, consistent with status epilepticus. The left hemisphere
was severely hypometabolic. b Stereotactic surface projection analysis
of interictal PET images 1 year after a right functional hemispherot-
omy, which rendered her seizure-free. The right hemisphere became
hypometabolic. The structurally normal left hemisphere became
normometabolic, which was accompanied by important cognitive
improvements, consistent with a recovery of the functional deficit zone
SPECT and PET 65](https://image.slidesharecdn.com/epilepsymri-140818120139-phpapp02/85/Epilepsy-mri-69-320.jpg)
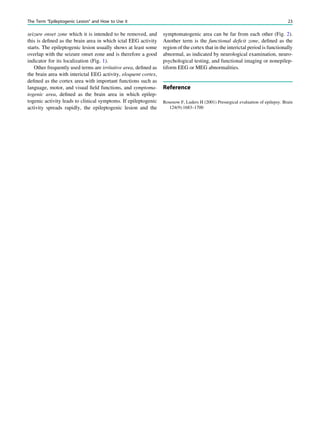
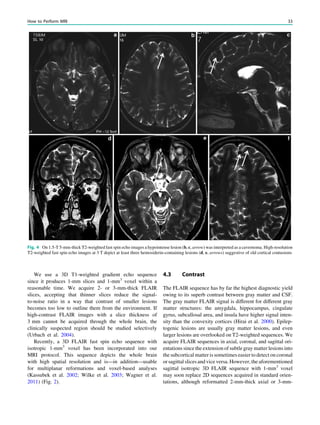
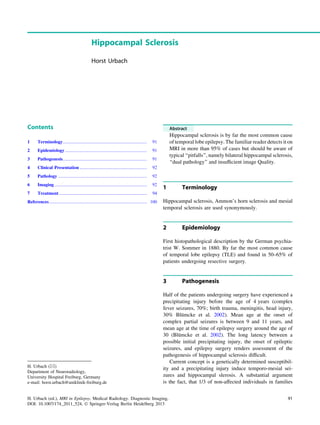
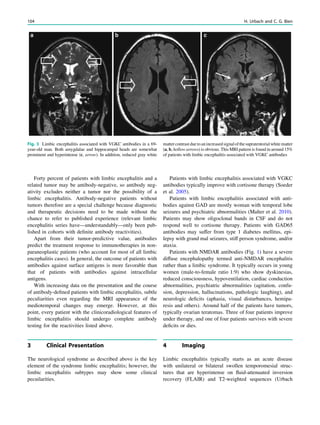
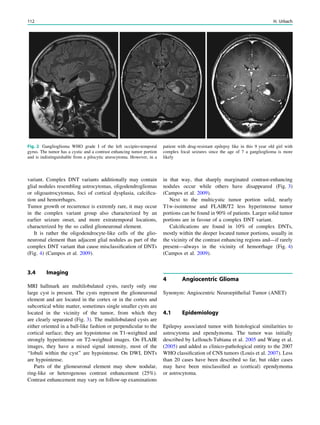
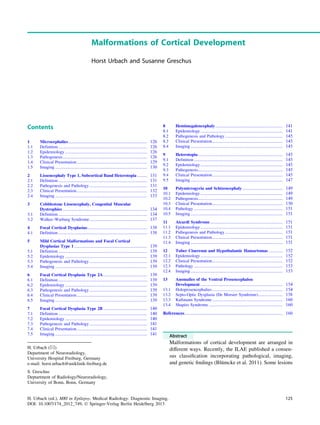
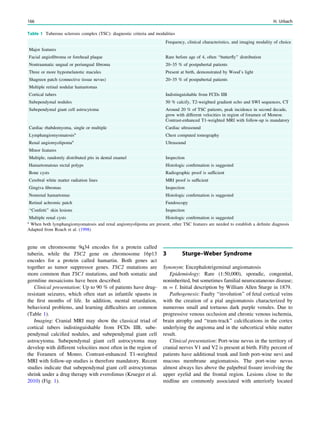
![outcome. In refractory focal epilepsy due to a single MRI-
visible focal dysplastic lesion, we found that overlap between
the SISCOM hyperperfusion cluster and the MRI-visible
focal dysplastic lesion in a noninvasive presurgical evalua-
tion with concordant data may suffice to proceed to epilepsy
surgery aimed at removing the MRI-visible focal dysplastic
lesion and the part of the hyperperfusion cluster within and
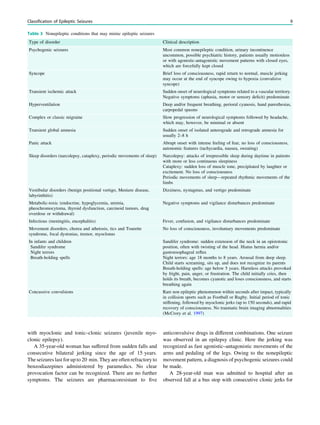
immediately surrounding the focal dysplastic lesion (Dupont
et al. 2006) (Fig. 3).
4.2.2 2-[18
F]Fluoro-2-deoxy-D-glucose PET
Focal cortical dysplasia shows a focal or regional area of
hypometabolism on FDG-PET in around 65–80% of cases
(Chassoux et al. 2010; Goffin et al. 2010; Salamon et al.
2008; Kim et al. 2011). FDG-PET/MRI coregistration and
partial volume correction improves detection of cortical
dysplasia (Chassoux et al. 2010; Goffin et al. 2010; Salamon
et al. 2008). FDG-PET is especially useful to detect the
milder Palmini type I lesions, which may not be visible on
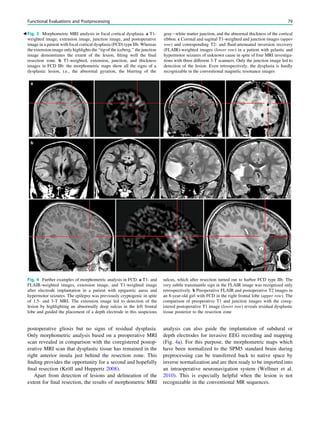
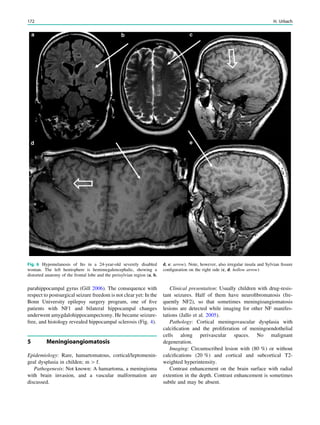
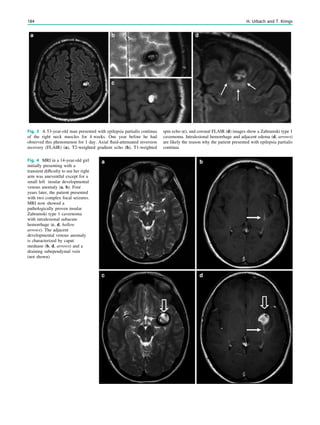
Fig. 3 Multimodality imaging
in the presurgical evaluation of
refractory focal epilepsy. The
patient was a 14-year-old boy
with refractory frontal lobe
epilepsy with focal motor
seizures in his left limbs. a Fluid-
attenuated inversion recovery
(FLAIR) showed a focal cortical
dysplasia that was visible as an
area of slightly hyperintense and
thickened cortex, located on the
medial border of the right
superior frontal gyrus (white
cross). b Multimodal imaging
including magnetization-
prepared rapid gradient echo,
subtracted ictal SPECT (red), and
motor functional MRI of the foot
(yellow), hand (green), and
corticospinal tract (blue),
coregistered with FLAIR (a). The
SISCOM hyperperfusion cluster
overlapped with the focal cortical
dysplasia, which provided an
excellent delineation of the
epileptogenic zone, i.e., the
region that the neurosurgeon has
to remove to render the patient
seizure-free. However, motor
functional MRI of the foot
confirmed that the epileptic
lesion was within eloquent
cortex. Surgery has not been
offered
SPECT and PET 67](https://image.slidesharecdn.com/epilepsymri-140818120139-phpapp02/85/Epilepsy-mri-71-320.jpg)
![MRI (Kim et al. 2009; Salamon et al. 2008) (Fig. 4). FDG-
PET hypometabolism is often present outside the location
of the focal dysplastic lesion, consistent with the observa-
tion that the functional deficit zone tends to be larger than
the epileptogenic zone (Goffin et al. 2010). It remains,
therefore, important to interpret FDG-PET in the context of
a full presurgical evaluation.
4.3 Dual Pathology
Dual pathology, i.e., two or more epileptic lesions, is detected
on MRI in around 5–20% of patients referred for presurgical
evaluation (Li et al. 1999). Often, one of the two lesions is
hippocampal sclerosis. Malformations of cortical develop-
ment and porencephalic cysts are more frequently associated
with hippocampal sclerosis than other epileptic lesions, such
as low-grade gliomas and vascular malformations (Blümcke
et al. 2011; Cendes et al. 1995). Focal cortical dysplasia
type III occurs in combination with hippocampal sclerosis,
epilepsy-associated tumors, vascular malformations, and
epileptogenic lesions acquired in early life (i.e., traumatic
injury, ischemic injury, or encephalitis) (Blümcke et al. 2011).
4.3.1 Ictal SPECT
In patients with dual pathology including hippocampal
sclerosis, removal of the two lesions may be the best sur-
gical approach (Li et al. 1999). However, patients with
mesial temporal lobe epilepsy and hippocampal sclerosis
and an extratemporal porencephalic cyst can be rendered
seizure-free after temporal lobectomy (Burneo et al. 2003).
In our experience, ictal SPECT can be highly accurate to
pinpoint hippocampal sclerosis as the ictal onset zone in
patients with dual pathology (Fig. 5). Valenti et al. (2002)
reported ictal SPECT hyperperfusion within dysembryo-
plastic neuroepithelial tumors, extending into areas of
dysplastic tissue that were not visible on MRI.
4.3.2 2-[18
F]Fluoro-2-deoxy-D-glucose PET
Diehl et al. (2003) reported FDG-PET in patients with
hippocampal sclerosis with and without associated micro-
scopic cortical dysplasia. In hippocampal sclerosis with
concurrent temporal neocortical microscopic cortical dys-
plasia, the most prominent hypometabolism was in the
temporal neocortex. In isolated hippocampal sclerosis
without cortical dysplasia, the most pronounced hypome-
tabolism was in the mesial temporal lobe. Patients with
tuberous sclerosis complex tend to have multiple tubers.
Removal of the epileptic tubers may render these patients
seizure-free. FDG-PET is useful in the non-invasive pre-
surgical evaluation of these patients. Some of the tubers in
the epileptogenic zone may display the largest volume of
hypometabolism relative to the actual tuber volume
(Salamon et al. 2008; Wu et al. 2010).
4.4 MRI-Negative Refractory
Focal Epilepsy
Around 25% of patients with refractory focal epilepsy have
no epileptic lesion on MRI (Li et al. 1995; Duncan 2010).
As a group, around 40% of patients with MRI-negative
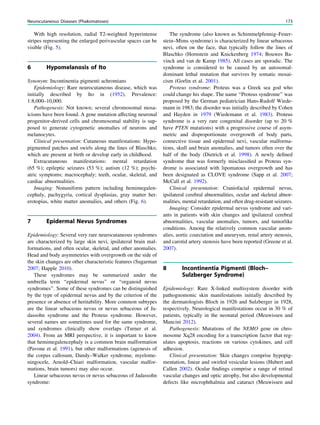
Fig. 4 MRI-negative, SPECT/
PET-positive temporal lobe
epilepsy. The patient was a
27-year-old man with a 5-year
history of refractory MRI-
negative temporal lobe epilepsy.
SISCOM showed a left
anterotemporal hyperperfusion
cluster. FDG-PET showed left
temporal hypometabolism. He
underwent a left anterotemporal
lobectomy, including the
amygdala and with sparing of the
hippocampus. He has remained
seizure-free for more than 1 year.
Pathology demonstrated focal
cortical dysplasia type I
68 W. Van Paesschen et al.](https://image.slidesharecdn.com/epilepsymri-140818120139-phpapp02/85/Epilepsy-mri-72-320.jpg)
![focal epilepsy are rendered seizure-free after epilepsy sur-
gery, and have a worse prognosis compared with patients
with refractory focal epilepsy and an epileptic lesion on
MRI (Lee et al. 2005).
4.4.1 Ictal SPECT
In MRI-negative refractory focal epilepsy, reevaluation of the
MRI, guided by the ictal SPECT, reveals small focal dys-
plastic lesions in around 15% of cases (Van Paesschen et al.
2007a; Van Paesschen and Ictal 2004) (Fig. 6). SISCOM can
be used to guide placement of intracranial electrodes
(Ahnlide et al. 2007). SISCOM may alter and extend the
strategy for electrode placement in invasive recording.
Favorable surgical outcome has been observed when intra-
cranial EEG was concordant with SISCOM hyperperfusion.
SISCOM localization, therefore, is an independent method
with an impact in patients with refractory partial epilepsy
scheduled for intracranial EEG studies. In comparison with
MRI, FDG-PET, magnetoencephalography, and scalp EEG,
ictal SPECT is probably the most sensitive technique to
localize the ictal onset zone in extratemporal lobe epilepsy,
and to predict a seizure-free outcome after epilepsy surgery
(Knowlton et al. 2008; Kim et al. 2009).
4.4.2 2-[18
F]Fluoro-2-deoxy-D-glucose PET
FDG-PET may be useful in MRI-negative temporal lobe
epilepsy. Good surgical results have been reported in
patients with MRI-negative refractory temporal lobe epi-
lepsy and unilateral temporal hypometabolism (Fig. 4).
MRI-negative, PET-positive temporal lobe epilepsy may
represent a surgically remediable syndrome distinct from
mesial temporal lobe epilepsy, with focal hypometabolism
involving primarily lateral neocortical rather than mesial
temporal structures (Lee et al. 2005; Carne et al. 2004).
FDG-PET is most useful in patients with temporal lobe
epilepsy when MRI findings are normal or when MRI does
not show unilateral temporal lobe abnormalities, and when
ictal EEG results are not concordant with MRI findings or
seizure symptoms (Uijl et al. 2007).
5 Conclusion
Ictal SPECT and FDG-PET are functional nuclear imaging
modalities which may provide additional information in the
noninvasive presurgical evaluation of patients with refrac-
tory focal epilepsy when MRI shows a malformation of
cortical development (Dupont et al. 2006), dual pathology,
or MRI-negative cases, or when the data from the presur-
gical evaluation are discordant. Both may facilitate the
detection of a subtle focal dysplastic lesion when the MRI
findings were initially reported as normal, and may allow
epilepsy surgery after a noninvasive presurgical evaluation.
Ictal SPECT may guide placement of electrodes and grids
for invasive EEG studies. Ictal SPECT and FDG-PET can
be integrated in a multimodal image, including MRI, trac-
tography, EEG–functional MRI and magnetoencephalog-
raphy, allowing accurate surgical planning. Both FDG-PET
and ictal SPECT can predict seizure-free outcome after
epilepsy surgery (Knowlton et al. 2008).
References
Ahnlide JA, Rosen I, Linden-Mickelsson TP, Kallen K (2007) Does
SISCOM contribute to favorable seizure outcome after epilepsy
surgery? Epilepsia 48:579–588
Barkovich AJ, Kuzniecky RI, Jackson GD, Guerrini R, Dobyns WB
(2005) A developmental and genetic classification for malforma-
tions of cortical development. Neurology 27(65):1873–1887
Blümcke I, Thom M, Aronica E et al (2011) The clinicopathologic
spectrum of focal cortical dysplasias: a consensus classification
proposed by an ad hoc task force of the ILAE Diagnostic Methods
Commission. Epilepsia 52:158–174
Blumenfeld H, McNally KA, Vanderhill SD et al (2004) Positive and
negative network correlations in temporal lobe epilepsy. Cereb
Cortex 14:892–902
Burneo JG, Faught E, Knowlton RC et al (2003) Temporal lobectomy
in congenital porencephaly associated with hippocampal sclerosis.
Arch Neurol 60:830–834
Carne RP, O’Brien TJ, Kilpatrick CJ et al (2004) MRI-negative PET-
positive temporal lobe epilepsy: a distinct surgically remediable
syndrome. Brain 127:2276–2285
Cendes F, Cook MJ, Watson C et al (1995) Frequency and
characteristics of dual pathology in patients with lesional epilepsy.
Neurology 45:2058–2064
Chang EF, Wang DD, Barkovich AJ et al (2011) Predictors of seizure
freedom after surgery for malformations of cortical development.
Ann Neurol 70:151–162
Chassagnon S, Namer IJ, Armspach JP et al (2009) SPM analysis of
ictal-interictal SPECT in mesial temporal lobe epilepsy: relation-
ships between ictal semiology and perfusion changes. Epilepsy Res
85:252–260
Chassoux F, Rodrigo S, Semah F et al (2010) FDG-PET improves
surgical outcome in negative MRI Taylor-type focal cortical
dysplasias. Neurology 14(75):2168–2175
Cho JW, Hong SB, Lee JH et al (2010) Contralateral hyperperfusion
and ipsilateral hypoperfusion by ictal SPECT in patients with
mesial temporal lobe epilepsy. Epilepsy Res 88:247–254
Diehl B, LaPresto E, Najm I et al (2003) Neocortical temporal FDG-
PET hypometabolism correlates with temporal lobe atrophy in
hippocampal sclerosis associated with microscopic cortical dys-
plasia. Epilepsia 44:559–564
Duncan JS (2010) Imaging in the surgical treatment of epilepsy. Nat
Rev Neurol 6:537–550
Dupont P, Van Paesschen W, Palmini A et al (2006) Ictal perfusion
patterns associated with single MRI-visible focal dysplastic
lesions: implications for the noninvasive delineation of the
epileptogenic zone. Epilepsia 47:1550–1557
Goffin K, Dedeurwaerdere S, Van Laere KJ, Van Paesschen W (2008)
Neuronuclear assessment of patients with epilepsy. Semin Nucl
Med 38:227–239
Goffin K, Van Paesschen W, Dupont P et al (2010) Anatomy-based
reconstruction of FDG-PET images with implicit partial volume
correction improves detection of hypometabolic regions in patients
70 W. Van Paesschen et al.](https://image.slidesharecdn.com/epilepsymri-140818120139-phpapp02/85/Epilepsy-mri-74-320.jpg)
![with epilepsy due to focal cortical dysplasia diagnosed on MRI.
Eur J Nucl Med Mol Imaging 37:1148–1155
Henry TR, Mazziotta JC, Engel J Jr et al (1990) Quantifying interictal
metabolic activity in human temporal lobe epilepsy. J Cereb Blood
Flow Metab 10:748–757
Henry TR, Mazziotta JC, Engel J Jr (1993) Interictal metabolic anatomy
of mesial temporal lobe epilepsy. Arch Neurol 50:582–589
Jokeit H, Seitz RJ, Markowitsch HJ, Neumann N, Witte OW, Ebner A
(1997) Prefrontal asymmetric interictal glucose hypometabolism
and cognitive impairment in patients with temporal lobe epilepsy.
Brain 120(Pt 12):2283–2294
Kapucu OL, Nobili F, Varrone A et al (2009) EANM procedure guideline
for brain perfusion SPECT using 99mTc-labelled radiopharmaceuti-
cals, version 2. Eur J Nucl Med Mol Imaging 36:2093–2102
Kim JH, Im KC, Kim JS et al (2007) Ictal hyperperfusion patterns in
relation to ictal scalp EEG patterns in patients with unilateral
hippocampal sclerosis: a SPECT study. Epilepsia 48:270–277
Kim JT, Bai SJ, Choi KO et al (2009) Comparison of various imaging
modalities in localization of epileptogenic lesion using epilepsy
surgery outcome in pediatric patients. Seizure 18:504–510
Kim YH, Kang HC, Kim DS et al (2011) Neuroimaging in identifying
focal cortical dysplasia and prognostic factors in pediatric and
adolescent epilepsy surgery. Epilepsia 52:722–727
Knowlton RC, Elgavish RA, Bartolucci A et al (2008) Functional imaging:
II. Prediction of epilepsy surgery outcome. Ann Neurol 64:35–41
Lee SK, Lee DS, Yeo JS et al (2002) FDG-PET images quantified by
probabilistic atlas of brain and surgical prognosis of temporal lobe
epilepsy. Epilepsia 43:1032–1038
Lee SK, Lee SY, Kim KK, Hong KS, Lee DS, Chung CK (2005)
Surgical outcome and prognostic factors of cryptogenic neocortical
epilepsy. Ann Neurol 58:525–532
Li LM, Fish DR, Sisodiya SM, Shorvon SD, Alsanjari N, Stevens JM
(1995) High resolution magnetic resonance imaging in adults with
partial or secondary generalised epilepsy attending a tertiary
referral unit. J Neurol Neurosurg Psychiatry 59:384–387
Li LM, Cendes F, Andermann F et al (1999) Surgical outcome in patients
with epilepsy and dual pathology. Brain 122(Pt 5):799–805
Lüders H, Schuele SU (2006) Epilepsy surgery in patients with
malformationsofcorticaldevelopment.CurrOpinNeurol19:169–174
Marusic P, Najm IM, Ying Z et al (2002) Focal cortical dysplasias in
eloquent cortex: functional characteristics and correlation with
MRI and histopathologic changes. Epilepsia 43:27–32
Nelissen N, Van Paesschen W, Baete K et al (2006) Correlations of
interictal FDG-PET metabolism and ictal SPECT perfusion
changes in human temporal lobe epilepsy with hippocampal
sclerosis. Neuroimage 15(32):684–695
O’Brien TJ, So EL, Mullan BP et al (1998) Subtraction ictal SPECT
co-registered to MRI improves clinical usefulness of SPECT in
localizing the surgical seizure focus. Neurology 50:445–454
O’Brien TJ, So EL, Mullan BP et al (2000) Subtraction peri-ictal
SPECT is predictive of extratemporal epilepsy surgery outcome.
Neurology 12(55):1668–1677
O’Brien TJ, So EL, Cascino GD et al (2004) Subtraction SPECT
coregistered to MRI in focal malformations of cortical develop-
ment: localization of the epileptogenic zone in epilepsy surgery
candidates. Epilepsia 45:367–376
Palmini A, Najm I, Avanzini G et al (2004) Terminology and
classification of the cortical dysplasias. Neurology 23(62):S2–S8
Rosenow F, Lüders H (2001) Presurgical evaluation of epilepsy. Brain
124:1683–1700
Salamon N, Kung J, Shaw SJ et al (2008) FDG-PET/MRI coregistra-
tion improves detection of cortical dysplasia in patients with
epilepsy. Neurology 11(71):1594–1601
Savic I, Altshuler L, Baxter L, Engel J Jr (1997) Pattern of interictal
hypometabolism in PET scans with fludeoxyglucose F 18 reflects
prior seizure types in patients with mesial temporal lobe seizures.
Arch Neurol 54:129–136
Takaya S, Hanakawa T, Hashikawa K et al (2006) Prefrontal
hypofunction in patients with intractable mesial temporal lobe
epilepsy. Neurology 14(67):1674–1676
Uijl SG, Leijten FS, Arends JB, Parra J, van Huffelen AC, Moons KG
(2007) The added value of [18F]-fluoro-D-deoxyglucose positron
emission tomography in screening for temporal lobe epilepsy
surgery. Epilepsia 48:2121–2129
Valenti MP, Froelich S, Armspach JP et al (2002) Contribution of
SISCOM imaging in the presurgical evaluation of temporal lobe
epilepsy related to dysembryoplastic neuroepithelial tumors. Epi-
lepsia 43:270–276
Van Paesschen W (2004) Ictal SPECT. Epilepsia 45(Suppl 4):
35–40
Van Paesschen W, Dupont P, Van Heerden B et al (2000) Self-
injection ictal SPECT during partial seizures. Neurology 23(54):
1994–1997
Van Paesschen W, Dupont P, Van Driel G, Van Billoen H, Maes A
(2003) SPECT perfusion changes during complex partial seizures
in patients with hippocampal sclerosis. Brain 126:1103–1111
Van Paesschen W, Dupont P, Sunaert S, Goffin K, Van Laere KJ
(2007a) The use of SPECT and PET in routine clinical practice in
epilepsy. Curr Opin Neurol 20:194–202
Van Paesschen W, Porke K, Fannes K et al (2007b) Cognitive deficits
during status epilepticus and time course of recovery: a case report.
Epilepsia 48:1979–1983
Varghese GI, Purcaro MJ, Motelow JE et al (2009) Clinical use of ictal
SPECT in secondarily generalized tonic-clonic seizures. Brain
132:2102–2113
Wu JY, Salamon N, Kirsch HE et al (2010) Noninvasive testing, early
surgery, and seizure freedom in tuberous sclerosis complex.
Neurology 2(74):392–398
SPECT and PET 71](https://image.slidesharecdn.com/epilepsymri-140818120139-phpapp02/85/Epilepsy-mri-75-320.jpg)
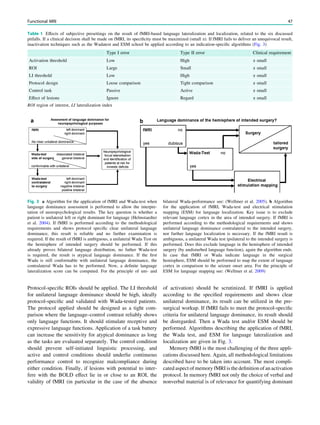
![4. Electromagnetic compatibility.
5. Acoustic noise.
6. Interaction among devices
7. Safe functioning of the device.
8. Safe operation of the MRI system.
The greatest concern is thermal injury from RF pulses.
Heating may occur around the VNS or DBS or along the
subdural or depth electrodes, but is more likely to occur at
the noninsulated ends of the electrodes. Experimental
investigations of cardiac pacemakers showed a higher
temperature increase in patients with abandoned leads than
in patients with leads attached to the pacemaker (Langman
et al. 2011). Thus, patients with abandoned or broken leads
around the vagus nerve after explanting a VNS could show
a higher temperature increase than patients with an
implanted VNS. Heating is considered harmful as it could
result in tissue damage in the brain parenchyma or the vagus
nerve and/or surrounding structures in the carotid sheath.
A measure to assess the amount of energy deposited by a
radiofrequency field in a certain mass of tissue is the spe-
cific absorption rate. The units for SAR are therefore given
in watts per kilogram [W/kg]. The SAR produced during an
MRI study is a complex function of various variables. SAR
is proportional to the square of the field strength, the square
of the RF flip angle, the duty cycle which is influenced by
the repetition time, the type of transmit coil and the volume,
electrical conductivity and anatomical configuration of the
tissue contained within the transmit coil. This relationship
already implies that stronger magnets and larger RF flip-
angles applied in a short time interval will result in higher
energy deposition (Shellock 2008). Unfortunately, the SAR
is calculated differently by different MRI system manufac-
turers and even varies for different systems with identical
field strength produced by the same manufacturer. For
example, the SAR is higher in a long-bore system than in a
short-bore system. The SAR can be averaged over the
whole body or the head only, and the averaged whole-body
SAR should not exceed 4 W/kg in any MRI examination.
For a given MRI system, a higher SAR leads to greater
heating.
Other concerns with respect to VNS or DBS are inad-
vertent device reset erasing historical information stored in
the device or inadvertent magnet mode activation from the
magnetic fields.
In 2005, ASTM International introduced the criteria
MRI-safe, MRI-conditional and MRI-unsafe (ASTM Inter-
national 2005). With respect to these criteria, the devices
mentioned above are defined as MRI-conditional, i.e., MRI
is considered safe under specified conditions of use. Inter-
estingly, neither the FDA nor the International Electro-
technical Commission has specified these conditions for the
different metallic implants, but instead has left this task to
the manufacturers (Gupte et al. 2011). The manufacturers
provide this information within their manuals and MRI
healthcare professionals are advised to contact the respec-
tive manufacturer to obtain the latest safety information.
Provisional information and guidance to the respective
manufacturer’s websites can be obtained via the website
http://www.mrisaftey.com.
In general, MRI examinations with implanted VNS or
DBS or subdural grid or strip electrodes or depth electrodes
should be performed as follows: magnetic field strength
of 1.5 T or less; head SAR of less than 0.1 W/kg; dB/
dt 20 T/s; output current of the implanted pulse generator
set to 0 mA; testing and reprogramming of the devices after
scanning (Benbadis et al. 2001; Roebling et al. 2009;
Shellock et al. 2006; Shellock 2002; Kainz 2007; Gupte
et al. 2011).
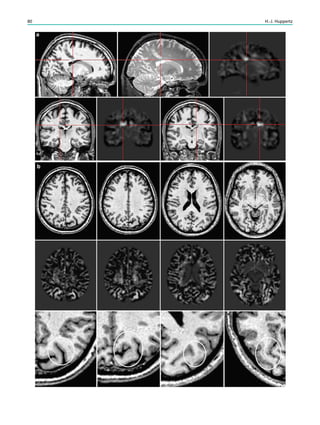
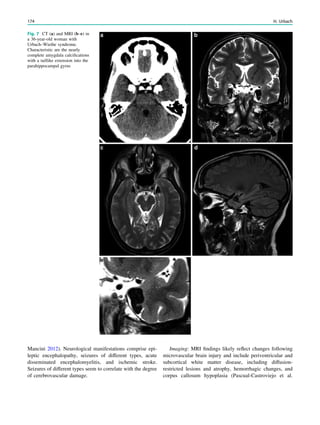
Fig. 2 Reduced susceptibility artifacts of depth electrodes at 1.5 T (b, c) compared with 3 T (a)
Metallic Implants 87](https://image.slidesharecdn.com/epilepsymri-140818120139-phpapp02/85/Epilepsy-mri-90-320.jpg)
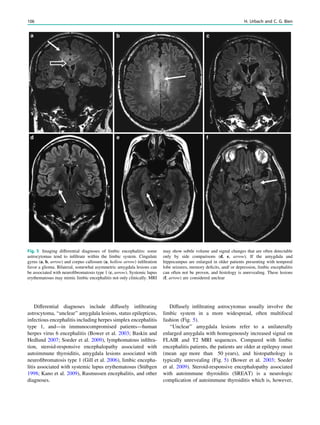
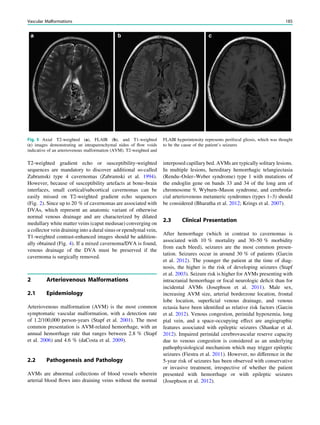
![with familial TLE show hippocampal sclerosis on MRI
(Kobayashi et al. 2002).
If patients develop temporal lobe seizures or subacute
memory deficits after the age of 20, one has to think of
limbic encephalitis, which is mediated via antibodies and
found in up to 30% of patients in this age group (Soeder
et al. 2009).
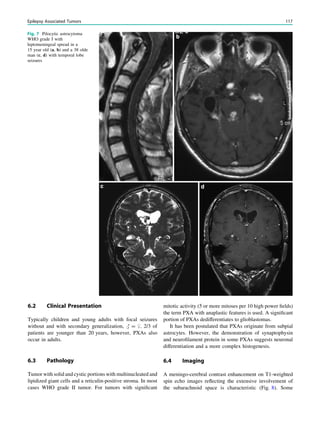
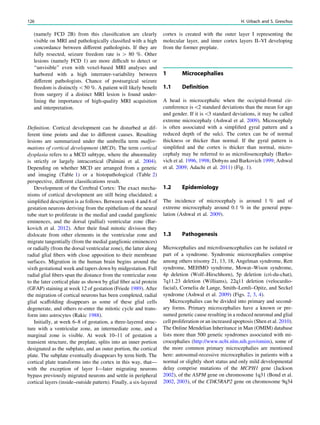
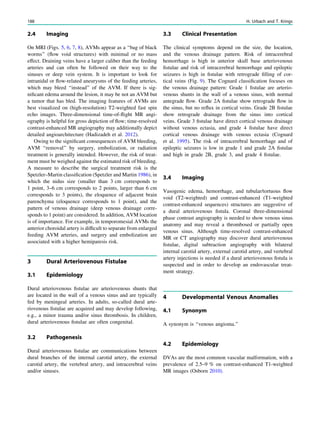
4 Clinical Presentation
A typical mesial temporal lobe seizure starts with an epi-
gastric aura (definition of aura = initial part of a partial
seizure, that is remembered after the seizure has termi-
nated). The aura is followed by objective phenomena
like staring, restlessness, oroalimentary automatism, and
(ipsilateral) head deviation, which last from around 30
seconds to several minutes. In the postictal phase, gradual
reorientation occurs which may be accompanied by dys-
phasia and other sympoms.
5 Pathology
Hippocampal sclerosis is characterized by neuronal loss and
gliosis, most prominent in the CA1 field of the hippocam-
pus, followed by the hilus, CA3 field, and dentate granule
layer, while the CA2 field is relatively spared. These
alterations are accompanied by a dispersion of the dentate
granuale layer with ectopic neurons being found in the
molecular layer.
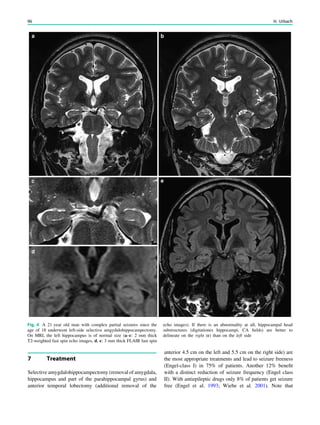
Extent of hippocampal sclerosis is graded according to
Wyler et al. (Table 1) or more recently according to Blümcke
et al. (Table 2) (Wyler et al. 1992; Blümcke et al. 2007). Note
that more than 90% of patients, who undergo selective am-
ygdalohippocampectomy with MRI suspected hippocampal
sclerosis have Wyler grade III and IV hippocampal sclerosis.
Both are easily recognized on perfectly angulated high res-
olution T2- and FLAIR images due to their atrophy and
increased signal intensity. In contrast, only a minority of
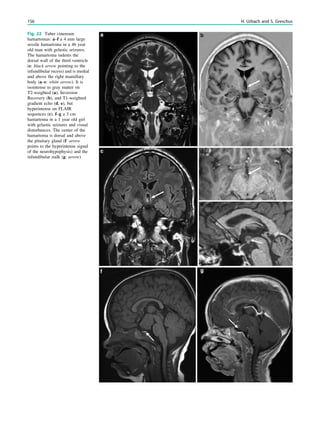
patients (3–5%) has atypical variants either confined to
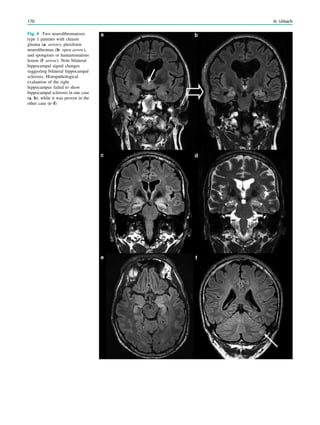
the CA1 field or CA4 field (= end folium sclerosis). These
atypical variants do not show significant atrophy and may be
only detected due to a loss of the internal hippocampal
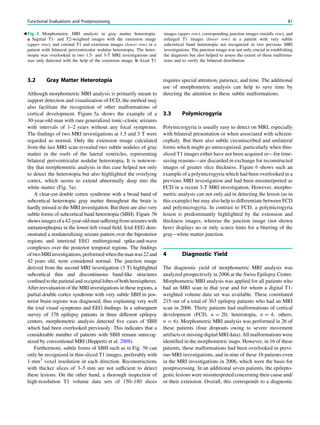
structure (Fig. 1). However, if a hippocampus is normal on
MRI an unrevealing histology is more likely.
6 Imaging
MRI correlate of hippocampal slerosis are atrophy and
increased signal intensity, which are best visualized on
coronal FLAIR and T2-weighted fast spin echo images
angulated perpendicularly to the hippocampal long axis.
Increased signal intensity T2-signal abnormalities appears
to correlate with gliosis and may not be directly related
to the degree of neuronal loss (Briellman et al. 2002).
On FLAIR sequences, contrast to noise ratio (C/N) is higher
Table 1 Neuropathological grading of hippocampal sclerosis [adapted from Wyler et al. (1992)]
Grade Classfication Neuropathological description MRI
Wyler I Mild mesial temporal
damage
Gliosis with slight (10%) or no hippocampal
neuronal dropout involving sectors CA1, CA3,
and/or CA4
Not visible
Wyler II Moderate mesial
temporal damage
Gliosis with moderate (10–50%) neuronal dropout
of CA1, CA3, and/or CA4. If Involvement limited
to CA3 and 4 = end folium sclerosis
Loss of internal structure on high
resolution T2-weighted images
Wyler III ‘‘Classical’’ ammon’s
horn sclerosis
Gliosis with [50% neuronal dropout of CA1, CA3,
and CA4, but sparing CA2
Atrophy and increased T2/FLAIR
signal
Wyler IV ‘‘Total’’ ammon’s
horn sclerosis
Gliosis with [50% neuronal dropout of all sectors Atrophy and increased T2/FLAIR
signal visible
Table 2 Neuropathological grading of hippocampal sclerosis [adapted from Blümcke et al. (2007)]
Grade Description Frequency (%) MRI
Blümcke MTS 1a Severe neuronal loss in CA1,
moderate neuronal loss in other subfields
23 Atrophy and increased T2/FLAIR signal
Blümcke MTS 1b Extensive neuronal loss in all subfields 68 Atrophy and increased T2/FLAIR signal
Blümcke MTS 2 Severe neuronal loss restricted to CA1 7 ?
Blümcke MTS 3 Severe neuronal loss restricted to hilar
region = end folium sclerosis
5 Loss of internal structure on high resolution
T2-weighted images
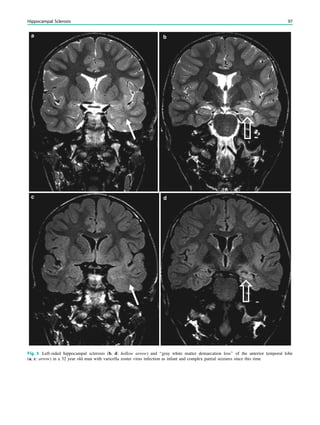
92 H. Urbach](https://image.slidesharecdn.com/epilepsymri-140818120139-phpapp02/85/Epilepsy-mri-94-320.jpg)
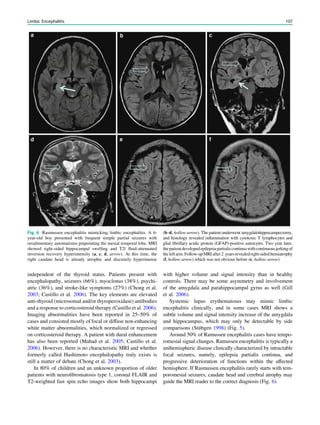
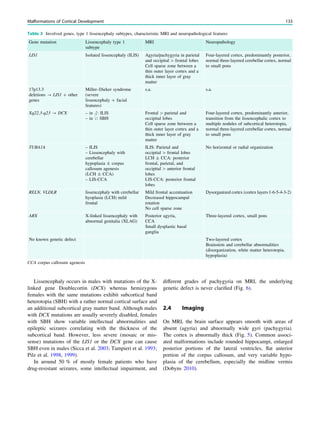
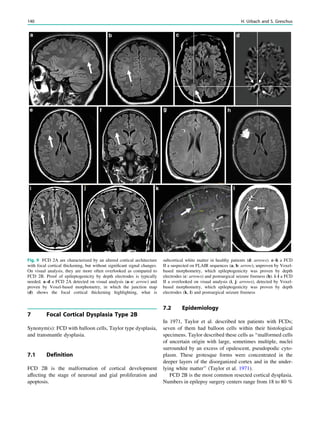
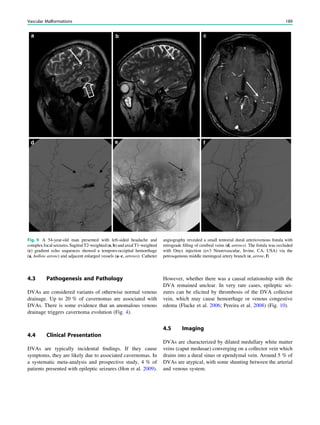
![Table 1 Imaging and genetic classification according to Barkovich [modified from Barkovich et al. (2012), with permission]
Disturbance of neuronal and glial proliferation or apoptosis
1. Congenital microcephaly (premigrational proliferation ;/apoptosis :) (a) Microcephaly with severe intrauterine growth deficiency and short
stature
(b) Microcephaly with variable short stature (severe intrauterine
growth deficiency to mildly short), moderate to severe
(c) Microcephaly with mildly short stature or normal growth, mild to
moderate developmental delay, normal to thin cortex, with or without
simplified gyral pattern, with or without callosal hypogenesis, and
with or without periventricular nodular heterotopia
(d) Microcephaly with mildly short stature or normal growth, severe
developmental delay, variable cortical development with simplified
gyral pattern or cortical dysgenesis, and with or without callosal
hypogenesis
(e) Microcephaly with variable anomalies and less well characterized
syndromes (with or without simplified gyral pattern, with or without
callosal hypogenesis, and with or without cerebellar hypoplasia)
(f) Microcephaly with severe developmental delay and evidence of
degeneration, with or without simplified gyral pattern, with or without
enlarged extra-axial spaces, with or without callosal hypogenesis, and
with or without atypical cortical dysgenesis
(g) Microcephaly with lissencephaly (cortex thick or relatively thick,
smooth gray–white matter border)
(h) Microcephaly with brain volume loss and enlarged ventricles
(hydrocephalus ex vacuo or hydranencephaly), with or without
cortical dysgenesis, and with or without callosal hypogenesis
2. Megalencephaly (a) Megalencephaly with normal cortex (or presumed normal cortex)
(b) Megalencephaly with periventricular nodular heterotopia
(c) Megalencephaly with polymicrogyria and other cortical
dysgenesis
3. Malformations due to abnormal cell proliferation (a) Cortical hamartomas of tuberous sclerosis complex (TSC)
(b) Focal cortical dysplasia (FCD) with balloon cells
(c) Hemimegalencephaly
Disturbance of neuronal migration
1. Malformations with neuroependymal abnormalities: Periventricular
heterotopia
(a) Anterior predominant and diffuse periventricular nodular
heterotopia
(b) Posterior predominant (temporal-trigonal or infrasylvian)
periventricular nodular heterotopia
(c) Periventricular heterotopia, not nodular (uni- or bilateral)
2. Malformations due to generalized abnormal transmantle migration
(radial and nonradial)
(a) Anterior predominant or diffuse classic (four-layered)
lissencephaly and subcortical band heterotopia
(b) Posterior predominant or diffuse classic (four-layered) and two-
layered (without cell sparse zone) lissencephaly and subcortical band
heterotopia
(c) X-linked lissencephaly (three-layered, without cell sparse zone)
with callosal agenesis, ambiguous genitalia
(d) Reelin-type lissencephaly (inverted cortical lamination, without
cell sparse zone)
(e) Variant lissencephaly
3. Malformations presumably due to localized abnormal late radial or
tangential transmantle migration
(a) Subcortical heterotopia (clinically defined with unknown cause)
(b) Sublobar dysplasia (clinically defined with unknown cause)
4. Malformations due to abnormal terminal migration and defects in
pial limiting membrane
(a) Dystroglycan-laminin complex abnormalities with cobblestone
malformation complex, with or without congenital muscular
dystrophy (Walker–Warburg syndrome, muscle–eye–brain disease,
Fukuyama congenital muscular dystrophy, congenital muscular
dystrophy with cerebellar hypoplasia)
(b) Cobblestone malformations in congenital disorders of
glycolysation
(c) Cobblestone malformations with no known glycolysation defect
(d) Other syndromes with cortical dysgenesis and marginal
glioneuronal heterotopia, but with normal cell types
(continued)
Malformations of Cortical Development 127](https://image.slidesharecdn.com/epilepsymri-140818120139-phpapp02/85/Epilepsy-mri-128-320.jpg)
![Table 1 (continued)
Disturbance of neuronal and glial proliferation or apoptosis
Disturbance of cortical organization
1. Malformations with polymicrogyria or cortical malformations
resembling polymicrogyria
(a) Polymicrogyria with transmantle clefts (schizencephaly) or
calcification
(b) Polymicrogyria without transmantle clefts or calcification,
classified by location
(c) Syndromes with polymicrogyria
2. Cortical dysgenesis secondary to inborn errors of metabolism (a) Mitochondrial and pyruvate metabolic disorders
(b) Peroxisomal disorders
3. Focal cortical dysplasia (FCD) without dysmorphic neurons, due to
late developmental disturbances
4. Postmigrational developmental microcephaly (birth occipito-
frontal diameter (OFD)—3 SD or lower, later OFD-4 SD, no evidence
of brain injury)
Classification considers normal cortical development as separated into three overlapping steps and distinguishes malformations caused by
disturbed neuronal/glial proliferation and apoptosis (Step 1), neuronal migration (Step 2), and cortical organization (Step 3). The classification
scheme has been continuously updated, incorporating new genetic findings, and is considered to be a framework but not a finalized classification
(Barkovich et al. 1996, 2001, 2005, 2012)
Table 2 Neuropathologic classification according to Palmini and Lüders and Blümcke et al. [adapted from Palmini and Lüders (2002), Palmini
et al. (2004), and Blümcke et al. (2011)]
Palmini type Blümcke type Neuropathological
description
MRI
Mild malformations of cortical
development type 1 = ectopic neurons
in or adjacent to cortical layer 1
Molecular layer
neurons
Persistent subpial
granular layer
Marginal
glioneuronal
heterotopia
Normal
Mild malformations of cortical
development type 2 = neuronal
heterotopia outside layer 1
Small aggregates of
heterotopic white
matter neurons
Dysgenesis of the
hippocampal
formation
Normal
or
Gray–white matter demarcation
loss
FCD type 1A, 1B = cytoarchitectural
abnormalities without dysmorphic
neurons or balloon cells
FCD type 1a
FCD type 1b
FCD type 1c
A: dyslamination
only
B: dyslamination and
hypertrophic or
immature neurons
a: microcolumnar
(vertical)
dyslamination
b: radial
dyslamination
c: vertical and radial
dyslamination
Normal (1/3 of cases)
or
Gray–white matter demarcation
loss
FCD type 2A, 2B = cytoarchitectural
abnormalities with dysmorphic neurons
or balloon cells
FCD type 2A,
2B = cytoarchitectural
abnormalities with dysmorphic
neurons or balloon cells
A: dysmorphic
neurons
B: dysmorphic
neurons and balloon
cells
A: cortical thickening, abnormal
depth of sulcus
B: cortical thickening, abnormal
depth of sulcus, subcortical
funnel-shaped hyperintensity
Classification considers histopathological cell types and cortical lamination. It distinguishes normal neurons in an abnormal location and
distribution; hypertrophic, immature, and dysplastic neurons; as well as balloon cells. Recent ILAE classification introduces a Focal cortical
dysplasia (FCD) type III, in which mild and FCD type I malformations are associated with hippocampal sclerosis (FCD IIIa), tumors (FCD IIIb),
vascular malformations (FCD IIIc), or other principal lesions acquired during early life (FCD IIId)
128 H. Urbach and S. Greschus](https://image.slidesharecdn.com/epilepsymri-140818120139-phpapp02/85/Epilepsy-mri-129-320.jpg)
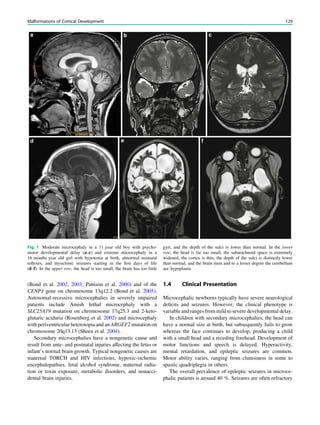
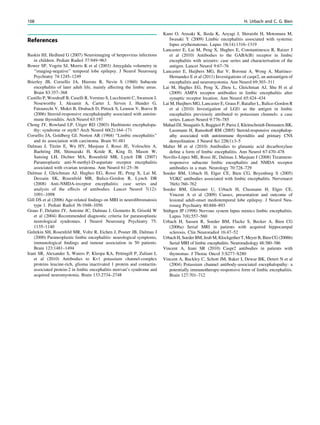
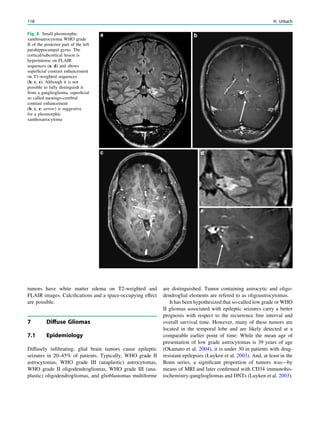
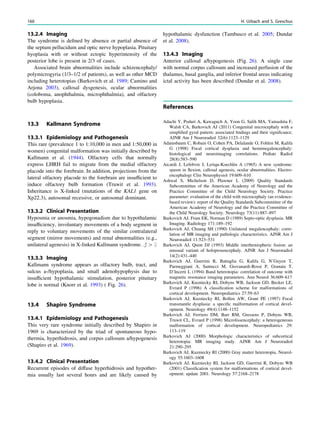
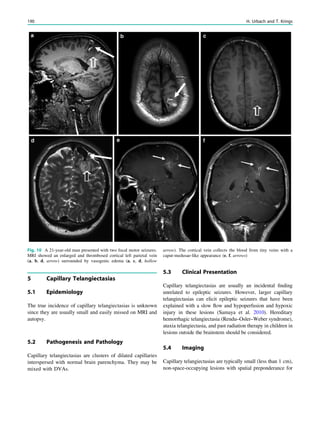
![In SBH, the brain surface appears superficially normal,
except that the sulci between gyri are shallow, and the
cortex is normal and not thick (Barkovich et al. 1994;
Dobyns et al. 1996). Just beneath the cortex, often separated
from it by just a few millimeters of white matter, lies a
smooth band of neurons that never reached the true cortex.
This band has a variable thickness and thin bands are easily
overlooked but highlighted by voxel-based morphometric
analysis (Fig. 7) (Huppertz et al. 2008).
The spectrum of LIS and SBH varies from complete or
nearly complete absence of cerebral convolutions or agyria
(grades 1 and 2) to abnormally wide convolutions or
pachygyria (grade 4) to normal convolutions separated by
shallow sulci overlying SBH (grade 6). Intermediate grades
consist of mixed agyria–pachygyria (grade 3) and mixed
pachygyria–SBH (grade 5) (Dobyns 2010).
Paucity of cerebral gyri often shows a gradient, which is
useful in determining the most likely genetic cause. If lis-
sencephaly and SBH are pronounced in the anterior frontal
lobes, a DCX mutation should be considered. More severe
changes in the parietal and occipital lobes point to LIS1 or
TUB1A mutations. Lissencephaly with cerebellar hypopla-
sia point to RELN and VLDLR mutations, if pronounced in
the frontal lobes, and to TUB1A mutations, if pronounced in
the posterior frontal lobes, perisylvian, or parietal and
occipital lobes, repectively. Lissencephaly with corpus
callosum agenesis point to ARX mutations if agyria or
pachygyria is pronounced in the temporal and posterior
brain regions.
Most lissencephalies have a genetic cause, however,
periventricular and subcortical calcifications suggest an
infectious (particularly CMV) cause (Figs. 5-7).
3 Cobblestone Lissencephaly, Congenital
Muscular Dystrophies
3.1 Definition
Congenital muscular dystrophy syndromes or so-called
dystroglycanopathies represent a heterogeneous group of
congenital diseases affecting the muscles and frequently the
brain and eyes, which are characterized by defective protein
glycolization. Protein glycolization is a complex mechanism,
in which sugars (glycans) are attached to proteins modulating
their stability, conformity, and function (Barkovich et al.
2005). For example, in the developing brain radial glial cells
have end feet attached to the pial basement membrane, and
defective basement membrane formation results in cobble-
stone lissencephaly with neurons migrating too far (e.g.,
neurons destinated for cortex layers II and III migrate and
populate the marginal zone) (Clement et al. 2008).
The clinical spectrum comprises severe [Walker–Warburg
syndrome (WWS), Fukuyama congenital muscular dystro-
phy, muscle–eye–brain disease] and milder forms with or
without brain involvement (congenital muscular dystrophy
CMD, merosin-deficient congenital muscular dystrophy,
merosin-positive congenital muscular dystrophy C1C,
merosin-positive congenital muscular dystrophy C1D, limb
girdle muscular dystrophies LGMD2I, LGMD2K, LGMD2L,
LGMD2M). Several mutations in genes encoding for proteins
of the dystrophin glycoprotein complex have been found
(protein-O-mannosyl transferase 1 POMT1, OMIM 607423;
protein-O-mannosyl transferase 2 POMT2, OMIM 607439;
protein-O-mannose 1,2-N-acetylglucosaminyltransferase1
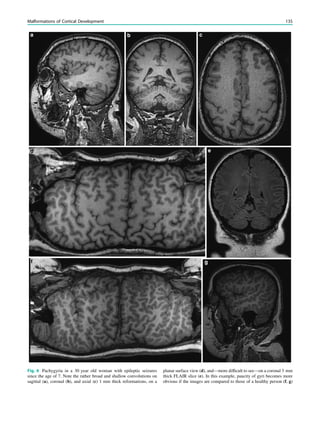
Fig. 5 Type I lissencephaly with ‘‘posterior’’ accentuation suggesting a LIS1 gene mutation. This 17 months year old girl showed global
developmental delay and suffered from generalized seizures since the age of 8 months
134 H. Urbach and S. Greschus](https://image.slidesharecdn.com/epilepsymri-140818120139-phpapp02/85/Epilepsy-mri-135-320.jpg)
![spectroscopic study of epileptogenic hypothalamic hamartomas:
analysis of 72 cases. AJNR Am J Neuroradiol 25:450–462
Friede R (1989) Developmental neuropathology, 2nd edn. Springer,
Berlin
Garavelli L, Guareschi E, Errico S, Simoni A, Bergonzini P, Zollino M,
Gurrieri F, Mancini GM, Schot R, Van Der Spek PJ, Frigieri G,
Zonari P, Albertini E, Giustina ED, Amarri S, Banchini G,
Dobyns WB, Neri G (2007) Megalencephaly and perisylvian
polymicrogyria with postaxial polydactyly and hydrocephalus
[MPPH]: report of a new case. Neuropediatrics 38:200–203
Garbelli R, Milesi G, Medici V, Villani F, Didato G, Deleo F,
D’Incerti L, Morbin M, Mazzoleni G, Giovagnoli AR, Parente A,
Zucca I, Mastropietro A, Spreafico R (2012) Blurring in patients
with temporal lobe epilepsy: clinical, high-field imaging and
ultrastructural study. Brain, Aug 135(Pt 8):2337–2349
Giordano L, Vignoli A, Pinelli L, Brancati F, Accorsi P, Faravelli F,
Gasparotti R, Granata T, Giaccone G, Inverardi F, Frassoni C,
Dallapiccola B, Valente EM, Spreafico R (2009) Joubert syndrome
with bilateral polymicrogyria: clinical and neuropathological
findings in two brothers. Am J Med Genet A 149A:1511–1515
Gripp KW, Hopkins E, Vinkler C, Lev D, Malinger G, Lerman-Sagie T,
Dobyns WB (2009) Significant overlap and possible identity of
macrocephaly capillary malformation and megalencephaly poly-
microgyria-polydactyly hydrocephalus syndromes. Am J Med Genet
A 149A:868–876
Guerrini R, Dobyns WB (1998) Bilateral periventricular nodular
heterotopia with mental retardation and frontonasal malformation.
Neurology 51(2):499–503
Hayashi N, Tsutsumi Y, Barkovich AJ (2002) Polymicrogyria without
porencephaly/schizencephaly. MRI analysis of the spectrum and
the prevalence of macroscopic findings in the clinical population.
Neuroradiology 44(8):647–655
Hermier M, Montavont A, Dupuis-Girod S, Cho TH, Honnorat J,
Plauchu H (2010) Polymicrogyria: an underrecognized cause of
epilepsy in in patients with hereditary hemorrhagic telangiectasia
(Rendu-Osler disease). Epilepsia 51(Suppl 4):1–189
Hevner RF (2005) The cerebral cortex malformation in thanatophoric
dysplasia: neuropathology and pathogenesis. Acta Neuropathol
110(3):208–221
Hildebrandt M, Pieper T, Winkler P, Kolodziejczyk D, Holthausen H,
Blümcke I (2005) Neuropathological spectrum of cortical dysplasia
in children with severe focal epilepsies. Acta Neuropathol
110(1):1–11
Hoyt CS, Billson F, Ouvrier R, Wise G (1978) Ocular features of
Aicardi’s syndrome. Arch Ophthalmol 96:291–295
Huppertz HJ, Wellmer J, Staack AM, Altenmüller DM, Urbach H,
Kröll J (2008) Voxel-based 3-D MRI analysis helps to detect subtle
forms of subcortical band heterotopia. Epilepsia 49(5):772–785
Jackson AP (2002) Identification of microcephalin, a protein impli-
cated in determining the size of the human brain. Am J Hum Genet
71(1):136–142
Jansen A, Andermann E (2005) Genetics of the polymicrogyria
syndromes. J Med Genet 42(5):369–378
Jissendi-Tchofo P, Kara S, Barkovich AJ (2009) Midbrain–hindbrain
involvement in lissencephalies. Neurology 72(5):410–418
Kallmann FT, Schoenfeld WA, Barrera SE (1944) The genetics aspects
of primary eunuchoidism. Am J Mental Deficits 48:203–208
Kirschstein T, Fernandez G, Grunwald T, Pezer N, Urbach H,
Blümcke I, Van Roost D, Lehnertz K, Elger CE (2003) Heterot-
opias, cortical dysplasias and glioneural tumors participate in
cognitive processing in patients with temporal lobe epilepsy.
Neurosci Lett 338:237–241
Knorr JR, Ragland RL, Brown RS, Gelber N (1993) Kallmann
syndrome: MR findings. AJNR Am J Neuroradiol. 14(4):845–851
Krsek P, Maton B, Korman B, Pacheco-Jacome E, Jayakar P, Dunoyer C,
Rey G, Morrison G, Ragheb J, Vinters HV, Resnick T, Duchowny M
(2008) Different features of histopathological subtypes of pediatric
focal cortical dysplasia. Ann Neurol 63(6):758–769
Krsek P, Pieper T, Karlmeier A, Hildebrandt M, Kolodziejczyk D,
Winkler P, Pauli E, Blümcke I, Holthausen H (2009a) Different
presurgical characteristics and seizure outcomes in children with
focal cortical dysplasia type I or II. Epilepsia 50(1):125–137
Krsek P, Maton B, Jayakar P, Dean P, Korman B, Rey G, Dunoyer C,
Pacheco-Jacome E, Morrison G, Ragheb J, Vinters HV, Resnick T,
Duchowny M (2009b) Incomplete resection of focal cortical
dysplasia is the main predictor of poor postsurgical outcome.
Neurology 72(3):217–223
Kuzniecky R, Andermann F, Guerrini R (1993) Congenital bilateral
perisylvian syndrome: study of 31 patients. The congenital bilateral
perisylvian syndrome multicenter collaborative study. Lancet
341:608–612
Lerner JT, Salamon N, Hauptman JS, Velasco TR, Hemb M, Wu JY,
Sankar R, Donald Shields W, Engel J Jr, Fried I, Cepeda C,
Andre VM, Levine MS, Miyata H, Yong WH, Vinters HV,
Mathern GW (2009) Assessment of surgical outcomes for mild
type I and severe type II cortical dysplasia: a critical review and the
UCLA experience. Epilepsia 50:1310–1335
Leventer RJ, Jansen A, Pilz DT, Stoodley N, Marini C, Dubeau F,
Malone J, Mitchell LA, Mandelstam S, Scheffer IE, Berkovic SF,
Andermann F, Andermann E, Guerrini R, Dobyns WB (2010)
Clinical and imaging heterogeneity of polymicrogyria: a study of
328 patients. Brain 133:1415–1427
Lewis AJ, Simon EM, Barkovich AJ, Clegg NJ, Delgado MR,
Levey E, Hahn JS (2002) Middle interhemispheric variant of
holoprosencephaly: a distinct cliniconeuroradiologic subtype.
Neurology 59(12):1860–1865.
Matsunaga E, Shiota K (1977) Holoprosencephaly in human embryos:
epidemiologic studies of 150 cases. Teratology 16:261–272
Miller SP, Shevell MI, Patenaude Y, Poulin C, O’Gorman AM (2000)
Septo-optic dysplasia plus: a spectrum of malformations of cortical
development. Neurology 54:1701–1703
Moog U, De Die-Smulders CE, Schrander-Stumpel CT, Engelen JJ,
Hamers AJ, Frints S, Fryns JP (2001) Holoprosencephaly: the
Maastricht experience. Genet Couns 12(3):287–298
Oba H, Barkovich AJ (1995) Holoprosencephaly: an analysis of
callosal formation and its relation to development of the inter-
hemispheric fissure. AJNR Am J Neuroradiol 16:453–460
Palm L, Hägerstrand I, Kristoffersson U, Blennow G, Brun A, Jörgensen
C (1986) Nephrosis and disturbances of neuronal migration in male
siblings–a new hereditary disorder? Arch Dis Child 61(6):545–548
Palmini A, Lüders H (2002) Classification issues in malformations
caused by abnormalities of cortical development. Neurosurg Clin N
Am 13:1–16
Palmini A, Najm I, Avanzini G, Babb T, Guerrini R, Foldvary-
Schaefer N, Jackson G, Lüders HO, Prayson R, Spreafico R,
Vinters HV (2004) Terminology and classification of the cortical
dysplasias. Neurology 62(6 Suppl 3):S2–S8. Review
Pattison L, Crow YJ, Deeble VJ, Jackson AP, Jafri H, Rashid Y,
Roberts E, Woods CG (2000) A fifth locus for primary autosomal
recessive microcephaly maps to chromosome 1q31. Am J Hum
Genet 67:1578–1580
Pilz DT, Matsumoto N, Minnerath S, Mills P, Gleeson JG, Allen KM,
Walsh CA, Barkovich AJ, Dobyns WB, Ledbetter DH, Ross ME
(1998) LISI and XLIS (DCX) mutations cause most classical
lissencephaly, but different patterns of malformation. Hum Mol
Genet 7:2029–2037
Pilz DT, Kuc J, Matsumoto N, Bodurtha J, Bernadi B, Tassinari CA,
Dobyns WB, Ledbetter DH (1999) Subcortical band heterotopia in
162 H. Urbach and S. Greschus](https://image.slidesharecdn.com/epilepsymri-140818120139-phpapp02/85/Epilepsy-mri-163-320.jpg)
![Chiang KL, Chang KP, Wong TT, Hsu TR (2009) Linear scleroderma
‘‘en coup de sabre’’: initial presentation as intractable partial
seizures in a child. Pediatr Neonatol 50(6):294–298
Claeys KG, Claes LR, Van Goethem JW et al (2007) Epilepsy and
migraine in a patient with Urbach–Wiethe disease. Seizure
16:465–468
Cohen MM Jr, Hayden PW (1979) A newly recognized hamartom-
atous syndrome. Birth Defects Orig Artic Ser 15:291–296
Dietrich RB, Glidden DE, Roth GM et al (1998) The Proteus
syndrome: CNS manifestations. Am J Neuroradiol 19(5):987–990
Enjoltas O, Riche MC, Merland JJ (1985) Facial port-wine stains and
Sturge–Weber syndrome. Pediatrics 76:48–51
Gill DS (2006) Age-related findings on MRI in neurofibromatosis type
1. Pediatr Radiol 36:1048–1056
Gonçalves FG, de Melo MB, de L Matos V et al (2010) Amygdalae
and striatum calcification in lipoid proteinosis. Am J Neuroradiol
31(1):88–90
Gorlin RJ, Cohen MM, Hennekam RCM (2001) Syndromes of the
Head and Neck, 4th edn. Oxford University Press, New York,
pp 484–488
Greene AK, Rogers GF, Mulliken JB (2007) Schimmelpenning
syndrome: an association with vascular anomalies. Cleft Palate
Craniofac J 44:208–215
Happle R (2010) The group of epidermal nevus syndromes. Part I.
Well defined phenotypes. J Am Acad Dermatol 63(1):1–22
Hennel SJ, Ekert PG, Volpe JJ, Inder TE (2003) Insights into the
pathogenesis of cerebral lesions in incontinentia pigmenti. Pediatr
Neurol 29(2):148–150
Hornstein OP, Knickenberg M (1974) Zur Kenntnis des Schimmel-
penning-Feuerstein-Mims-Syndroms (Organoide Naevus-Phako-
matose) [in German]. Arch Derm Forsch 250:33–50
Hsieh DT, Chang T (2011) Incontinentia pigmenti: skin and magnetic
resonance imaging findings. Arch Neurol 68(8):1080
Hubert JN, Callen JP (2002) Incontinentia pigmenti presenting as
seizures. Pediatr Dermatol 19(6):550–552
Ito M (1952) Studies of melanin: XI. Incontinentia pigmenti achrom-
iens. Tohoku J Exp Med 55(suppl):55–57
Jallo GI, Kothbauer K, Mehta V et al (2005) Meningioangiomatosis
without neurofibromatosis: a clinical analysis. J Neurosurg 103(4
Suppl):319–324
Krueger DA, Care MM, Holland K et al (2010) Everolimus for
subependymal giant-cell astrocytomas in tuberous sclerosis.
N Engl J Med 363(19):1801–1811
Longo D, Paonessa A, Specchio N et al (2011) Parry–Romberg
syndrome and Rasmussen encephalitis: possible association. Clin-
ical and neuroimaging features. J Neuroimaging 21(2):188–193
McCall S, Ramzy MI, Cure JK, Pai GS (1992) Encephalocraniocu-
taneous lipomatosis and the Proteus syndrome: distinct entities
with overlapping manifestations. Am J Med Genet 43:662–668
Meuwissen ME, Mancini GM (2012) Neurological findings in
incontinentia pigmenti; a review. Eur J Med Genet 55(5):323–331
NIH Consensus Development Conference (1988) Neurofibromatosis:
conference statement. Arch Neurol 45:575–578
Osborne JP, Fryer A, Webb D (1991) Epidemiology of tuberous
sclerosis. Ann NY Acad Sci 615:125–127
Pascual-Castroviejo I, Roche MC, Martinez Fernández V et al (1994)
Incontinentia pigmenti: MR demonstration of brain changes. Am J
Neuroradiol 15(8):1521–1527
Pavone L, Curatolo P, Rizzo R et al (1991) Epidermal nevus
syndrome: a neurologic variant with hemimegalencephaly, gyral
malformation, mental retardation, seizures, and facial hemihyper-
trophy. Neurology 41:266–271
Roach ES, Gomez MR, Northrup H (1998) Tuberous Sclerosis
Complex Consensus Conference: revised clinical diagnostic crite-
ria. J Child Neurol 13:624–628
Sapp JC, Turner JT, van de Kamp JM et al (2007) Newly delineated
syndrome of congenital lipomatous overgrowth, vascular malfor-
mations, and epidermal nevi (CLOVE syndrome) in seven patients.
Am J Med Genet 143A:2944–2958
Seifert F, Bien CG, Schellinger PD et al (2011) Parry–Romberg
syndrome with chronic focal encephalitis: two cases. Clin Neurol
Neurosurg 113(2):170–172
Sugarman JL (2007) Epidermal nevus syndromes. Semin Cutan Med
Surg 26(4):221–230
Turner JT, Cohen MM, Biesecker LG (2004) Reassessment of the
Proteus syndrome literature: application of diagnostic criteria to
published cases. Am J Med Genet 130A:111–122
Urbach E, Wiethe C (1929) Lipoidosis cutis et mucosae. Virch Arch
Pathol Anat 273:285–319
Wiedemann HR, Burgio GR, Aldenhoff P et al (1983) The Proteus
syndrome. Partial gigantism of the hands and/or feet, nevi,
hemihypertrophy, subcutaneous tumors, macrocephaly or other
skull anomalies and possible accelerated growth and visceral
affections. Eur J Pediatr 140(1):5–12
Wolf NI, Krämer N, Harting I et al (2005) Diffuse cortical necrosis in a
neonate with incontinentia pigmenti and an encephalitis-like
presentation. Am J Neuroradiol 26:1580–1582
176 H. Urbach](https://image.slidesharecdn.com/epilepsymri-140818120139-phpapp02/85/Epilepsy-mri-176-320.jpg)
![Cognard C, Gobin YP, Pierot L, Bailly AL, Houdart E, Casasco A,
Chiras J, Merland JJ (1995) Cerebral dural arteriovenous fistulas:
clinical and angiographic correlation with a revised classification
of venous drainage. Radiology 194:671–680
da Costa L, Thines L, Dehdashti AR, Wallace MC, Willinsky RA,
Tymianski M, Schwartz ML, ter Brugge KG (2009) Management
and clinical outcome of posterior fossa arteriovenous malforma-
tions: report on a single-centre 15-year experience. J Neurol
Neurosurg Psychiatry 80(4):376–379
Del Curling O Jr, Kelly DL Jr, Elster AD, Craven TE (1991) An
analysis of the natural history of cavernous angiomas. J Neurosurg
75:702–708
Englot DJ, Han SJ, Lawton MT, Chang EF (2011) Predictors of
seizure freedom in the surgical treatment of supratentorial cavern-
ous malformations. J Neurosurg 115(6):1169–1174
Fierstra J, Conklin J, Krings T, Slessarev M, Han JS, Fisher JA,
Terbrugge K, Wallace MC, Tymianski M, Mikulis DJ (2011)
Impaired peri-nidal cerebrovascular reserve in seizure patients with
brain arteriovenous malformations. Brain 134(Pt 1):100–109
Flacke S, Stuer C, Stoffel M, Urbach H (2006) Symptomatic
developmental venous anomaly after spontaneous thrombosis of
the collector vein. Clin Neuroradiol 16:131–133
Garcin B, Houdart E, Porcher R, Manchon E, Saint-Maurice JP, Bresson
D, Stapf C (2012) Epileptic seizures at initial presentation in
patients with brain arteriovenous malformation. Neurology 78(9):
626–631
Gross BA, Lin N, Du R, Day AL (2011) The natural history of
intracranial cavernous malformations. Neurosurg Focus 30(6):E24
Hadizadeh DR, Kukuk GM, Steck DT, Gieseke J, Urbach H,
Tschampa HJ, Greschus S, Kovàcs A, Möhlenbruch M, Bostroem
A, Schild HH, Willinek WA (2012) Noninvasive evaluation of
cerebral arteriovenous malformations by 4D-MRA for preoperative
planning and postoperative follow-up in 56 patients: comparison
with DSA and intraoperative findings. AJNR Am J Neuroradiol
33(6):1095–1101
Hon JM, Bhattacharya JJ, Counsell CE, Papanastassiou V, Ritchie V,
Roberts RC, Sellar RJ, Warlow CP, Al-Shahi Salman R (2009)
SIVMS Collaborators. The presentation and clinical course of
intracranial developmental venous anomalies in adults: a system-
atic review and prospective, population-based study. Stroke
40(6):1980–1985
Josephson CB, Leach JP, Duncan R, Roberts RC, Counsell CE, Al-
Shahi Salman R (2011) Scottish Audit of Intracranial Vascular
Malformations (SAIVMs) Steering committee and collaborators.
Seizure risk from cavernous or arteriovenous malformations:
prospective population-based study. Neurology 76(18):1548–1554
Josephson CB, Bhattacharya JJ, Counsell CE, Papanastassiou V,
Ritchie V, Roberts R, Sellar R, Warlow CP, Al-Shahi Salman R
(2012) On behalf of the Scottish Audit of Intracranial Vascular
Malformations (SAIVMs) steering committee and collaborators.
Seizure risk with AVM treatment or conservative management:
prospective, population-based study. Neurology 79(6):500–507
Krings T, Geibprasert S, Luo CB, Bhattacharya JJ, Alvarez H,
Lasjaunias P (2007) Segmental neurovascular syndromes in
children. Neuroimaging Clin N Am 17(2):245–258
Moran NF, Fish DR, Kitchen N, Shorvon S, Kendall BE, Stevens JM
(1999) Supratentorial cavernous haemangiomas and epilepsy: a
review of the literature and case series. J Neurol Neurosurg
Psychiatry 66:561–568
Moriarity JL, Clatterbuck RE, Rigamonti D (1999) The natural history
of cavernous malformations. Neurosurg Clin N Am 10:411–417
Osborn AG, Salzman KL, Barkovich AJ (eds) (2010) Diagnostic
imaging. Brain Amirsys Inc, Salt Lake City
Pereira VM, Geibprasert S, Krings T, Aurboonyawat T, Ozanne A,
Toulgoat F, Pongpech S, Lasjaunias PL (2008) Pathomechanisms
of symptomatic developmental venous anomalies. Stroke
39(12):3201–3215
Raabe A, Pernhorst K, Schmitz AK, Grote A, Urbach H, Friedman A,
Albert J. Becker AJ, Elger CE, Niehusmann P (2012) Clinico-
neuropathological correlations in vascular lesions suggest astroglial
albumin storage as common epileptogenic factor. Epilepsia 53:
539–548
Sayama CM, Osborn AG, Chin SS, Couldwell WT (2010) Capillary
telangiectasias: clinical, radiographic, and histopathological fea-
tures. Clinical article. J Neurosurg 113(4):709–714
Shankar JJS, Menezes R, Pohlman-Eden B, Wallace C, Terbrugge K,
Krings T (2012) Angio-architecture of brain AVM determines
seizures presentation- proposed scoring system. AJNR Am J
Neuroradiol [Epub ahead of print]
Spetzler RF, Martin NA (1986) A proposed grading system for
arteriovenous malformations. J Neurosurg 65:476–483
Stapf C, Mohr JP, Pile-Spellman J, Solomon RA, Sacco RL, Connolly
ES Jr (2001) Epidemiology and natural history of arteriovenous
malformations. Neurosurg Focus 11(5):e1
Stapf C, Khaw AV, Sciacca RR, Hofmeister C, Schumacher HC, Pile-
Spellman J, Mast H, Mohr JP, Hartmann A (2003) Effect of age on
clinical and morphological characteristics in patients with brain
arteriovenous malformation. Stroke 34(11):2664–2669
Stapf C, Mast H, Sciacca RR, Choi JH, Khaw AV, Connolly ES, Pile-
Spellman J, Mohr JP (2006) Predictors of hemorrhage in patients
with untreated brain arteriovenous malformation. Neurology
66(9):1350–1355
Wurm G, Schnizer M, Fellner FA (2005) Cerebral cavernous
malformations associated with venous anomalies: surgical consid-
erations. Neurosurgery 57(Suppl 1):42–58
Zabramski JM, Wascher TM, Spetzler RF, Johnson B, Golfinos J,
Drayer BP, Brown B, Rigamonti D, Brown G (1994) The natural
history of familial cavernous malformations: results of an ongoing
study. J Neurosurg 80:422–432
192 H. Urbach and T. Krings](https://image.slidesharecdn.com/epilepsymri-140818120139-phpapp02/85/Epilepsy-mri-192-320.jpg)
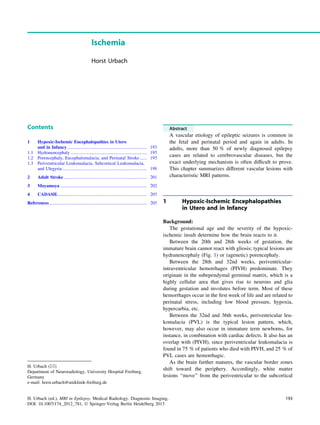
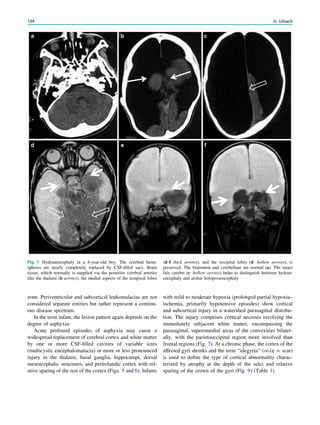
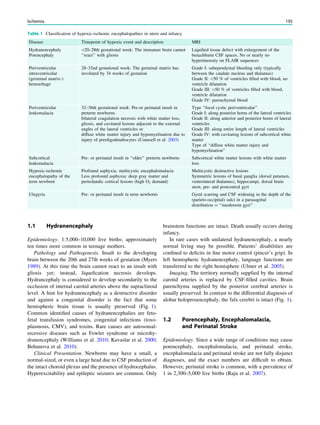
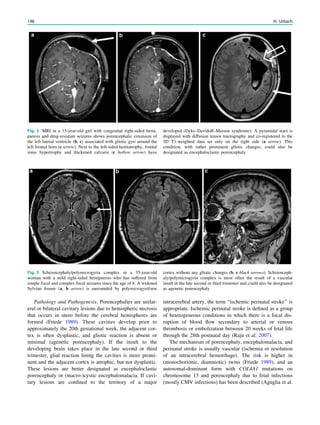
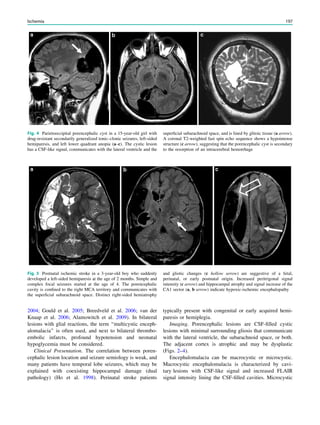
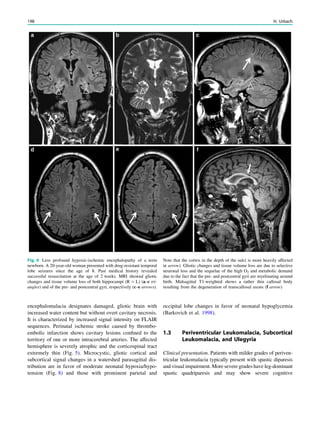
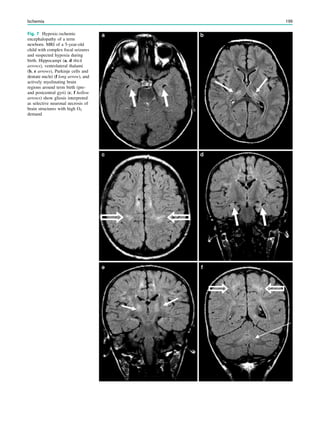
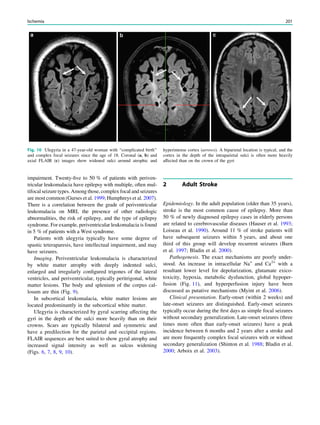
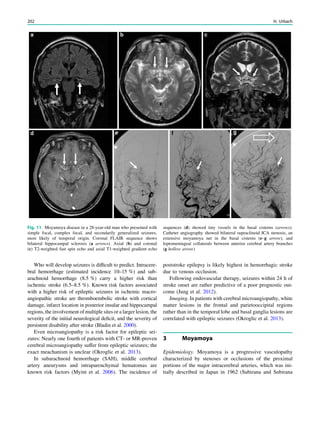
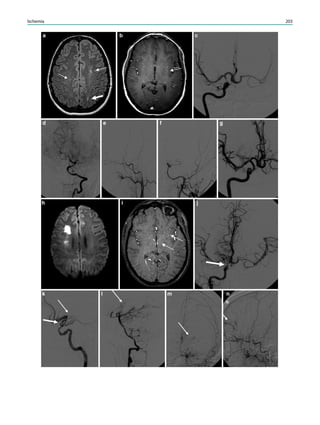
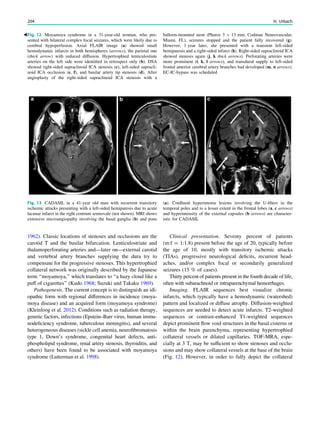
![Kavaslar GN, Onengüt S, Derman O et al (2000) The novel genetic
disorder microhydranencephaly maps to chromosome 16p13.3-
12.1. Am J Hum Genet 66(5):1705–1709
Kleinloog R, Regli L, Rinkel GJ, Klijn CJ (2012) Regional differences
in incidence and patient characteristics of moyamoya disease: a
systematic review. J Neurol Neurosurg Psychiatry 83(5):531–536
Kudo T (1968) Spontaneous occlusion of the circle of Willis. A
disease apparently confined to Japanese. Neurology 18(5):485–496
Loiseau J, Loiseau P, Duche B et al (1990) A survey of epileptic
disorders in southwest France: seizures in elderly patients. Ann
Neurol 27:232–237
Lutterman J, Scott M, Nass R, Geva T (1998) Moyamoya syndrome
associated with congenital heart disease. Pediatrics 101:57–60
Myers RE (1989) Cerebral ischemia in the developing primate fetus.
Biomed Biochim Acta 48:S137–S142
Myint PK, Staufenberg EF, Sabanathan K (2006) Post-stroke seizure
and post-stroke epilepsy. Postgrad Med J 82(971):568–572
Okroglic S, Widmann CN, Urbach H, Scheltens P, Heneka M (2013)
Clinical symptoms, risk factors and cardiovascular medication in
patients diagnosed with cerebral microangiopathy. PLoS ONE 8(2):
e53455
Raju TN, Nelson KB, Ferriero D (2007) NICHD-NINDS perinatal
stroke workshop participants. Ischemic perinatal stroke: summary
of a workshop sponsored by the national institute of child health
and human development and the national institute of neurological
disorders and stroke. Pediatrics 120(3):609–616
Shinton RA, Gill JS, Melnick SC et al (1988) The frequency,
characteristics and prognosis of epileptic seizures at the onset of
stroke. J Neurol Neurosurg Psychiatry 51:273–276
Subirana A, Subirana M (1962) Malformations vasculaires du type de
l’angiome arterial racemeux [in French]. Rev Neurol 107:545–550
Suzuki J, Takaku A (1969) Cerebrovascular ‘‘moyamoya’’ disease:
disease showing abnormal net-like vessels in base of brain. Arch
Neurol 20:288–299
Tournier-Lasserve F, Loutel A, Melki J et al (1993) Cerebral
autosomal dominant arteriopathy with subcortical infarcts and
leukoencephalopathy maps to chromosome 19q12. Nat Genet
3:256–259
Ulmer S, Moeller F, Brockmann MA et al (2005) Living a normal life
with the nondominant hemisphere: magnetic resonance imaging
findings and clinical outcome for a patient with left-hemispheric
hydranencephaly. Pediatrics 116(1):242–245
van der Knaap MS, Smit LM, Barkhof F et al (2006) Neonatal
porencephaly and adult stroke related to mutations in collagen IV
A1. Ann Neurol 59(3):504–511
Velioza R, Mourand I, Serafini A et al (2011) Focal epilepsy as first
symptom in CADASIL. Seizure 20:502–504
Williams D, Patel C, Fallet-Bianco C et al (2010) Fowler syndrome—a
clinical, radiological, and pathological study of 14 cases. Am J
Med Genet A 152A(1):153–160
Yousry TA, Seelos K, Mayer M et al (1999) Characteristic MR lesion
pattern and correlation of T1 and T2 lesion volume with neurologic
and neuropsychological findings in cerebral autosomal dominant
arteriopathy with subcortical infarcts and leukoencephalopathy
(CADASIL). AJNR Am J Neuroradiol 20:91–100
206 H. Urbach](https://image.slidesharecdn.com/epilepsymri-140818120139-phpapp02/85/Epilepsy-mri-206-320.jpg)
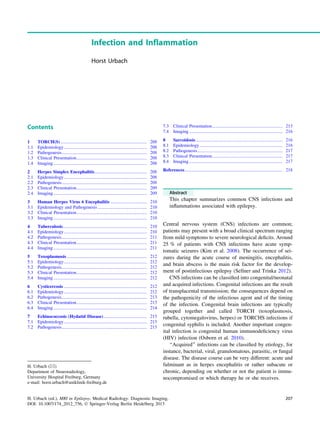
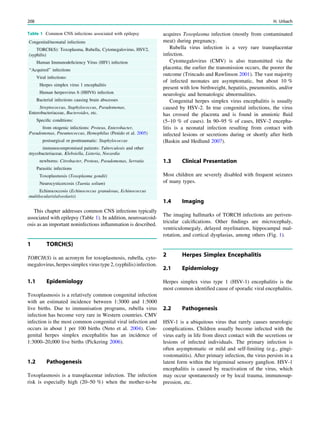
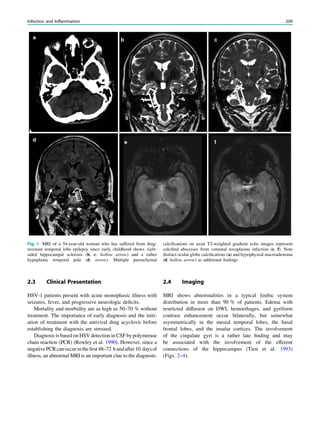
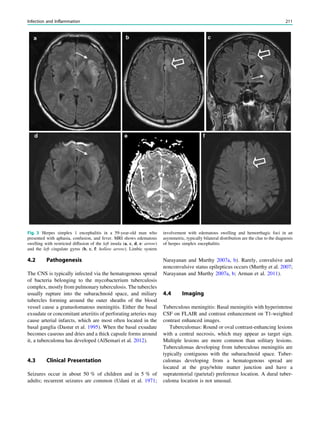
![Hydrocephalus and arterial infarcts are complications
due to meningitis and arteriitis.
A clue to the diagnosis is the proof of extracerebral, most
often reactivated pulmonary tuberculosis (Fig. 5).
5 Toxoplasmosis
5.1 Epidemiology
Toxoplasmosis is the most common human parasite
worldwide and is the most common opportunistic CNS
infection in AIDS patients. Infection via the placenta is
possible; a first infection during pregnancy has a 50 %
infection risk for the child [see Sect. 1: TORCH(S)].
5.2 Pathogenesis
Oocytes are ingested with infected meat, raw milk, or cat
feces; they evolve over various stages in the host intenstine
and enter different organs (brain, heart, peripheral muscles)
after hematogenous spreading.
5.3 Clinical Presentation
Patients present with subacute headaches, fever, (focal)
seizures, and focal neurological signs.
5.4 Imaging
Imaging studies typically reveal 1–3-cm-large lesions with
a T2-hypointense wall and a T2-hyperintense center with
increased ADC values. Multifocality is seen in 70 % of
cases (Chang et al. 1995). Lesions are surrounded by peri-
focal edema and lesions, and edema may be confined to a
vascular territory.
The lesion wall typically strongly enhances, and
enhancement may also occur in the necrotic center, which is
designated as a target sign. A target sign consisting of an
innermost enhancing core, which is more often eccentric
than central, an intermediate hypointense zone, and a
peripheral enhancing rim is considered highly suggestive of
toxoplasmosis but may also occur in other CNS infections,
such as tuberculosis (Chang et al. 1995; Bargalló et al.
1996) (Fig. 6).
6 Cysticercosis
6.1 Epidemiology
Cysticercosis is the most common parasitic CNS infection,
a leading cause of acquired epilepsy worldwide, and the
main reason for a higher prevalence of epilepsy in devel-
oping countries (Del Brutto 2012).
Fig. 4 A 31-year-old man presented with daily complex focal
temporal lobe seizures. He became ill with herpes simplex encephalitis
5 years earlier, leaving him in an amnesic and dependent state. MRI
shows extensive bilateral tissue destruction mainly of the basal and
mesial temporal lobes (a, b: arrows). Hemosiderin deposits on T2-
weighted images indicate that a hemorrhagic, necrotizing encephalitis
had occurred (c: arrows)
212 H. Urbach](https://image.slidesharecdn.com/epilepsymri-140818120139-phpapp02/85/Epilepsy-mri-212-320.jpg)
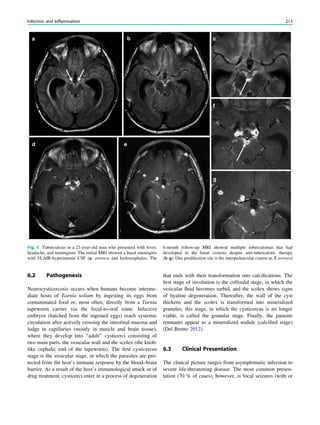
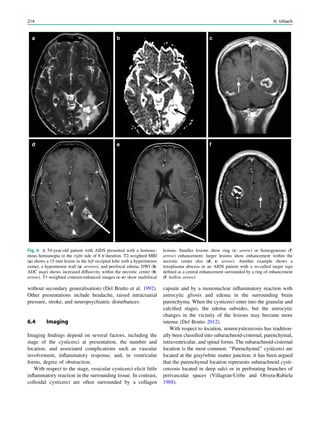
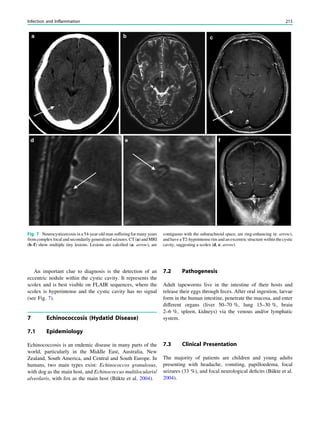
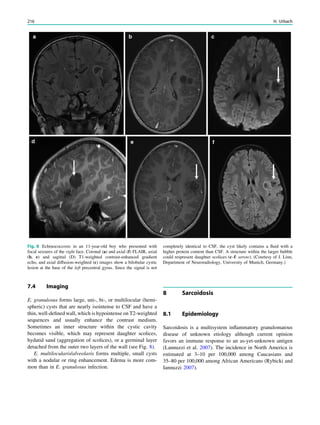
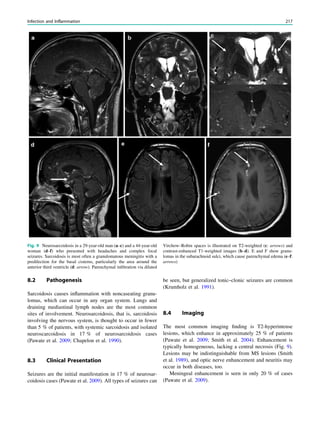
![Sarcoidosis may also present as extraaxial or intraaxial
mass lesions (Urbach et al. 1997). If located within the
parenchyma, a spread from the subarachnoid space via
Virchow–Robin spaces should be carefully searched for
(Mirfakhraee et al. 1986) (Fig. 8). As in tuberculosis, a clue
to the diagnosis is the proof of systemic, most often pul-
monary involvement.
References
AlSemari A, Baz S, Alrabiah F, Al-Khairallah T, Qadi N, Kareem A,
Alrajhi AA (2012) Natural course of epilepsy concomitant with
CNS tuberculomas. Epilepsy Res 99(1–2):107–111
Arman F, Kaya D, Akgün Y, Kocagöz S (2011) Tuberculous
meningitis presenting with nonconvulsive status epilepticus. Epi-
lepsy Behav 20(1):111–115
Bargalló J, Berenguer J, García-Barrionuevo J et al (1996) The ‘‘target
sign’’: is it a specific sign of CNS tuberculoma? Neuroradiology
38(6):547–550
Baskin HJ, Hedlund G (2007) Neuroimaging of herpesvirus infections
in children. Pediatr Radiol 37(10):949–963
Bishburg E, Sunderam G, Reichman LB, Kapila R (1986) Central
nervous system tuberculosis with the acquired immunodeficiency
syndrome and its related complex. Ann Intern Med 105:210–213
Bükte Y, Kemaloglu S, Nazaroglu H et al (2004) Cerebral hydatid
disease: CT and MR imaging findings. Swiss Med Wkly
134(31–32):459–467 (Review)
Chang L, Cornford ME, Chiang FL et al (1995) Radiologic-pathologic
correlation. Cerebral toxoplasmosis and lymphoma in AIDS. AJNR
Am J Neuroradiol 16(8):1653–1663
Chapelon C, Ziza JM, Piette JC et al (1990) Neurosarcoidosis: signs,
course and treatment in 35 confirmed cases. Medicine 69:261–276
Dastur DK, Manghani DK, Udani PM (1995) Pathology and patho-
genetic mechanisms in neurotuberculosis. Radiol Clin N Am
33:733–752
Del Brutto OH (2012) Neurocysticercosis: a review. Scientific World
J. 2012:159821
Del Brutto OH, Santibanez R, Noboa CA et al (1992) Epilepsy due to
neurocysticercosis: analysis of 203 patients. Neurology
42:389–392
Dye C, Scheele S, Dolin P, Pathania V, Raviglione MC (1999)
Consensus statement. Global burden of tuberculosis: estimated
incidence, prevalence, and mortality by country. WHO Global
Surveillance and Monitoring Project. JAMA 282:677–686
Hall CB, Long CE, Schnabel KC et al (1994) Human herpesvirus-6
infection in children. A prospective study of complications and
reactivation. N Engl J Med 331:432–438
Kim MA, Park KM, Kim SE, Oh MK (2008) Acute symptomatic
seizures in CNS infection. Eur J Neurol 15(1):38–41
Krumholz A, Stern BJ, Stern EG (1991) Clinical implications of
seizures in neurosarcoidosis. Arch Neurol 48:842–844
Lannuzzi M, Rybicki B, Tierstein A (2007) Sarcoidosis. New Engl J
Med 357:2153–2165
Mirfakhraee M, Crofford MJ, Guinto FC Jr et al (1986) Virchow–
Robin space: a path of spread in neurosarcoidosis. Radiology
158(3):715–720
Murakami A, Morimoto M, Adachi S et al (2005) Infantile bilateral
striatal necrosis associated with human herpes virus-6 (HHV-6)
infection. Brain Dev 27:527–530
Murthy JM, Jayalaxmi SS, Kanikannan MA (2007) Convulsive status
epilepticus: clinical profile in a developing country. Epilepsia
48:2217–2223
Narayanan JT, Murthy JM (2007a) Nonconvulsive status epilepticus in
a neurological intensive care unit: profile in a developing country.
Epilepsia 48:900–906
Narayanan JT, Murthy JM (2007b) New onset acute symptomatic
seizures in neurological intensive care unit. Neurol India
55:136–140
Neto EC, Rubin R, Schulte J, Giugliani R (2004) Newborn screening
for congenital infectious diseases. Emerg Infect Dis 10:1068–1073
Osborn AG, Salzman KL, Barkovich AJ (eds) (2010) Diagnostic
imaging. Brain Amirsys Inc, Salt Lake City
Pawate S, Moses H, Sriram S (2009) Presentations and outcomes of
neurosarcoidosis: a study of 54 cases. QJM 102(7):449–460
Penido Nde O, Borin A, Iha LC, et al (2005) Intracranial complications
of otitis media: 15 years of experience in 33 patients. Otolaryngol
Head Neck Surg 132(1):37–42 (Review)
Pickering LK (ed) (2006) Red book: report of the Committee on
infectious diseases. American Academy of Pediatrics, Elk Grove
Village, pp 361–371
WHO Report (2009) Global tuberculosis control: epidemiology,
strategy, financing (publication No. WHO/HMT/TB/2009.411).
World Health Organization, Geneva
Rowley AH, Whitley RJ, Lakeman FD et al (1990) Rapid detection of
herpes-simplex-virus DNA in cerebrospinal fluid of patients with
herpes simplex encephalitis. Lancet 335:440–441
Rybicki BA, Iannuzzi MC (2007) Epidemiology of sarcoidosis: recent
advances and future prospects. Semin Respir Crit Care Med
28:22–35
Sellner J, Trinka E (2012) Clinical characteristics, risk factors and pre-
surgical evaluation of post-infectious epilepsy. Eur J Neurol. doi:
10.1111/j.1468-1331.2012.03842.x [Epub ahead of print]
Singh N, Paterson DL (2000) Encephalitis caused by human erpes-
virus-6 in transplant recipients: relevance of a novel neurotropic
virus. Transplantation 69:2474–2479
Smith JK, Matheus MG (2004) Castillo M imaging manifestations of
neurosarcoidosis. AJR Am J Roentgenol 182:289–295
Smith AS, Meisler DM, Weinstein MA, et al (1989) High-signal
periventricular lesions in patients with sarcoidosis: neurosarcoid-
osis or multiple sclerosis? AJR Am J Roentgenol 153(1):147–152
Tien RD, Felsberg GJ, Osumi AK (1993) Herpesvirus infections of the
CNS: MR findings. AJR Am J Roentgenol 161:167–176
Trincado DE, Rawlinson WD (2001) Congenital and perinatal
infections with cytomegalovirus. J Paediatr Child Health
37:187–192
Udani PM, Parekh UC, Dastur DK (1971) Neurological and related
syndromes in CNS tuberculous meningitis: clinical features and
pathogenesis. J Neurol Sci 14:341–357
Urbach H, Kristof R, Zentner J et al (1997) Sarcoidosis presenting as
an intra- or extra-axial cranial mass: report of two cases.
Neuroradiology 39(7):516–519
Villagran-Uribe J, Olvera-Rabiela JE (1988) Cisticercosis humana: e
studio clinico y patologico de 481 casos de autopsia. Pathologia
26:149–156 [in Spanish]
Wainwright MS, Martin PL, Morse RP et al (2001) Human herpesvirus
6 limbic encephalitis after stem cell transplantation. Ann Neurol
50:612–619
218 H. Urbach](https://image.slidesharecdn.com/epilepsymri-140818120139-phpapp02/85/Epilepsy-mri-218-320.jpg)
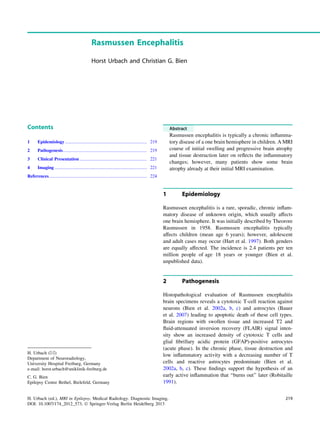
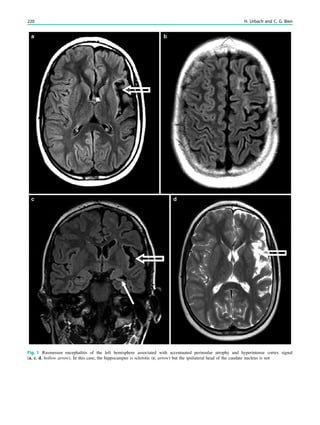
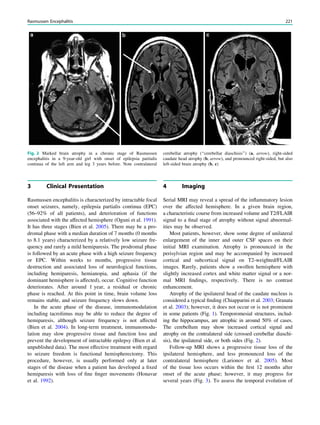
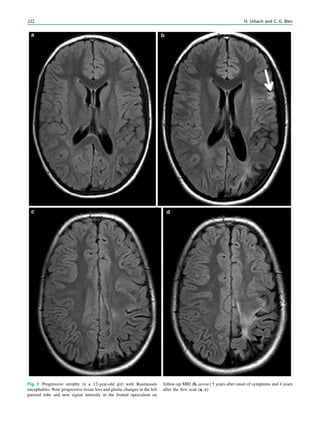
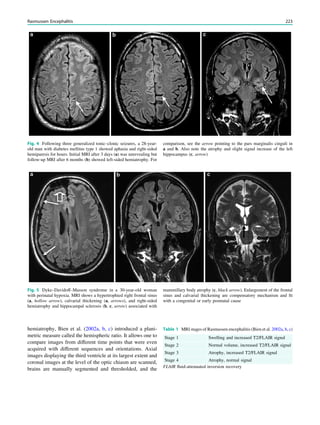
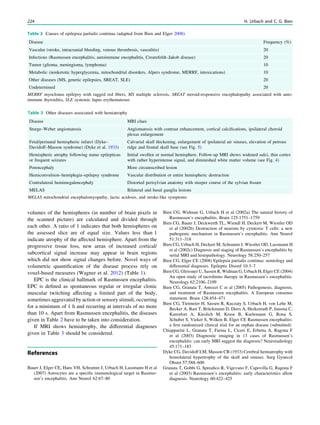

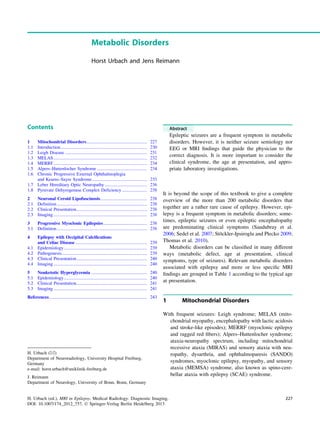
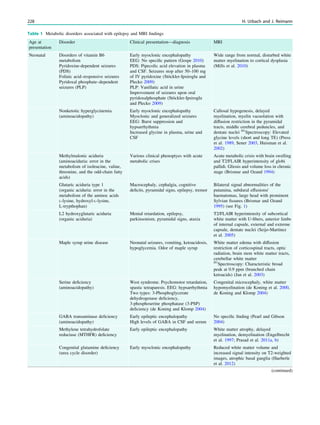
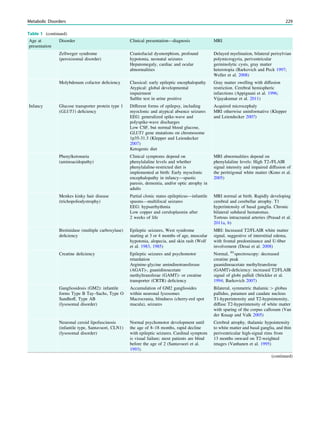
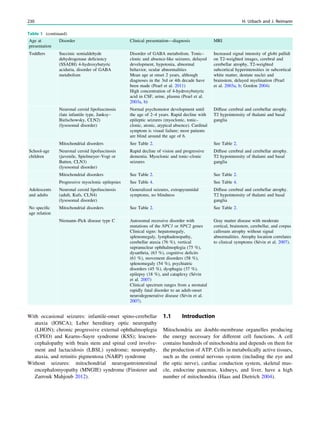
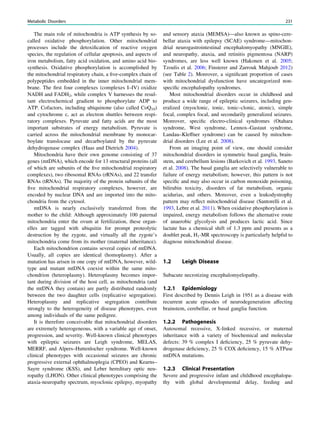
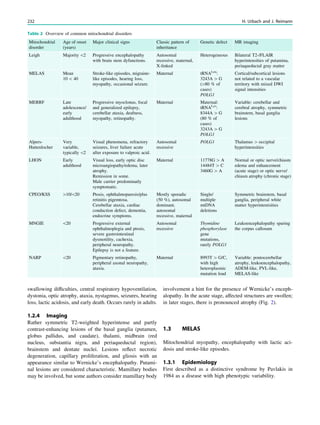
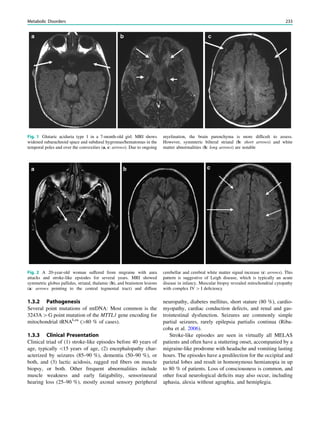
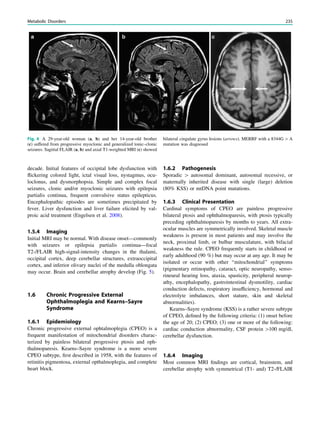
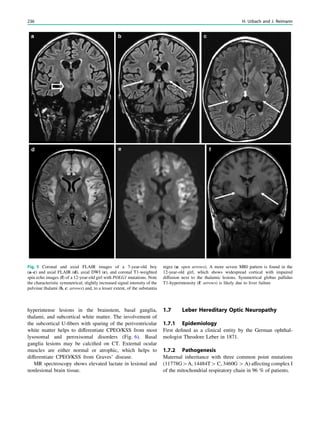
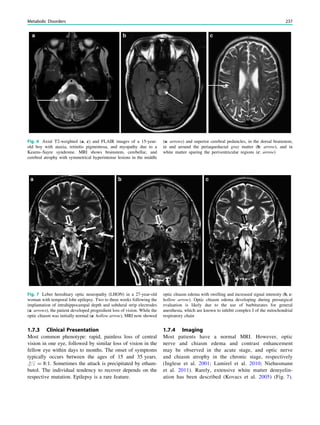
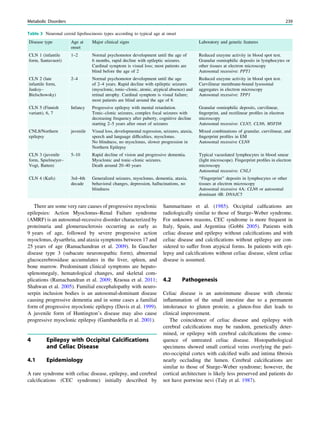
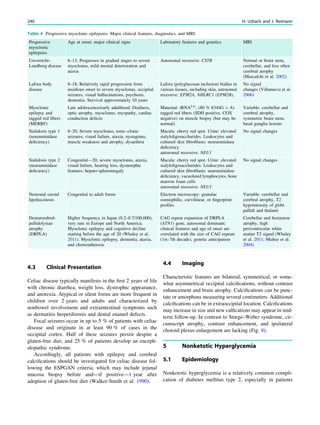
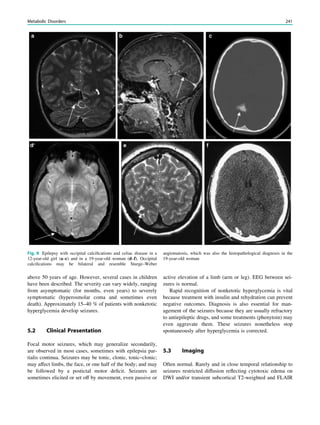
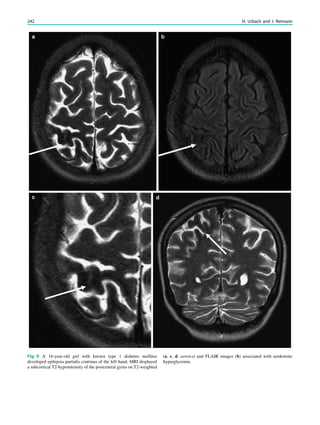
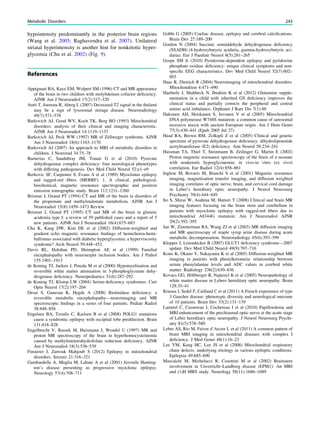
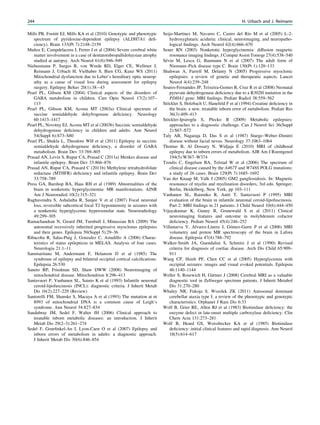
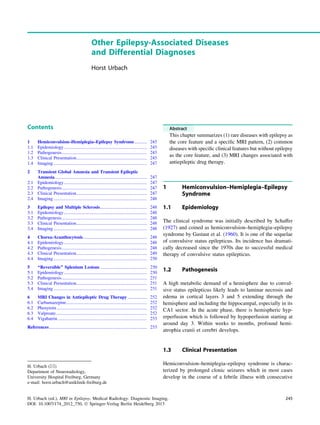
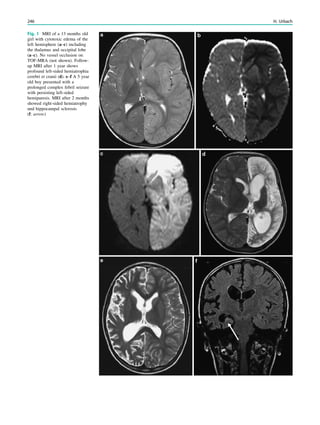
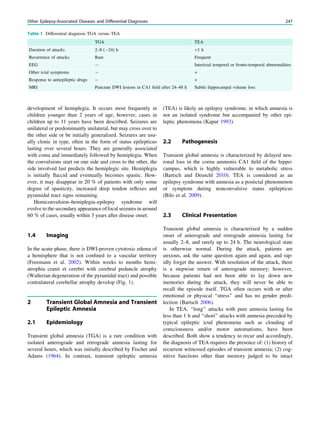
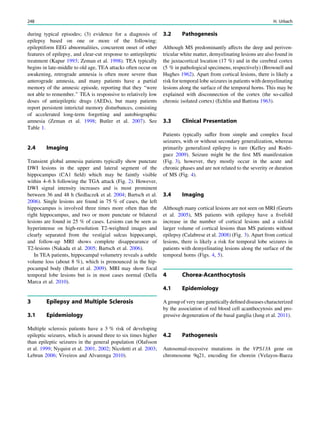
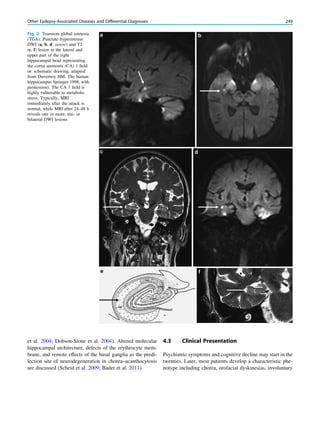
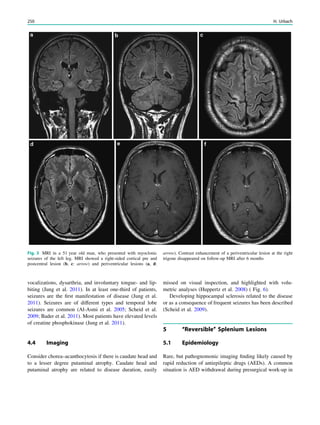
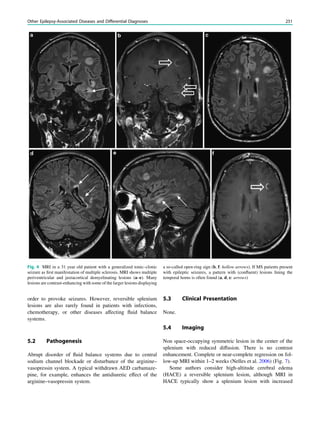
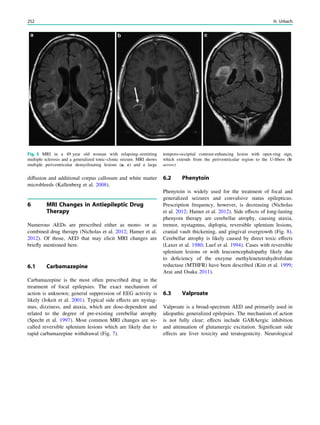
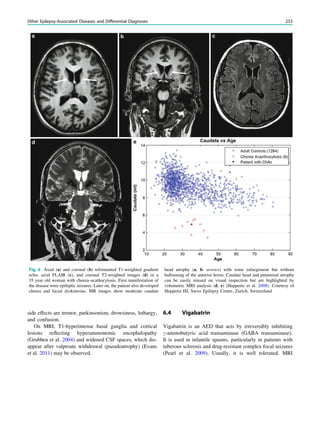
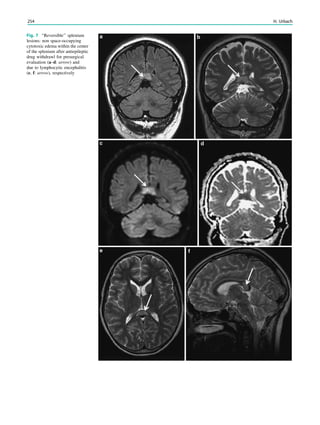
![changes have occasionally been described and consist of
bilateral symmetric lesions with usually reversible cytotoxic
edema in the thalami, tegementum of the midbrain, globi
pallidi, and dentate nuclei. Despite these changes, patients are
usually asymptomatic (Iyer et al. 2011; Simao et al. 2011;
Pearl et al. 2009).
No specific MRI changes have been described for the
newer AED including Levetiracetam, Lamotrigine, Topir-
amate, and Gabapentin.
References
Al-Asmi A, Jansen AC, Badhwar A et al (2005) Familial temporal
lobe epilepsy as a presenting feature of choreoacanthocytosis.
Epilepsia 46:1256–1263
Arai M, Osaka H (2011) Acute leukoencephalopathy possibly induced
by phenytoin intoxication in an adult patient with methylenete-
trahydrofolate reductase deficiency. Epilepsia 52:e58–e61
Bader B, Vollmar C, Ackl N, Ebert A, la Fougere C, Noachtar S,
Danek A (2011) Bilateral temporal lobe epilepsy confirmed with
intracranial EEG electrodes in chorea–acanthocytosis. Seizure
20:340–342
Bartsch T, Deuschl G (2010) Transient global amnesia: functional
anatomy and clinical implications. Lancet Neurol 9(2):205–214
Bartsch T, Alfke K, Stingele R, Rohr A, Freitag-Wolf S, Jansen O,
Deuschl G (2006) Selective affection of hippocampal CA-1
neurons in patients with transient global amnesia without long-
term sequelae. Brain 129(Pt 11):2874–2884
Bilo L, Meo R, Ruosi P, de Leva MF, Striano S (2009) Transient
epileptic amnesia: an emerging late-onset epileptic syndrome.
Epilepsia 50(Suppl 5):58–61
Brownell B, Hughes JT (1962) The distribution of plaques in the
cerebrum in multiple sclerosis. J Neurol Neurosurg Psychiatry
25:315–320
Butler CR, Graham KS, Hodges JR, Kapur N, Wardlaw JM, Zeman
AZ (2007) The syndrome of transient epileptic amnesia. Ann
Neurol 61:587–598
Butler CR, Bhaduri A, Acosta-Cabronero J, Nestor PJ, Kapur N,
Graham KS, Hodges JR, Zeman AZ (2009) Transient epileptic
amnesia: regional brain atrophy and its relationship to memory
deficits. Brain 132(Pt 2):357–368
Calabrese M, De Stefano N, Atzori M et al (2008) Extensive cortical
inflammation is associated with epilepsy in multiple sclerosis.
J Neurol 255(4):581–586
Della Marca G, Dittoni S, Pilato F, Profice P, Losurdo A, Testani
E. Colicchio S, Gnoni V, Colosimo C, Di Lazzaro V (2010) Teaching
neuroimages: transient epileptic amnesia. Neurology 75(10):e47–e48
Dobson-Stone C, Velayos-Baeza A, Filippone LA et al (2004) Chorein
detection for the diagnosis of chorea–acanthocytosis. Ann Neurol
56:299–302
Echlin F, Battista J (1963) Epileptiform seizures from chronic isolated
cortex. Arch Neurol 9:154–170
Evans MD, Shinar R, Yaari R (2011) Reversible dementia and gait
disturbance after prolonged use of valproic acid. Seizure
20(6):509–511
Fisher CM, Adams RD (1964) Transient global amnesia. Acta Neurol
Scand 40:1–83
Freemann JL, Coleman LT, Smith LJ, Shield LK (2002) Hemicon-
vulsion–hemiplegia–epilepsy syndrome: characteristic early mag-
netic resonance imaging findings. J Child Neurol 17:10–16
Gastaut H, Poirier F, Payan H, Salamon G, Toga M, Vigoroux M
(1960) H.H.E. syndrome; hemiconvulsions, hemiplegia, epilepsy.
Epilepsia 1:418
Geurts JJ, Bo L, Pouwels PJ et al (2005) Cortical lesions in multiple
sclerosis: combined postmortem MR imaging and histopathology.
AJNR 26:572–577
Grubben B, De Jonghe P, Cras P, Demey HE, Parizel PM (2004)
Valproate-induced hyperammonemic encephalopathy: imaging
findings on diffusion-weighted MRI. Eur Neurol 52(3):178–181
Hamer HM, Dodel R, Strzelczyk A, Balzer-Geldsetzer M, Reese JP,
Schöffski O, Graf W, Schwab S, Knake S, Oertel WH, Rosenow F,
Kostev K (2012) Prevalence, utilization, and costs of antiepileptic
drugs for epilepsy in Germany—a nationwide population-based
study in children and adults. J Neurol 2012 Apr 28 [Epub ahead
of print]
Huppertz HJ, Kröll-Seger J, Danek A, Weber B, Dorn T, Kassubek J
(2008) Automatic striatal volumetry allows for identification of
patients with chorea–acanthocytosis at single subject level. J Neural
Transm 115:1393–1400
Fig. 8 Sequelae of long-lasting phenytoin therapy in a 38 year old
woman who presented with epileptic seizures 22 years ago and was
taking phenytoin since this time. Marked cerebellar atrophy (b, c:
arrows) and distinct cranial vault thickening (a, b: hollow arrows) are
distinct imaging features
Other Epilepsy-Associated Diseases and Differential Diagnoses 255](https://image.slidesharecdn.com/epilepsymri-140818120139-phpapp02/85/Epilepsy-mri-254-320.jpg)
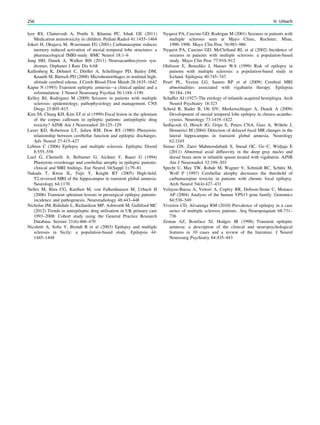
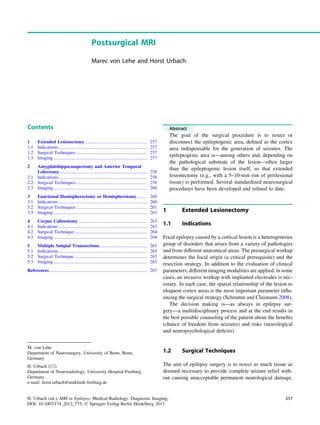
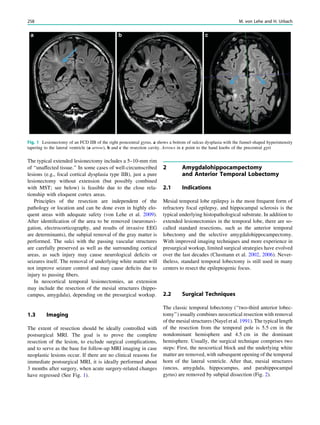
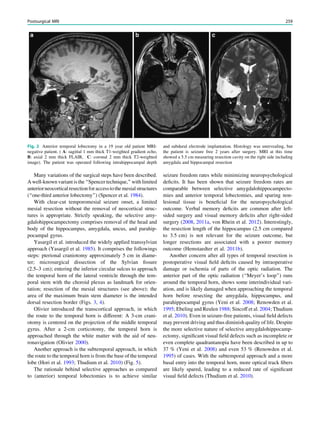
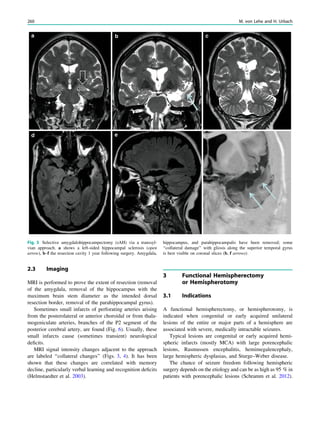
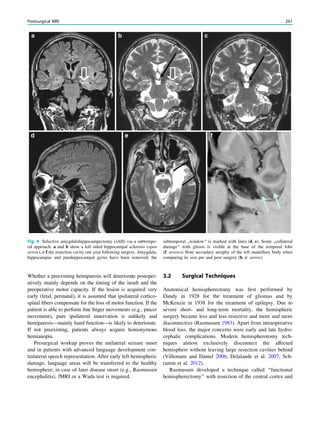
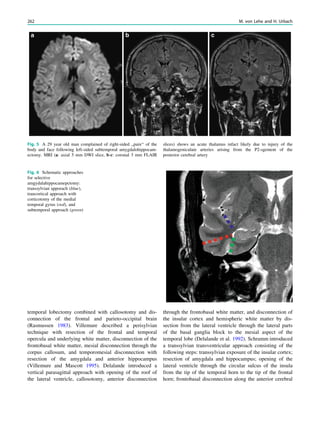
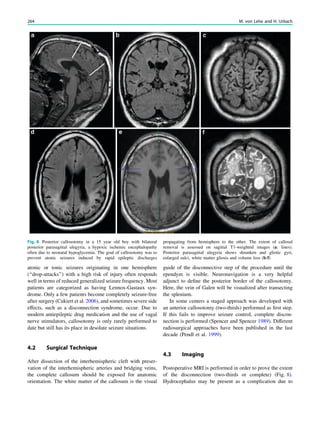
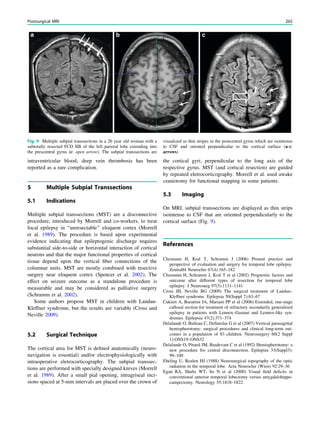
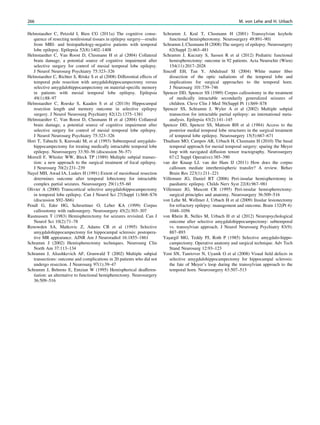
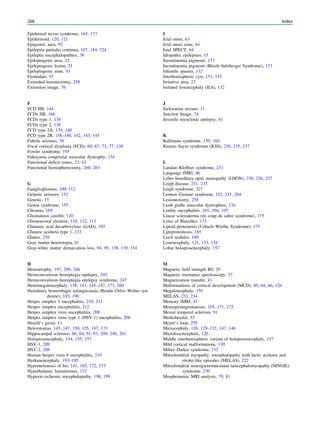
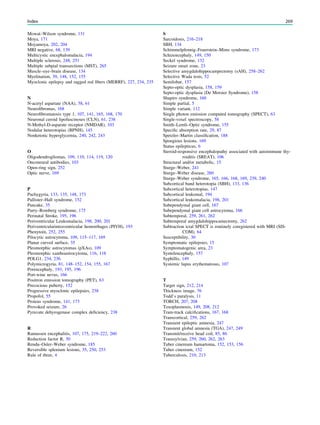
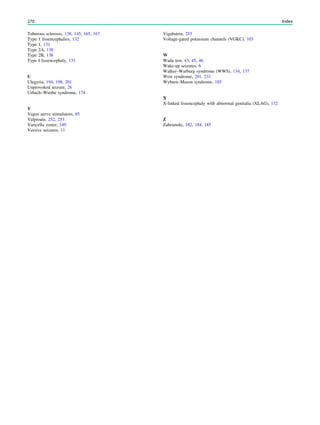

This chapter defines an epileptic seizure as transient abnormal neuronal activity in the brain. Around 5% of people experience seizures in their lifetime, with incidence highest in infants and elderly adults. Epilepsy is defined as recurrent seizures and the consequences of this condition. A diagnosis of epilepsy can be made after one seizure if EEG or MRI findings indicate increased epileptogenicity. Drug-resistant epilepsy persists despite adequate treatment with two tolerated anti-seizure medications. Seizure freedom requires being seizure-free for at least one year while on medication.


![Imaging in Neurovascular conflicts [Neurovascular compression syndrome ]](https://cdn.slidesharecdn.com/ss_thumbnails/cnv-141013092247-conversion-gate01-thumbnail.jpg?width=640&height=640&fit=bounds)


![Pediatric neurology, a color handbook bale jr., james f. [srg]](https://cdn.slidesharecdn.com/ss_thumbnails/pediatricneurologyacolorhandbook-balejr-150430011139-conversion-gate01-thumbnail.jpg?width=640&height=640&fit=bounds)


![Polymer [ बहुलक ] Chemistry Notes PDF - Irfanullah Mehar - JJ Sir Chemistry.pdf](https://cdn.slidesharecdn.com/ss_thumbnails/polymerchemistrynotespdf-irfanullahmehar-jjsirchemistry-260210172118-3f9b37f7-thumbnail.jpg?width=640&height=640&fit=bounds)


