1. Engineering Costs
•Definition: Engineering costs refer to the financial
expenditures involved in the design, development,
production, and maintenance of engineering projects. These
can include both direct and indirect costs.
• Importance: Understanding costs is essential for project
management, budgeting, and ensuring profitability.
3.
Types of EngineeringCosts
• Engineering costs can be broadly categorized into:
• Fixed Costs:
• Do not vary with production or service levels.
• Examples: rent for office space, salaries of permanent staff,
machinery, and equipment.
• Variable Costs:
• Change directly with the level of production or output.
• Examples: raw materials, energy costs, wages for hourly workers.
4.
• Direct Costs:Directly attributable to a specific project or product.
Examples: materials, labor, and equipment used for a specific project.
• Indirect Costs: Not directly tied to a specific project but essential for
overall operations. Examples: administrative expenses, utilities, and
security costs.
• Capital Costs (CAPEX): Costs related to the purchase of assets that
have a useful life longer than one year (e.g., machinery, buildings).
• Operational Costs (OPEX): Ongoing costs required to run the project
or production (e.g., labor, maintenance, materials).
• Life Cycle Costing: An approach that considers the total cost of a
project over its entire lifespan, from inception to disposal. This helps
in understanding not only initial costs but also long-term operational
and maintenance expenses.
5.
2. Cost Estimation
•Definition: Cost estimation is the process of predicting the
cost of a project, product, or service. In engineering, this is a
critical component for decision-making, budgeting, and
financial planning.
• Importance: Accurate cost estimation is essential for project
feasibility, funding, risk assessment, and staying within
budget constraints.
6.
Key Objectives ofCost Estimation
• Project Planning: Helps in determining the financial
requirements and the economic viability of a project.
• Budgeting: Assists in allocating appropriate financial
resources.
• Bidding & Contracting: Used in competitive bidding
processes for contractors or clients.
• Cost Control: Provides a baseline to compare actual project
costs during execution.
7.
Types of CostEstimates
• Cost estimates are classified based on the stage of the project and the level of
detail available:
• Preliminary Estimates:
• Rough approximations based on limited information, often used during the conceptual
phase.
• Examples: Feasibility studies or early-stage project evaluations.
• Accuracy: +/- 30% to 50%.
• Detailed Estimates:
• More precise estimates based on finalized designs, blueprints, and complete project
details.
• Used during the execution phase for budgeting and planning.
• Accuracy: +/- 5% to 15%.
8.
• Order-of-Magnitude Estimates:High-level estimates, typically made
early on, based on past experience or similar projects.
• Accuracy: +/- 50% to 100%.
• Definitive Estimates: Most detailed and accurate estimates used for
final budgeting and resource allocation.
• Accuracy: +/- 1% to 5%.
9.
Factors Affecting CostEstimates
• Several factors influence the accuracy of cost estimates in engineering
projects:
• Scope Definition: Clearly defined project scope reduces uncertainty
and increases estimate accuracy.
• Market Conditions: Fluctuations in prices for labor, materials, or
energy can significantly impact estimates.
• Project Complexity: More complex projects are harder to estimate
accurately due to potential unforeseen challenges.
• Geographical Location: Local labor rates, material availability, and
logistics costs can vary widely by region.
• Timeframe: Longer projects are more susceptible to inflation and
price changes over time.
10.
Cost Estimation Process
•The cost estimation process typically follows these steps:
• Define Scope: Clearly define the work to be done.
• Gather Data: Collect historical data, material prices, labor rates, and
design specifications.
• Select Estimation Method: Choose an appropriate estimation
technique based on the available data and project stage.
• Estimate Costs: Apply the method to calculate the estimated cost for
each component of the project.
• Apply Contingency: Add a contingency percentage to account for
uncertainties.
• Review & Refine: Cross-check the estimate with experts and historical
data, and refine if needed.
11.
Challenges in CostEstimation
• Cost estimation is prone to several challenges:
• Uncertainty: It’s difficult to predict exact costs, especially in
large or innovative projects.
• Inaccurate Data: Using outdated or incomplete data can
result in large cost overruns.
• Scope Creep: Changes in the project scope during execution
can lead to underestimated costs.
• Inflation and Market Changes: Rising costs for materials or
labour over time can disrupt initial estimates.
12.
•Common Estimation Methods:
•Analogous Estimating: Using historical data from
similar projects.
•Parametric Estimating: Using statistical relationships
between historical costs and other variables (e.g., size,
weight, square foot in construction).
13.
3. Benefit Estimation
•Definition: Benefit estimation refers to the process of
predicting and quantifying the positive outcomes or returns
from a project, product, or service. These benefits can be
tangible (e.g., financial gains) or intangible (e.g., improved
customer satisfaction, environmental impact).
• Importance: Benefit estimation is crucial for decision-making
in engineering projects, as it helps justify the project by
showing the expected returns relative to the costs.
14.
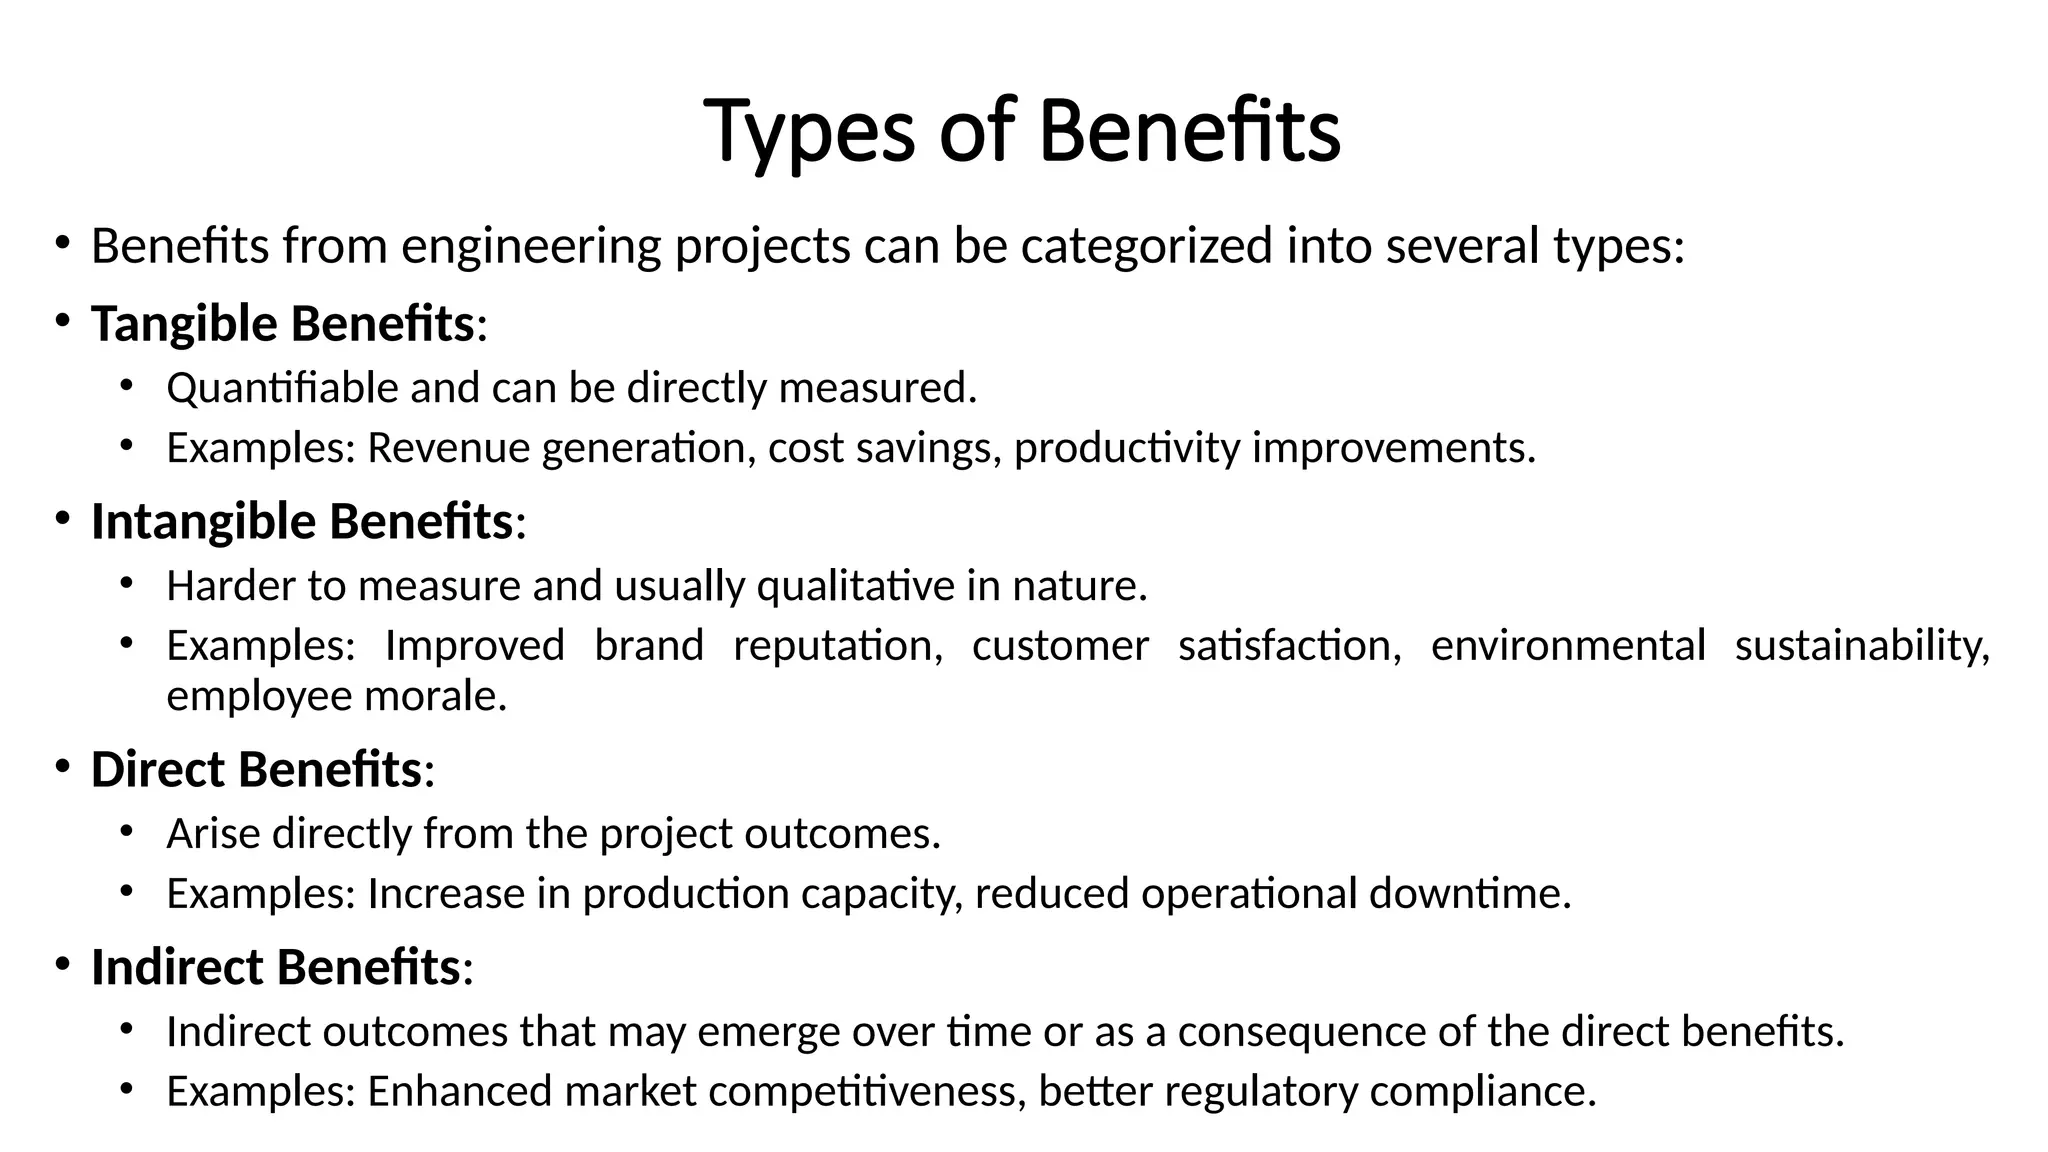
Types of Benefits
•Benefits from engineering projects can be categorized into several types:
• Tangible Benefits:
• Quantifiable and can be directly measured.
• Examples: Revenue generation, cost savings, productivity improvements.
• Intangible Benefits:
• Harder to measure and usually qualitative in nature.
• Examples: Improved brand reputation, customer satisfaction, environmental sustainability,
employee morale.
• Direct Benefits:
• Arise directly from the project outcomes.
• Examples: Increase in production capacity, reduced operational downtime.
• Indirect Benefits:
• Indirect outcomes that may emerge over time or as a consequence of the direct benefits.
• Examples: Enhanced market competitiveness, better regulatory compliance.
15.
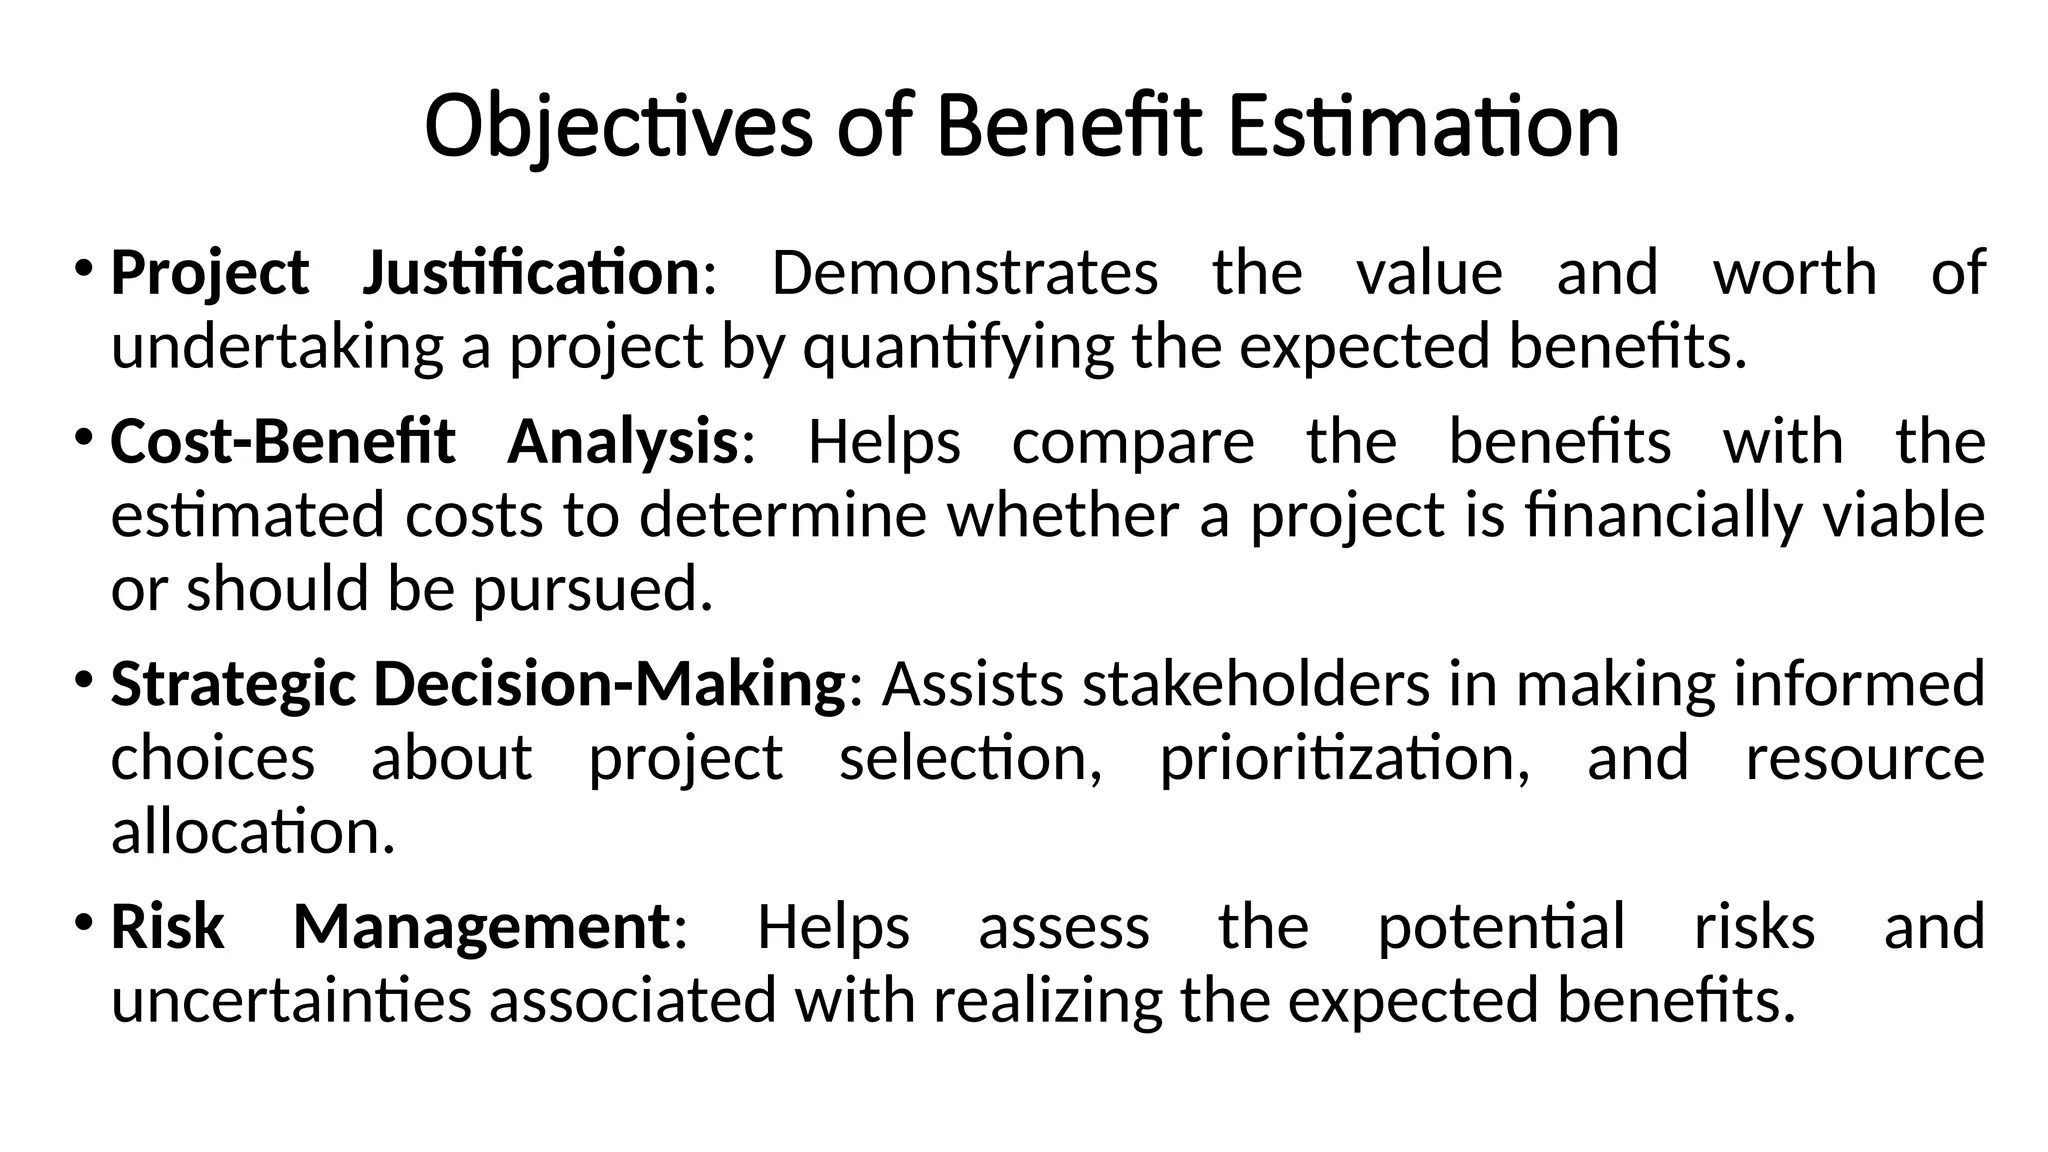
Objectives of BenefitEstimation
• Project Justification: Demonstrates the value and worth of
undertaking a project by quantifying the expected benefits.
• Cost-Benefit Analysis: Helps compare the benefits with the
estimated costs to determine whether a project is financially viable
or should be pursued.
• Strategic Decision-Making: Assists stakeholders in making informed
choices about project selection, prioritization, and resource
allocation.
• Risk Management: Helps assess the potential risks and
uncertainties associated with realizing the expected benefits.
16.
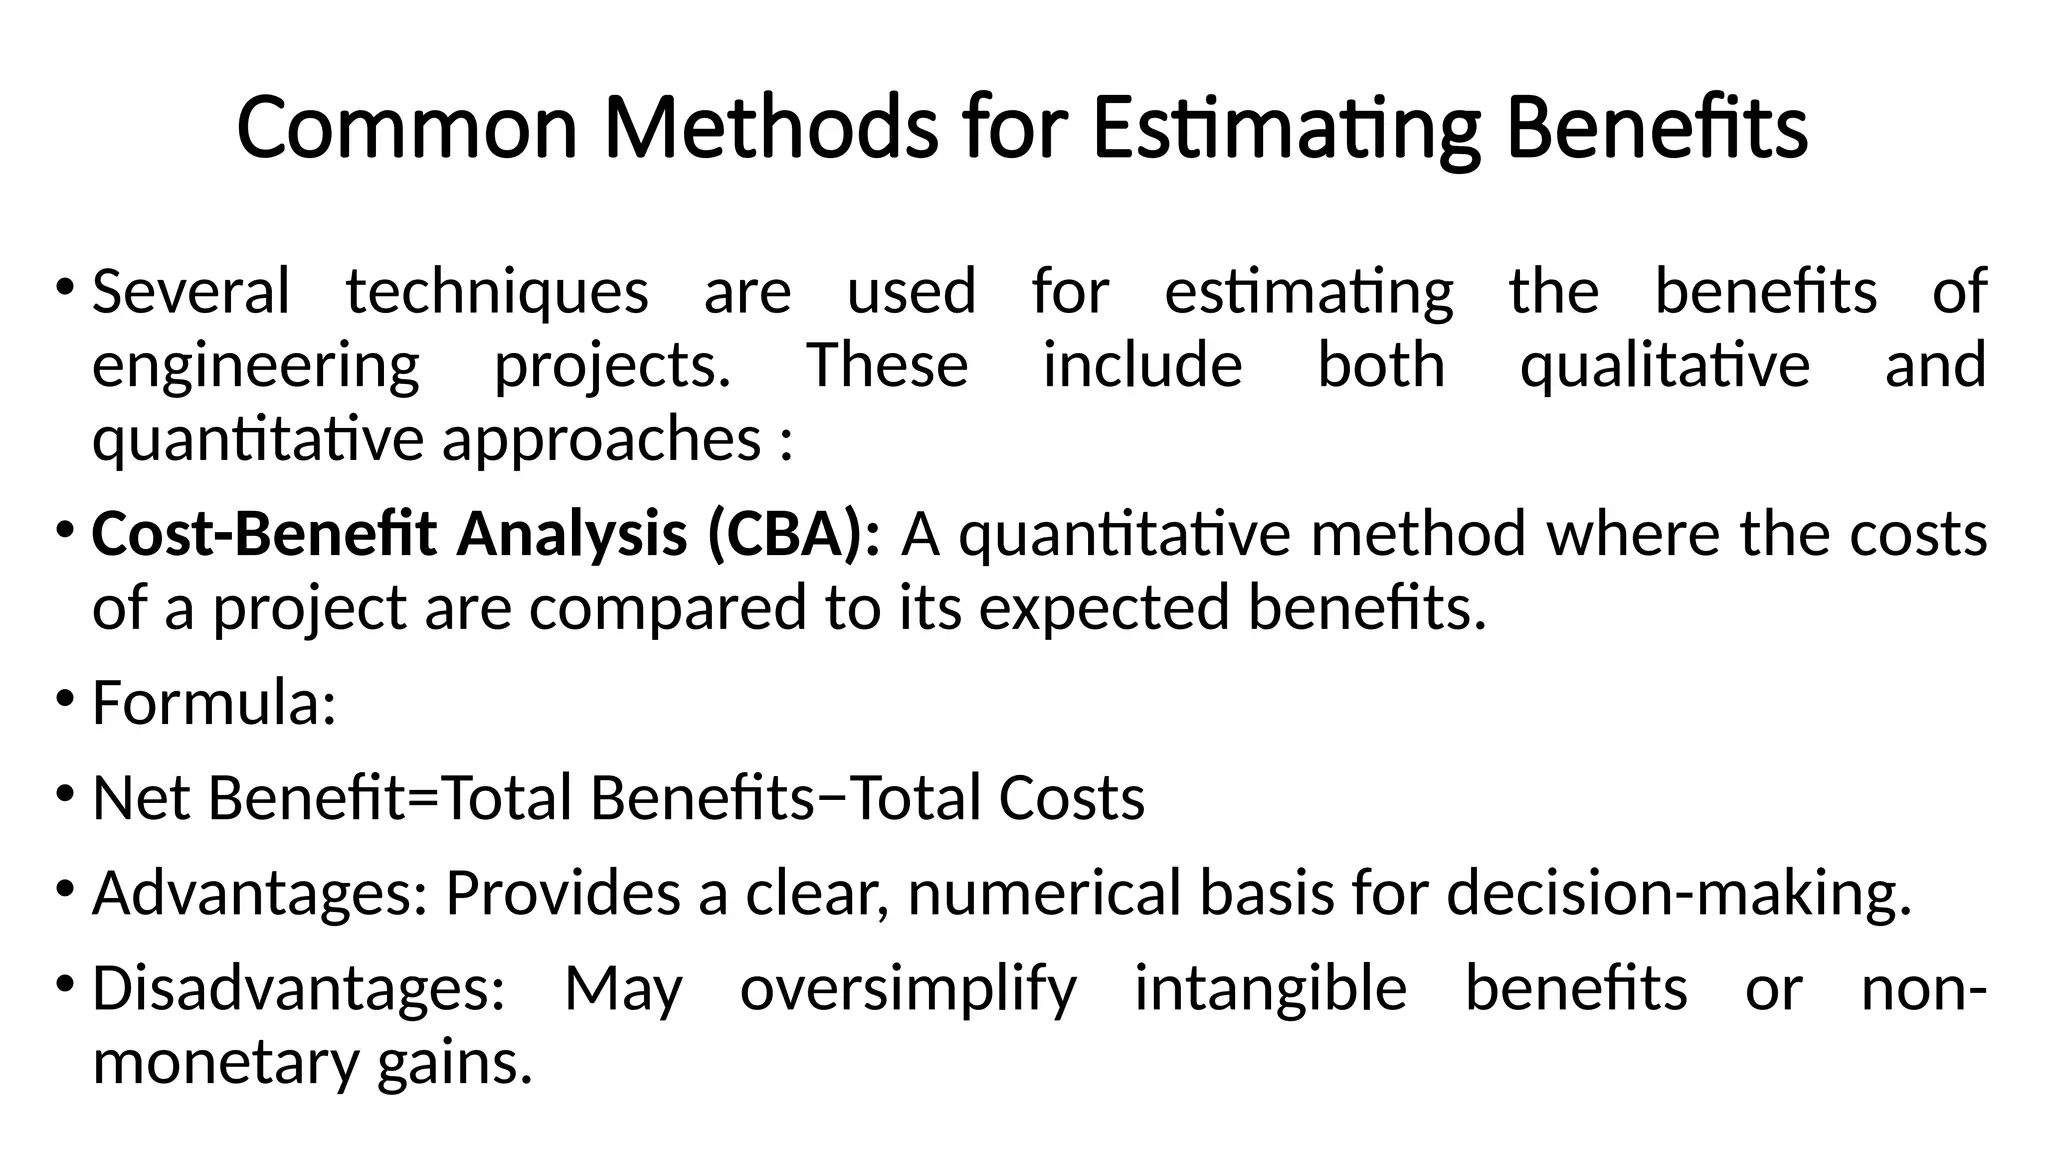
Common Methods forEstimating Benefits
• Several techniques are used for estimating the benefits of
engineering projects. These include both qualitative and
quantitative approaches :
• Cost-Benefit Analysis (CBA): A quantitative method where the costs
of a project are compared to its expected benefits.
• Formula:
• Net Benefit=Total Benefits−Total Costs
• Advantages: Provides a clear, numerical basis for decision-making.
• Disadvantages: May oversimplify intangible benefits or non-
monetary gains.
17.
Common Methods forEstimating Benefits
(Cont..)
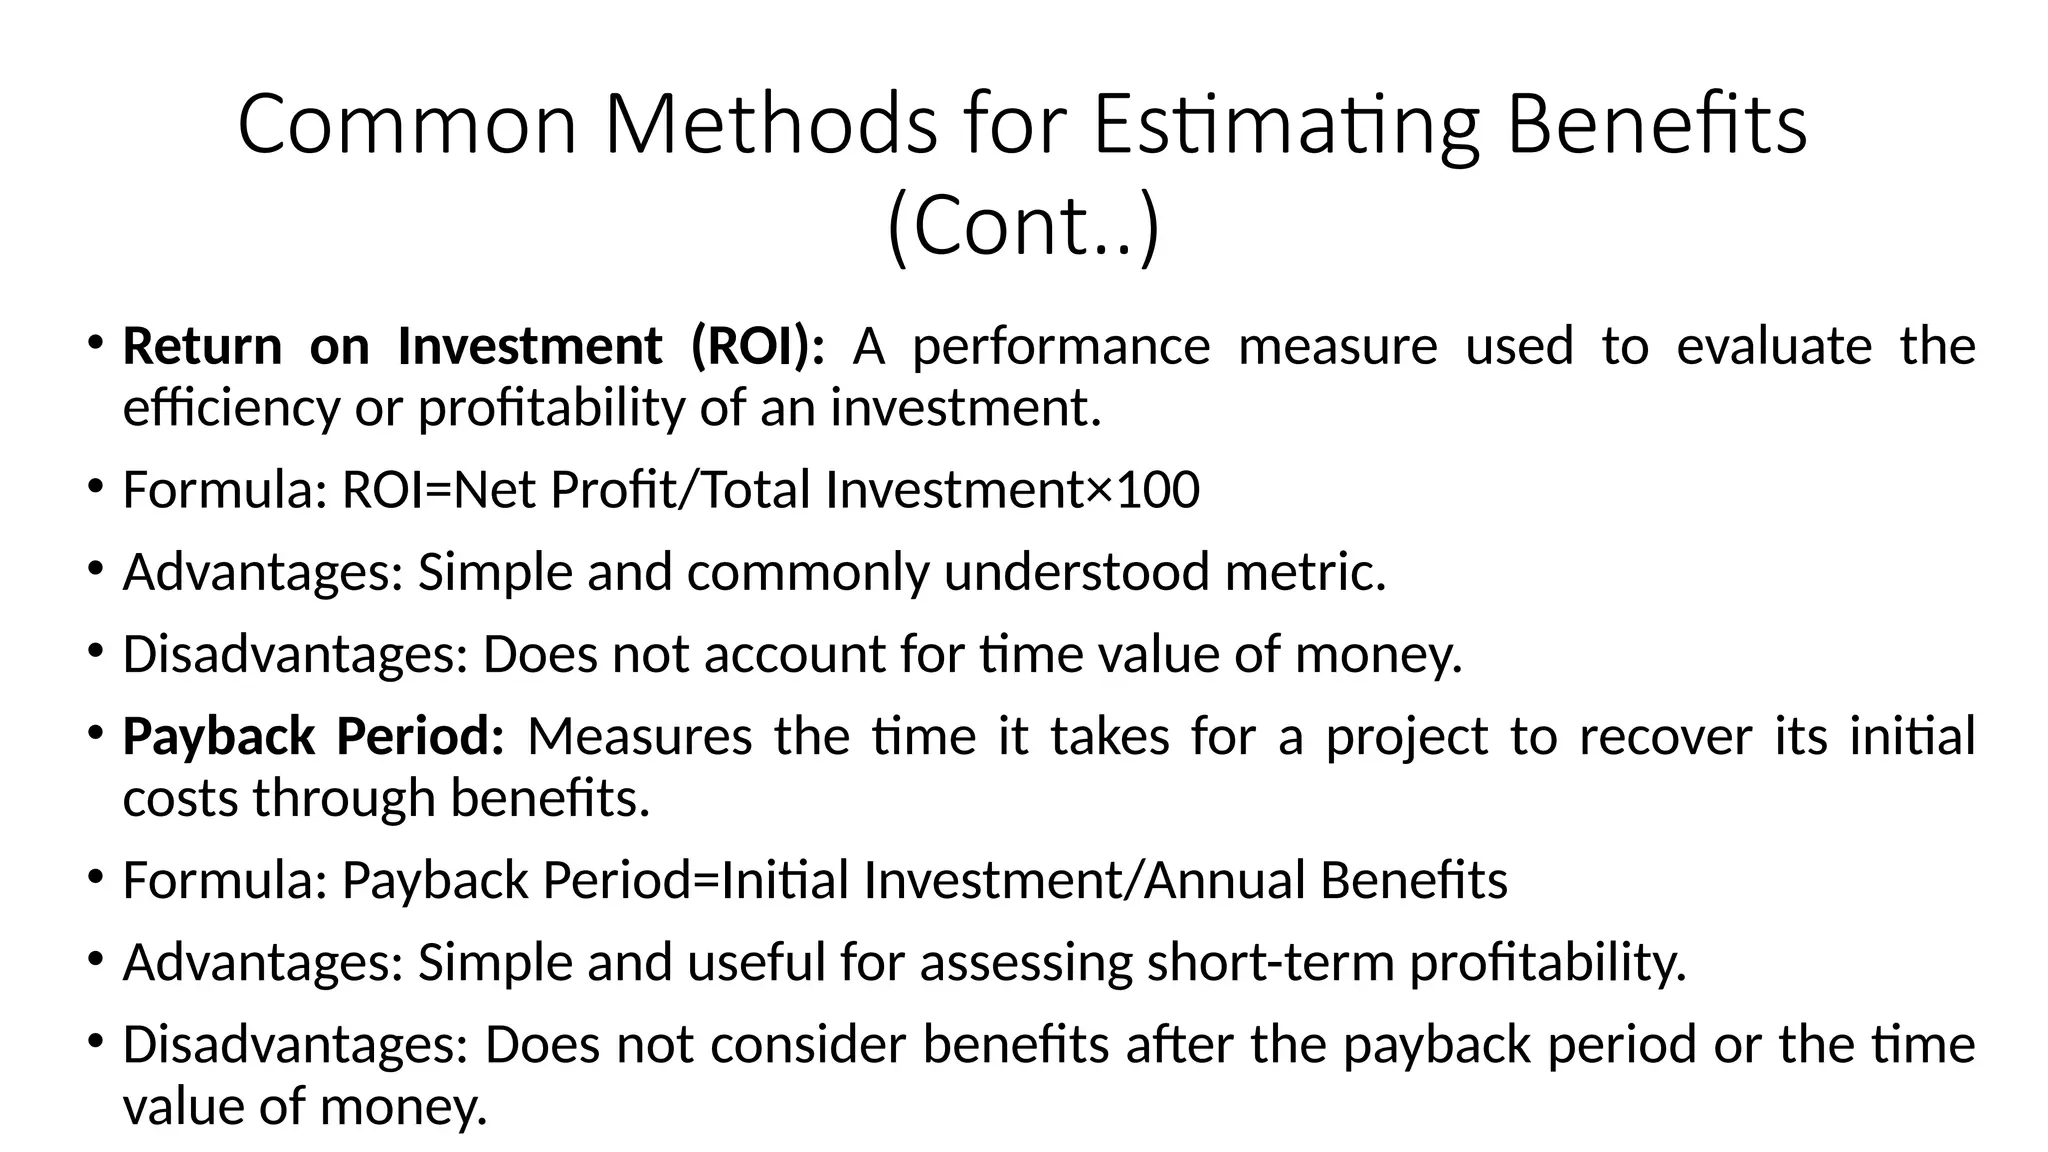
• Return on Investment (ROI): A performance measure used to evaluate the
efficiency or profitability of an investment.
• Formula: ROI=Net Profit/Total Investment×100
• Advantages: Simple and commonly understood metric.
• Disadvantages: Does not account for time value of money.
• Payback Period: Measures the time it takes for a project to recover its initial
costs through benefits.
• Formula: Payback Period=Initial Investment/Annual Benefits
• Advantages: Simple and useful for assessing short-term profitability.
• Disadvantages: Does not consider benefits after the payback period or the time
value of money.
18.
4. Cash FlowDiagram
• Definition: A cash flow diagram is a graphical representation
of cash inflows and outflows over a period of time. It visually
illustrates how money moves in and out of a project or
investment.
• Purpose: Cash flow diagrams are used to help engineers,
managers, and financial analysts understand the timing and
magnitude of costs (outflows) and revenues or savings
(inflows) associated with a project.
19.
Importance of CashFlow Diagrams
• Visual Aid: Helps to easily visualize when and how much
money will be spent or earned throughout the life of a
project.
• Decision-Making Tool: Assists in evaluating the feasibility of
projects, comparing alternative investments, and
understanding the financial impacts of project decisions.
• Basis for Financial Calculations: Provides the foundation for
more complex financial analyses, such as net present value
(NPV), internal rate of return (IRR), and payback period
calculations.
20.
Components of aCash Flow Diagram
• A cash flow diagram typically contains the following
elements:
• Time Axis: A horizontal line representing the time periods
(usually in years, months, or quarters) of the project or
investment. Each point along this axis represents a specific
time.
• Cash Inflows (Revenues or Savings): Represented by arrows
pointing upwards. These indicate money coming into the
project at specific times (e.g., revenues, cost savings).
21.
•Cash Outflows (Costsor Investments): Represented by
arrows pointing downwards. These indicate money
going out of the project at specific times (e.g., initial
investment, operating expenses).
•Magnitude of Cash Flows: The length of the arrows
represents the magnitude of the cash flow (how much
money is involved). Larger cash flows have longer
arrows.
•Time Periods: Time intervals are marked along the
time axis, indicating when the cash flows occur (e.g.,
year 1, year 2, etc.).
22.
Drawing a CashFlow Diagram
• To construct a cash flow diagram, follow these steps:
• Draw the Time Axis: Draw a horizontal line and label it with time
periods (0, 1, 2, 3…).
• Identify Cash Inflows: Draw upward arrows at the appropriate time
periods where inflows occur and label them with the corresponding
dollar amounts.
• Identify Cash Outflows: Draw downward arrows at the appropriate
time periods where outflows occur and label them with the
corresponding dollar amounts.
23.
• Magnitude ofArrows: Ensure the length of the arrows is
proportional to the size of the cash flows.
• Net Cash Flows: For each time period, you can calculate the
net cash flow (inflows – outflows) and show it on the
diagram if needed.
• Example of a Cash Flow Diagram
• Consider a project with the following cash flows:
• Initial investment of $100,000 at time 0 (cash outflow).
• Annual revenue of $30,000 for 5 years (cash inflows).
• Annual operating costs of $10,000 for 5 years (cash
outflows).
24.
• Steps todraw the cash flow diagram:
• Draw the time axis, marking 0, 1, 2, 3, 4, 5 (years).
• At time 0, draw a downward arrow of $100,000 to represent
the initial investment.
• At each of the years (1 to 5), draw an upward arrow of
$30,000 to represent the revenue.
• At each of the years (1 to 5), draw a downward arrow of
$10,000 to represent the operating costs.
• This will result in a series of alternating arrows—larger
upward arrows (for revenue) and smaller downward arrows
(for costs)—at each time period.
25.
Uses of CashFlow Diagrams
• Capital Budgeting: Cash flow diagrams are used to assess the
financial feasibility of capital projects (e.g., new equipment,
infrastructure projects).
• Investment Analysis: They help in visualizing the returns and
expenditures over the life of an investment.
• Loan and Mortgage Analysis: They are used to represent loan
repayments, interest payments, and savings.
• Project Feasibility: Cash flow diagrams help in comparing
alternative projects by representing the cash flows of each
alternative.
26.
Benefits of UsingCash Flow Diagrams
• Clarity: Cash flow diagrams provide a clear and
straightforward way to present financial data visually.
• Communication Tool: They serve as an effective tool to
communicate complex financial information to stakeholders,
particularly those who may not be financially trained.
• Foundation for Further Analysis: Cash flow diagrams simplify
the process of moving on to more advanced financial
calculations like NPV and IRR.
27.
• Conclusion
• Cashflow diagrams are a vital tool in engineering economics
and financial analysis.
• They provide a visual representation of cash inflows and
outflows over time, helping to evaluate project feasibility,
make informed decisions, and perform detailed financial
analysis.
• By mastering the construction and interpretation of cash
flow diagrams, engineers and project managers can better
plan, execute, and assess the financial impacts of their
projects.