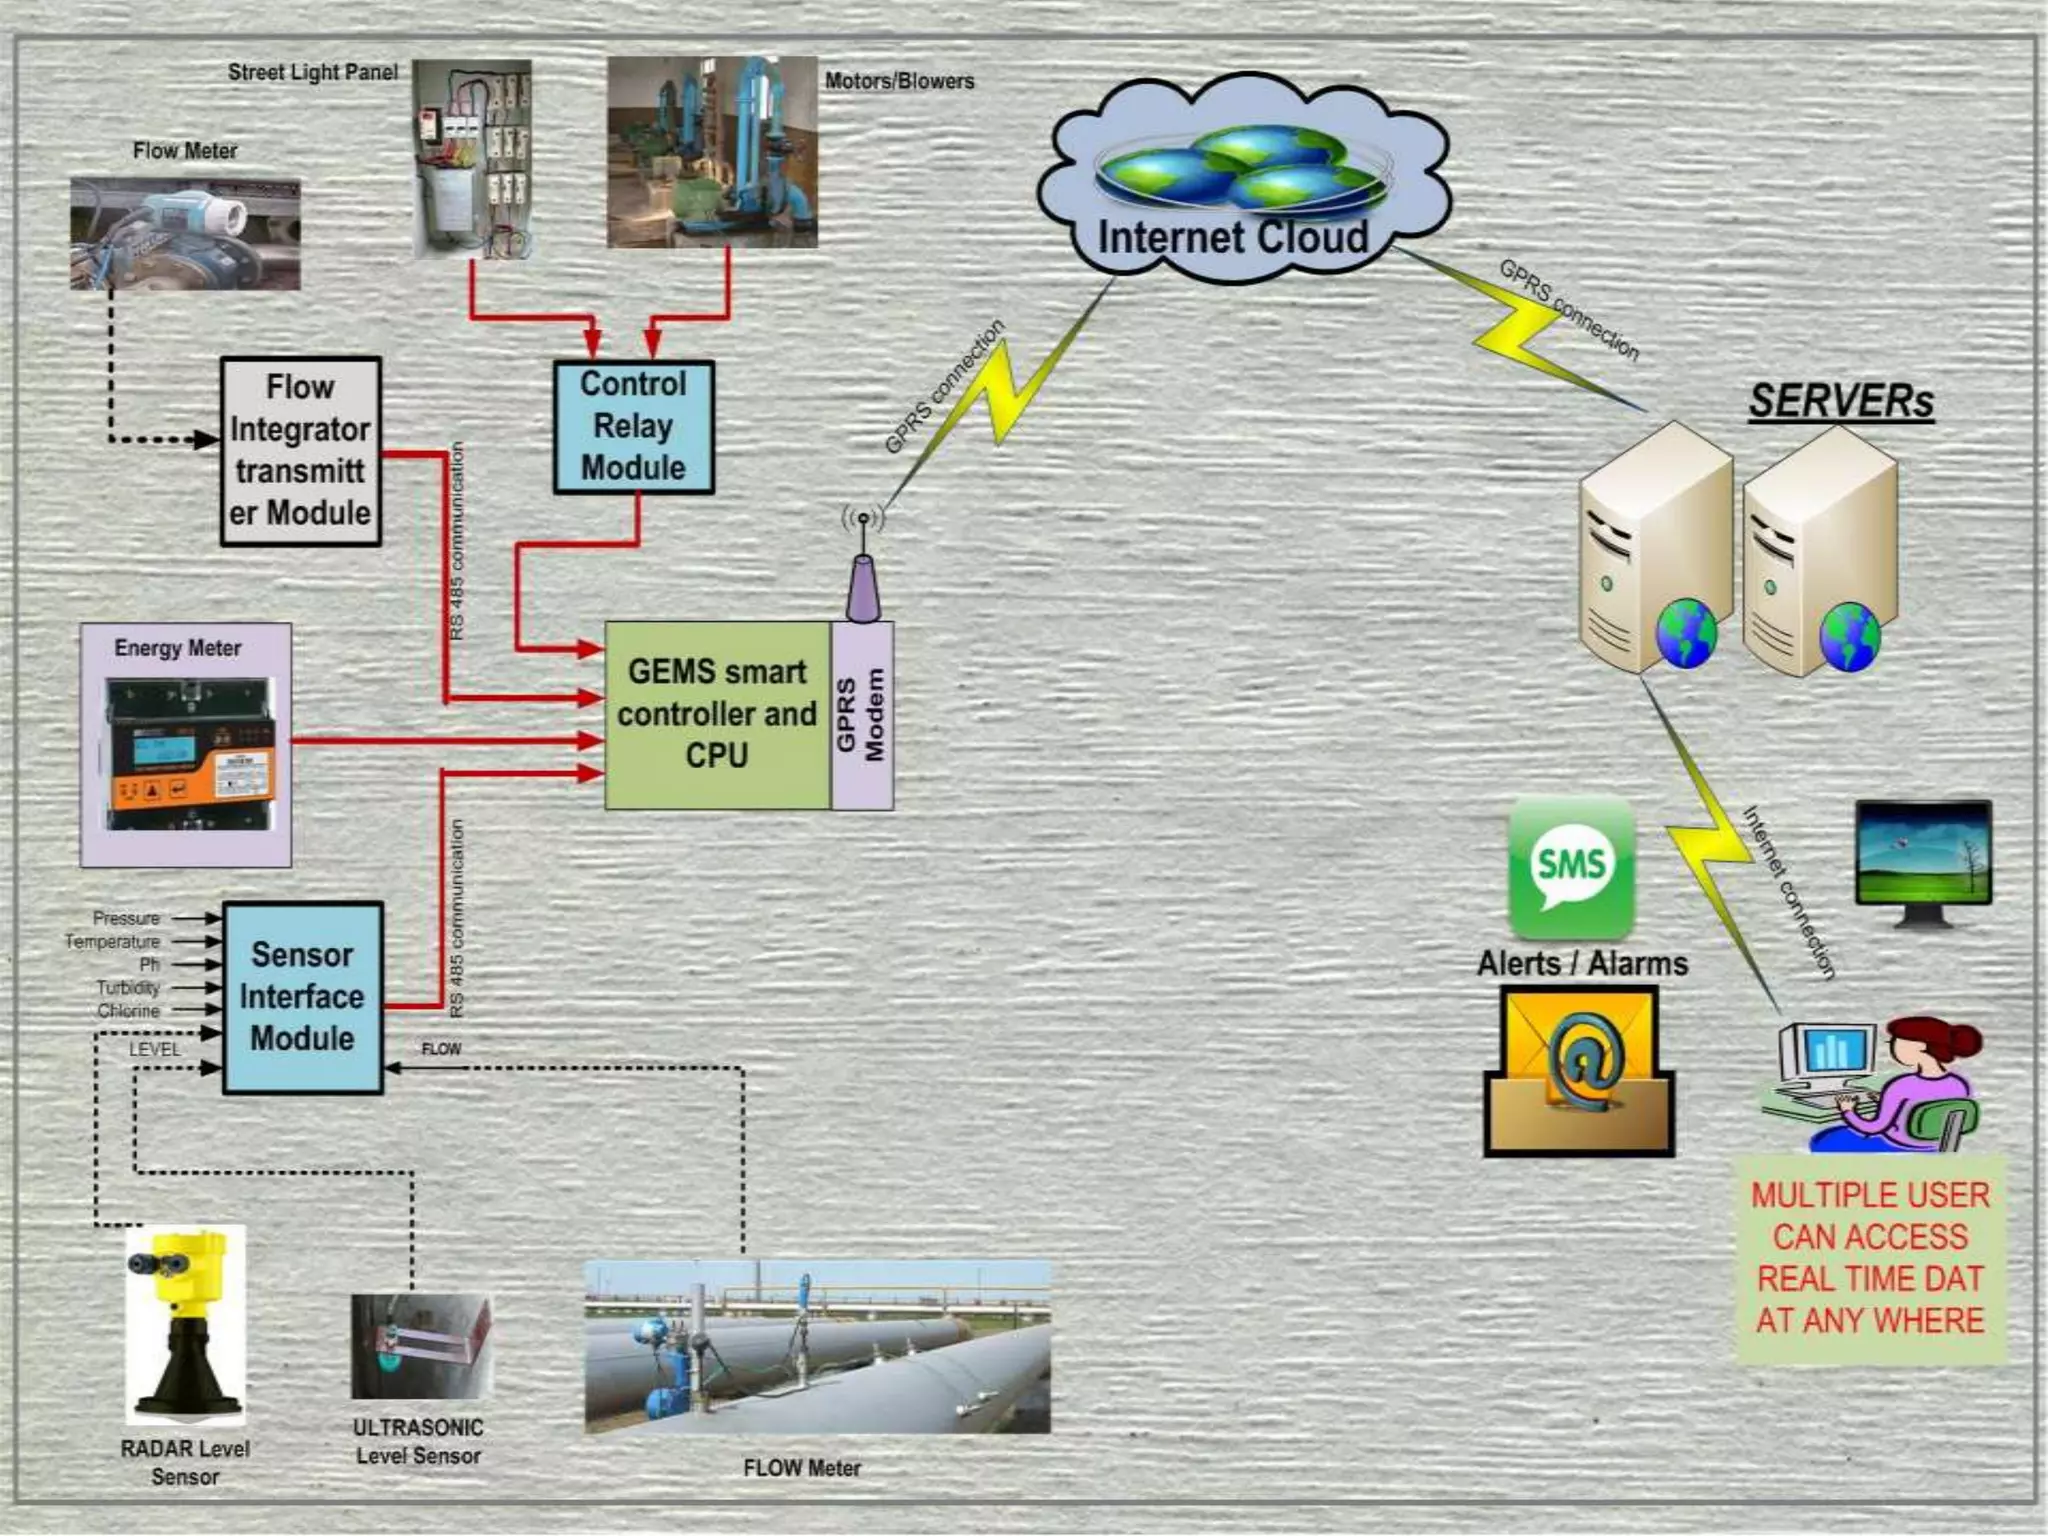
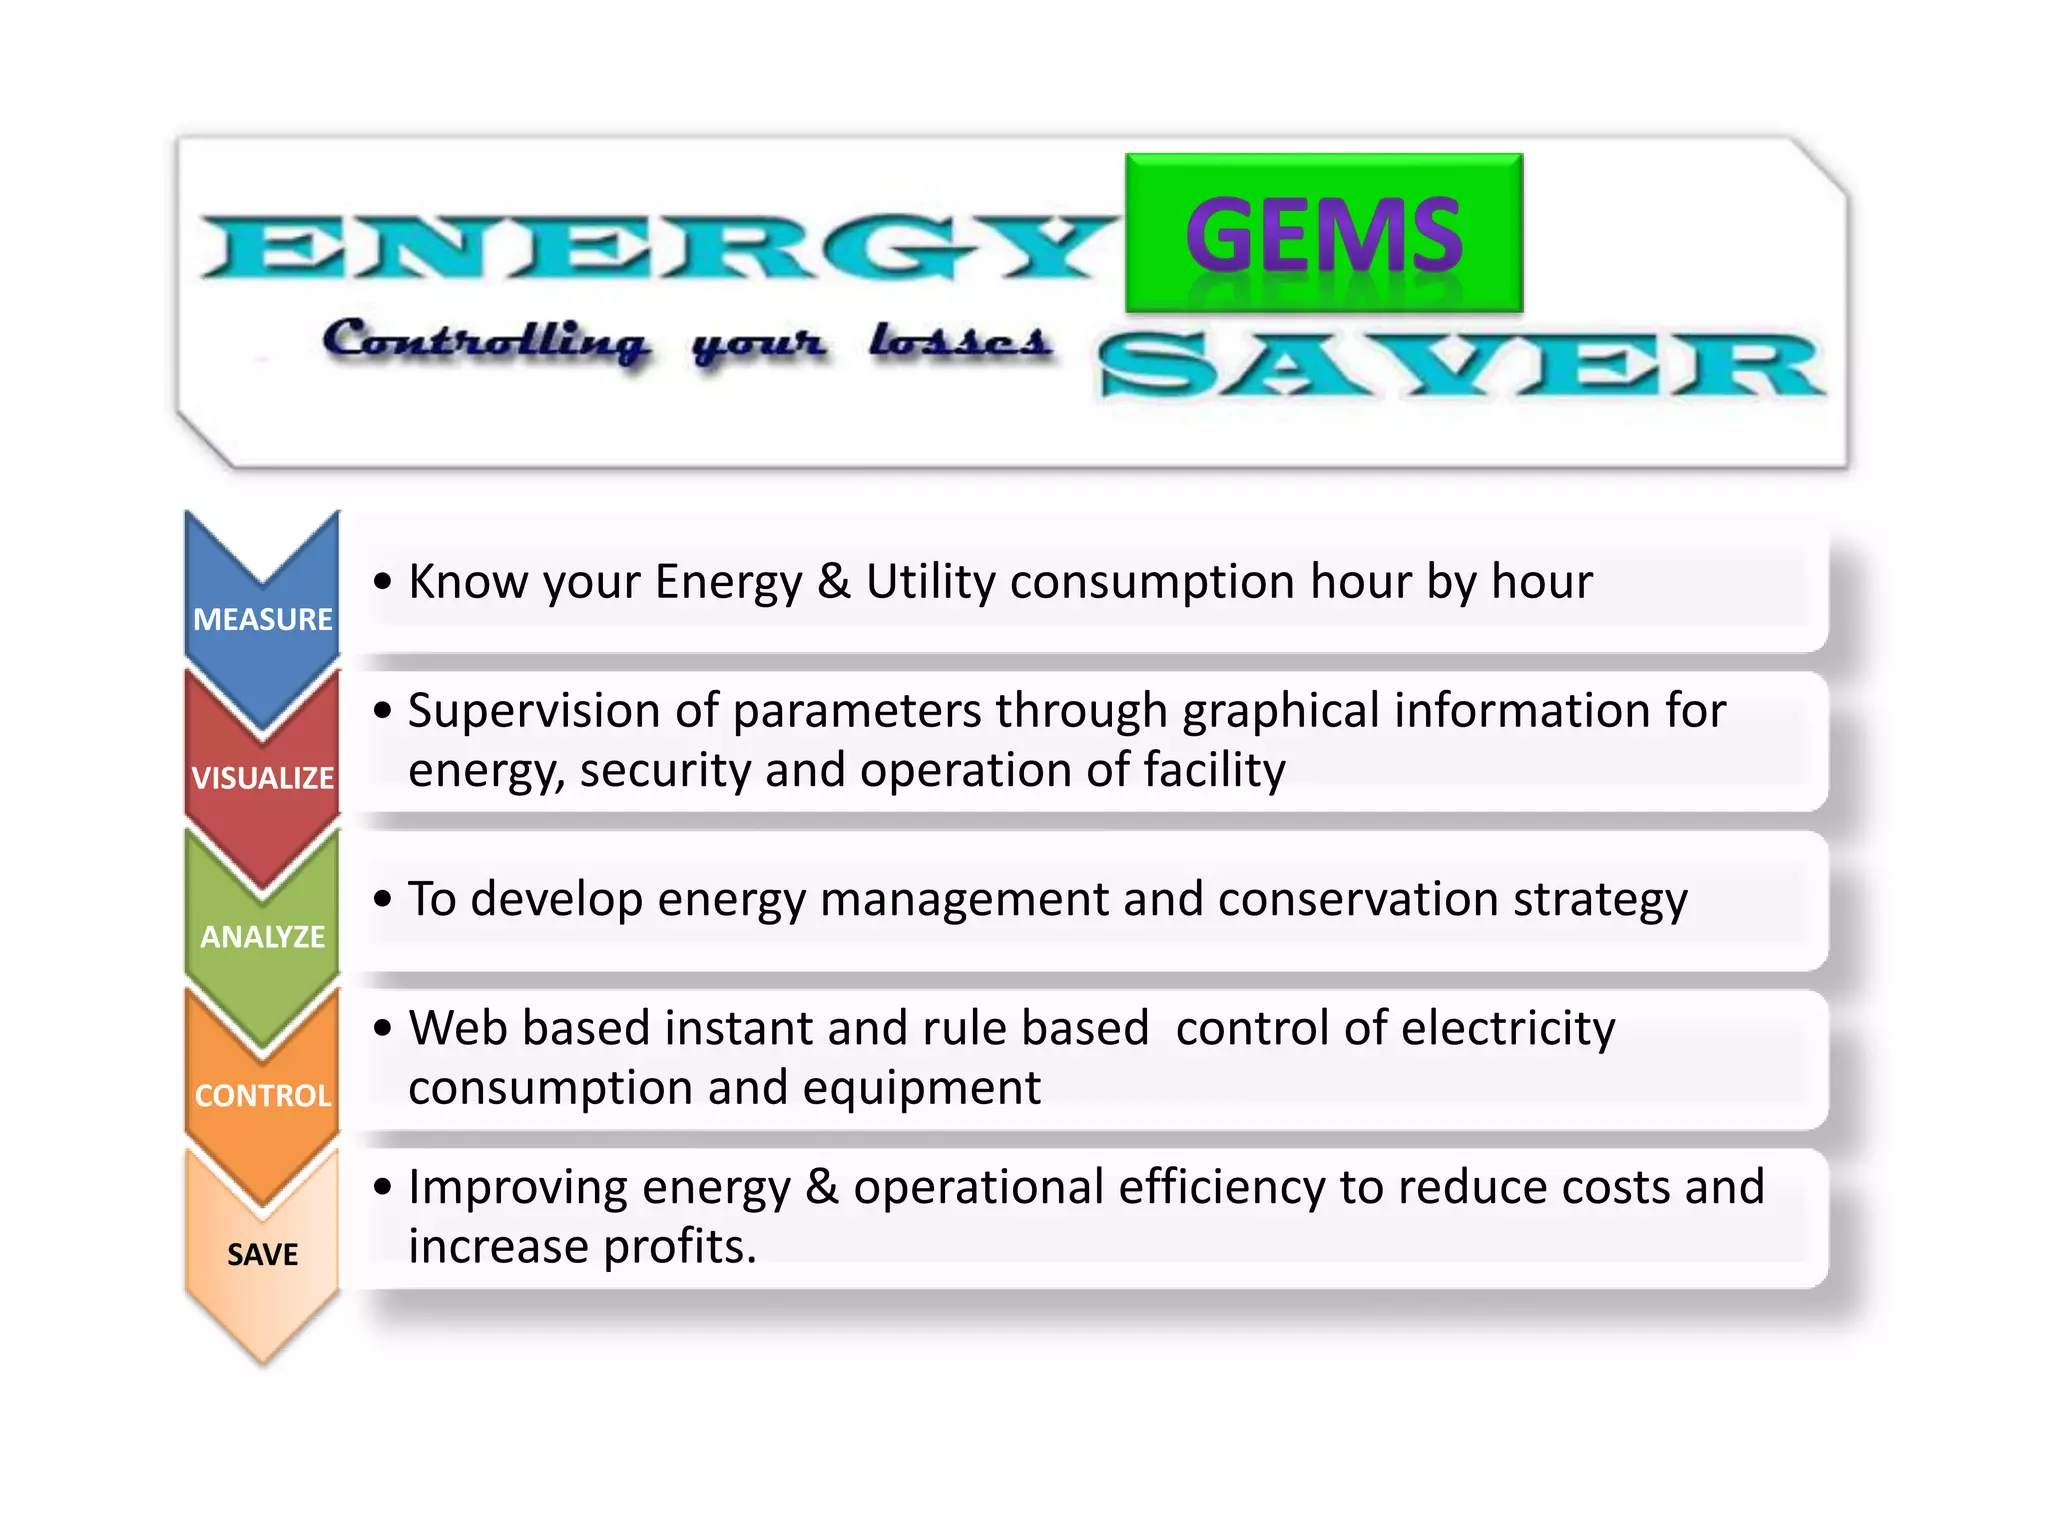
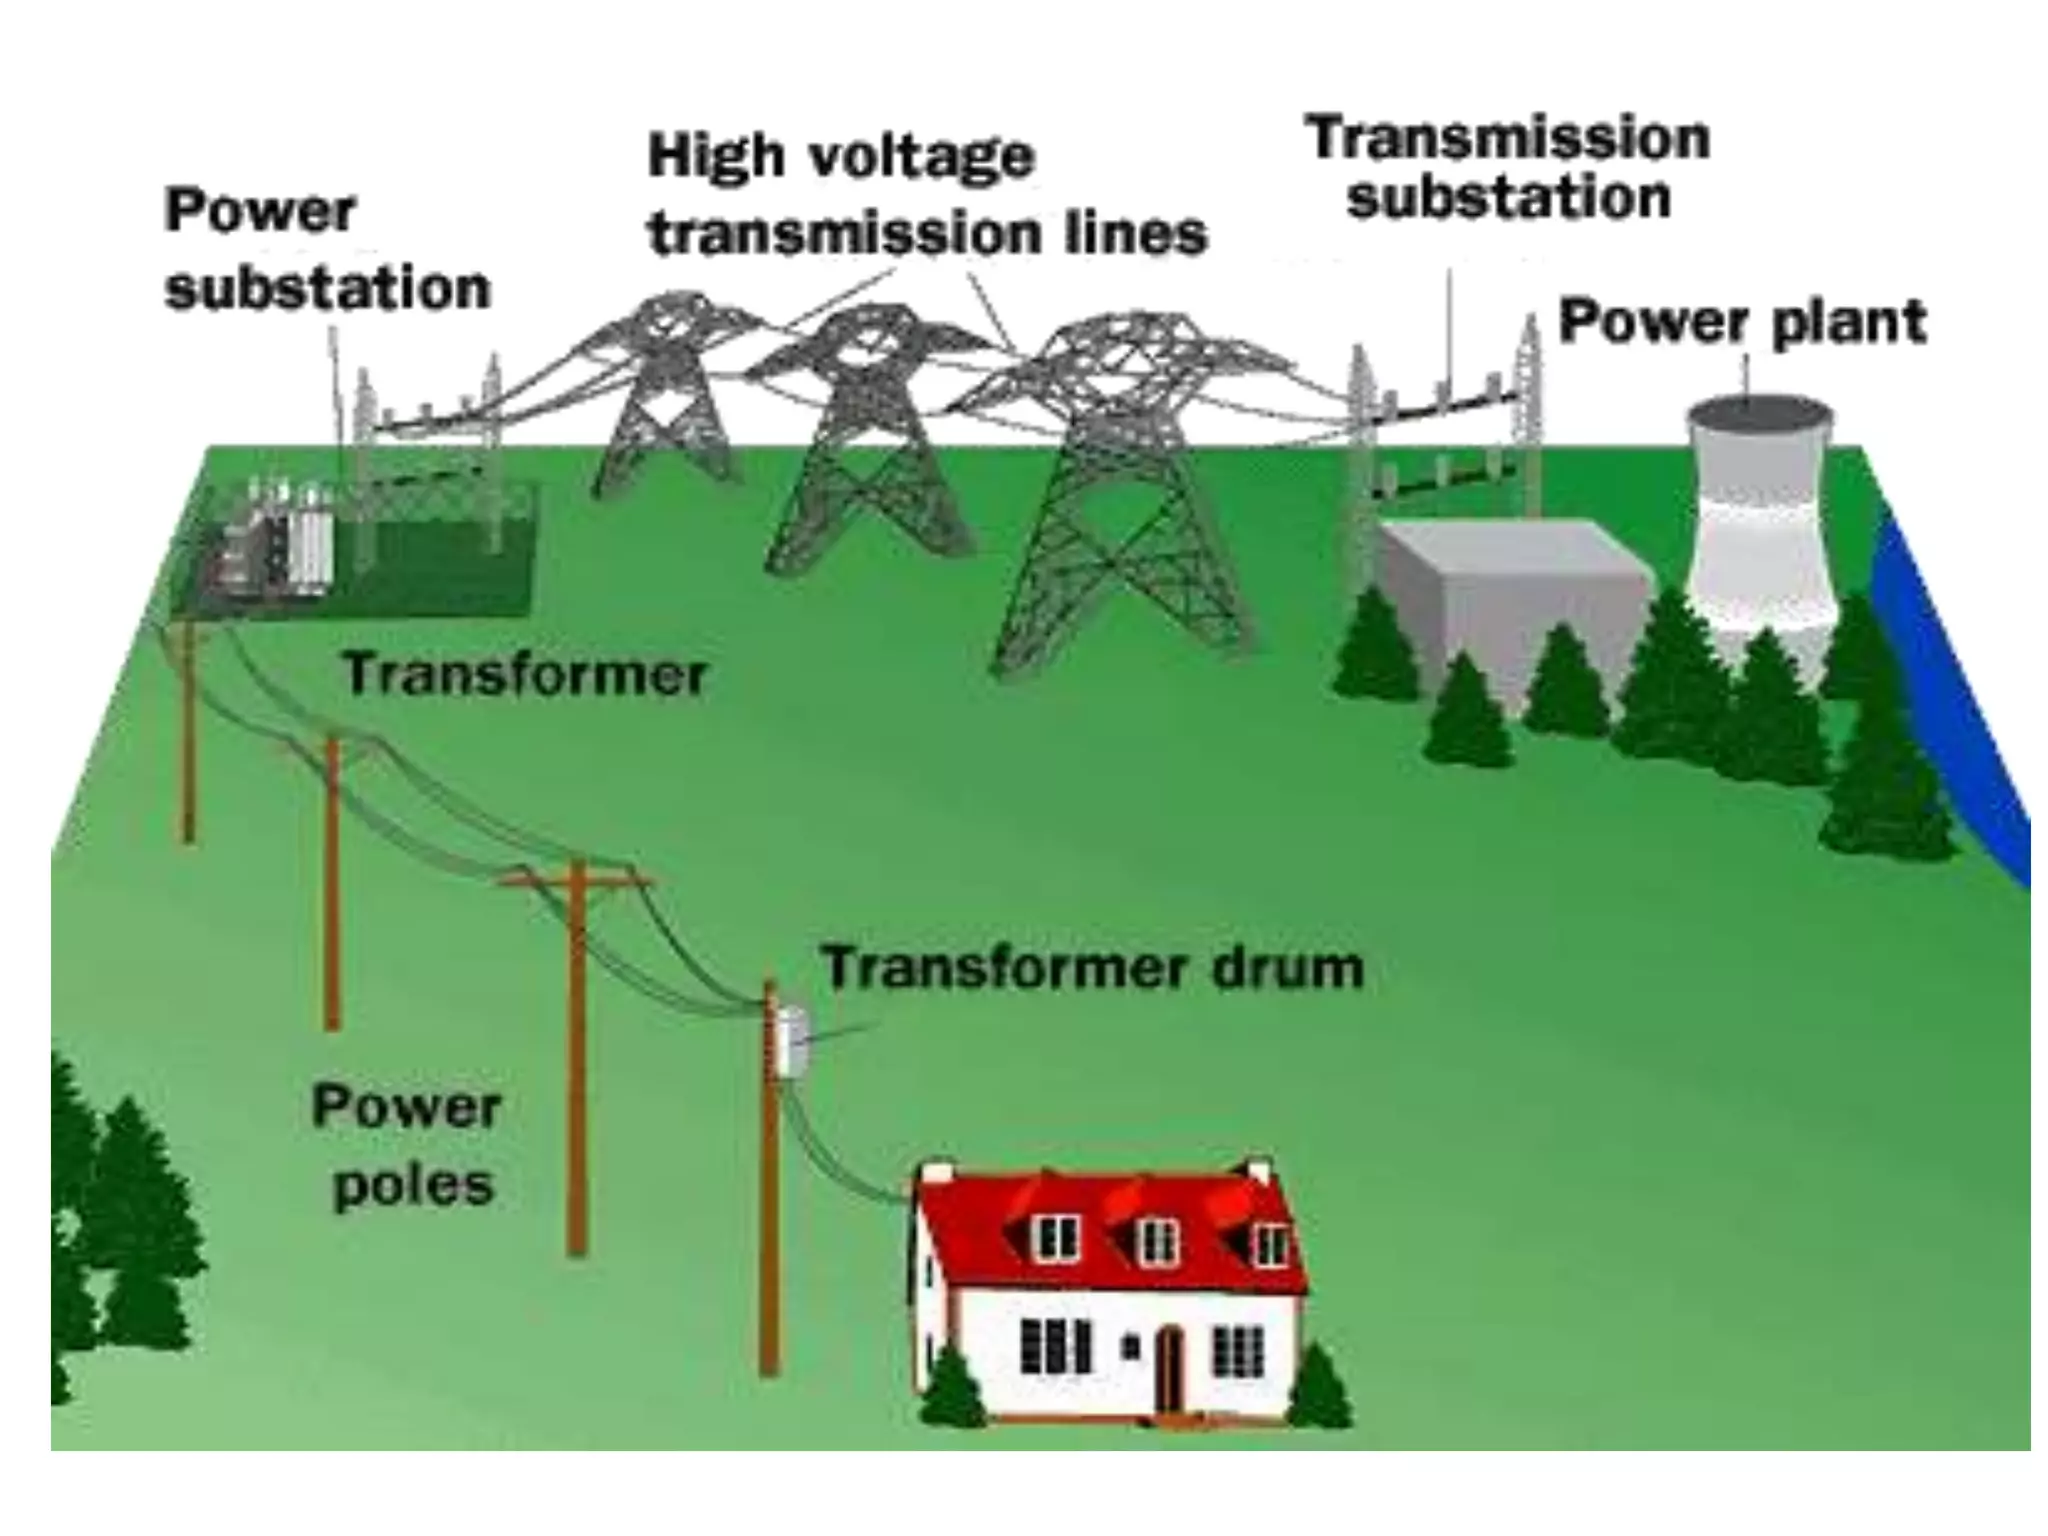
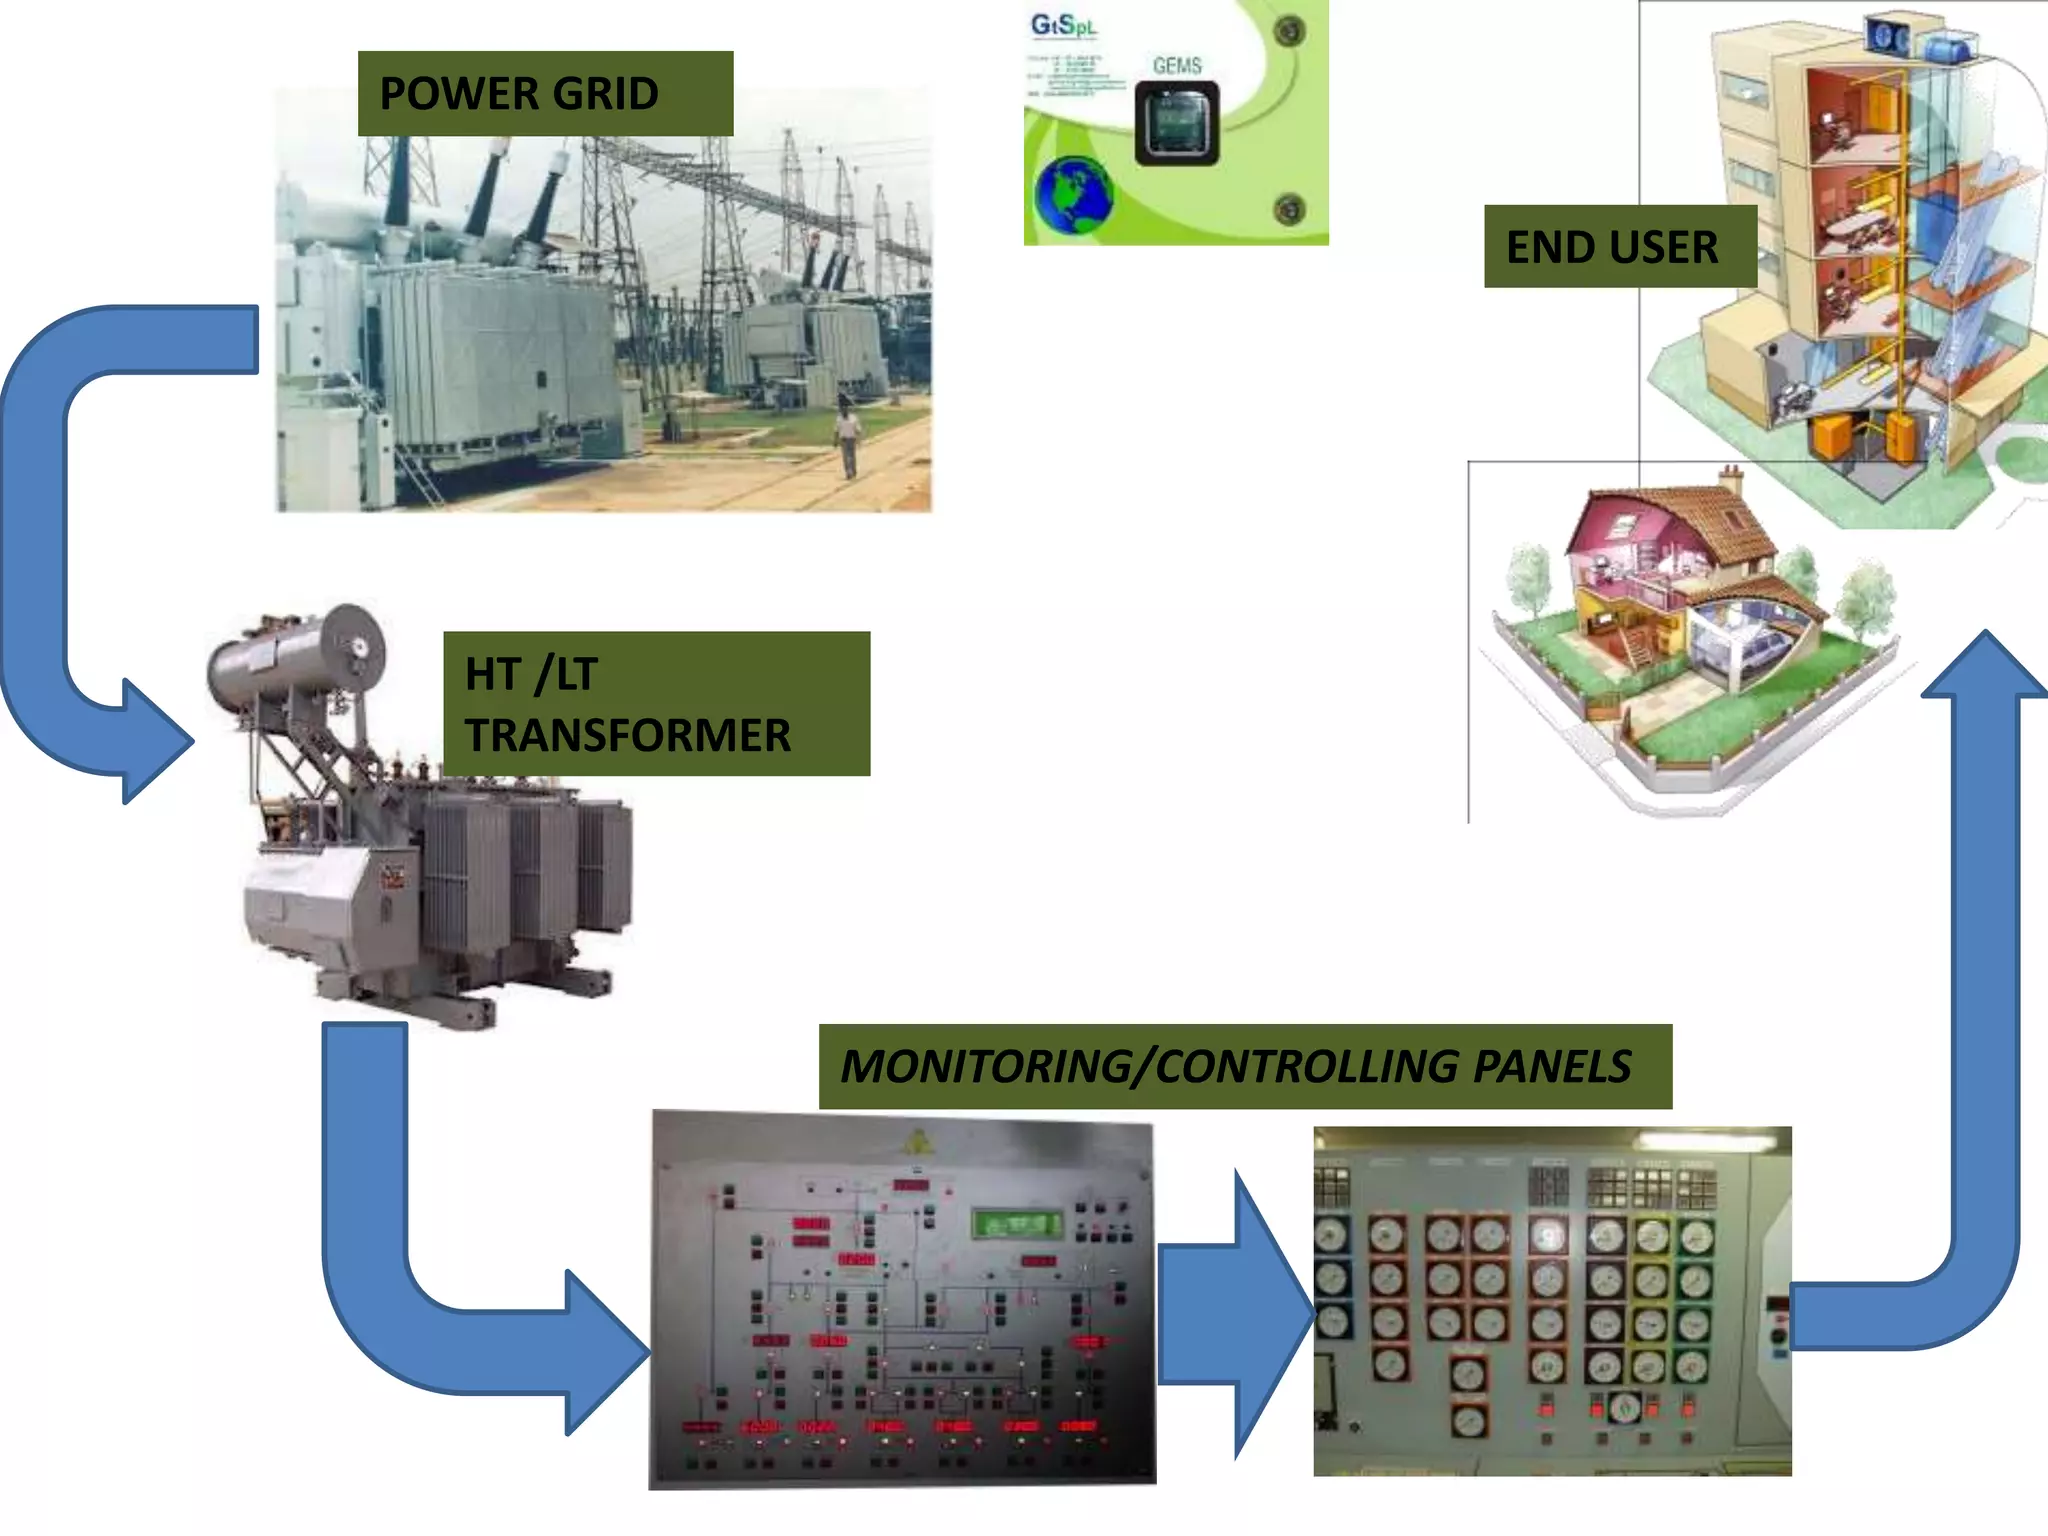
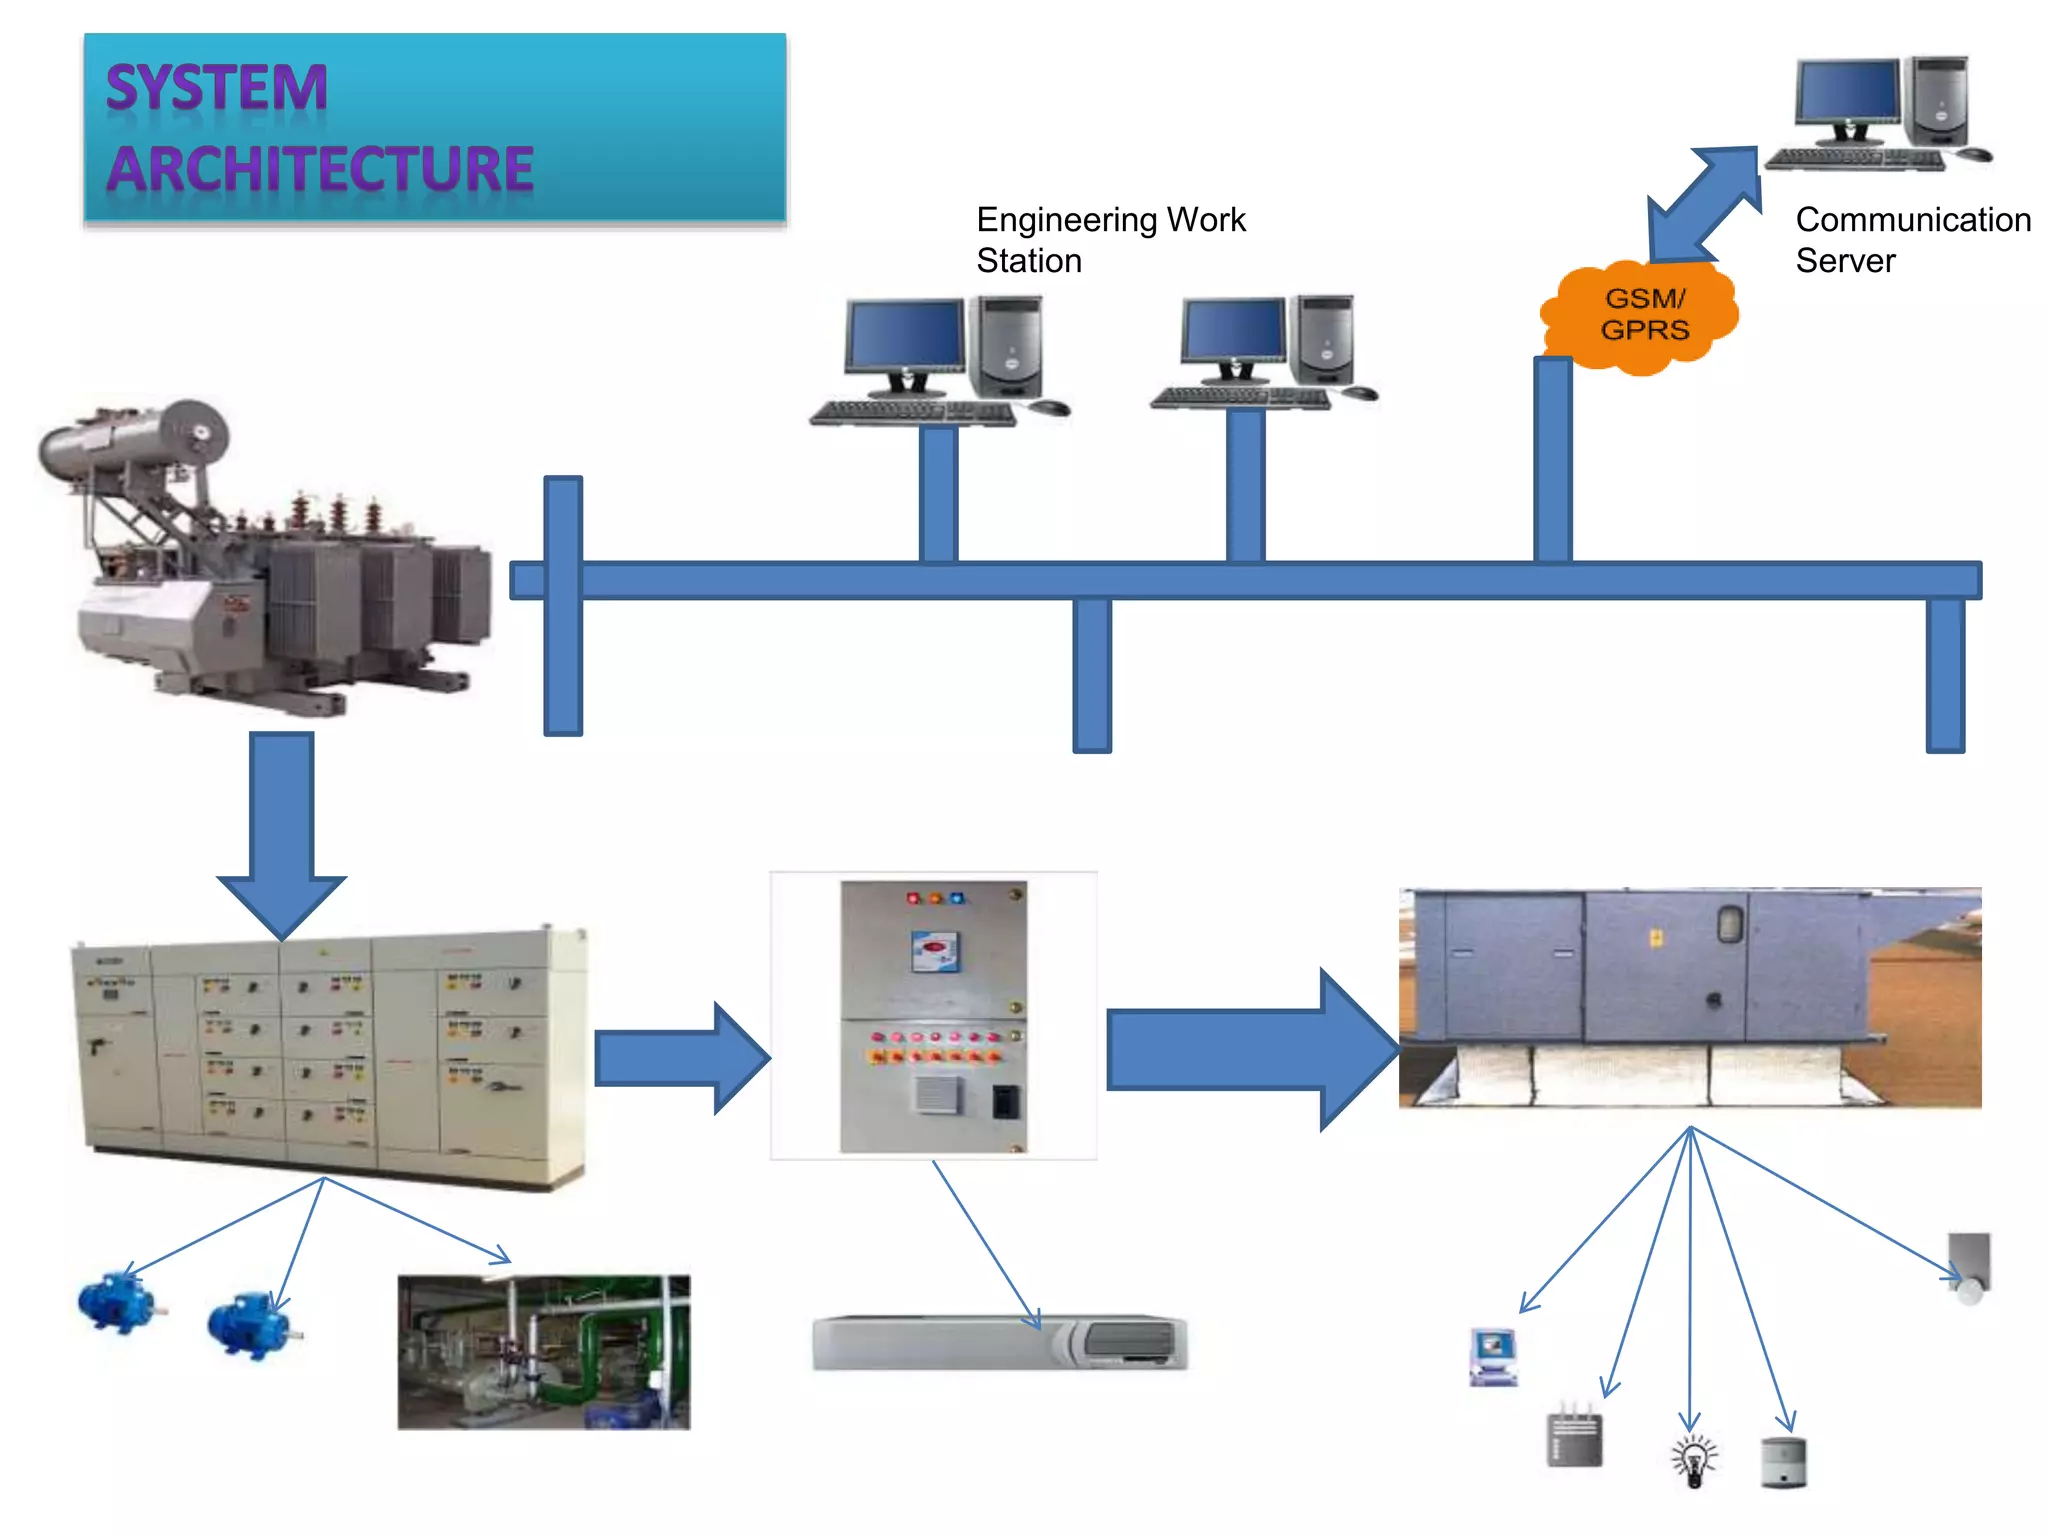
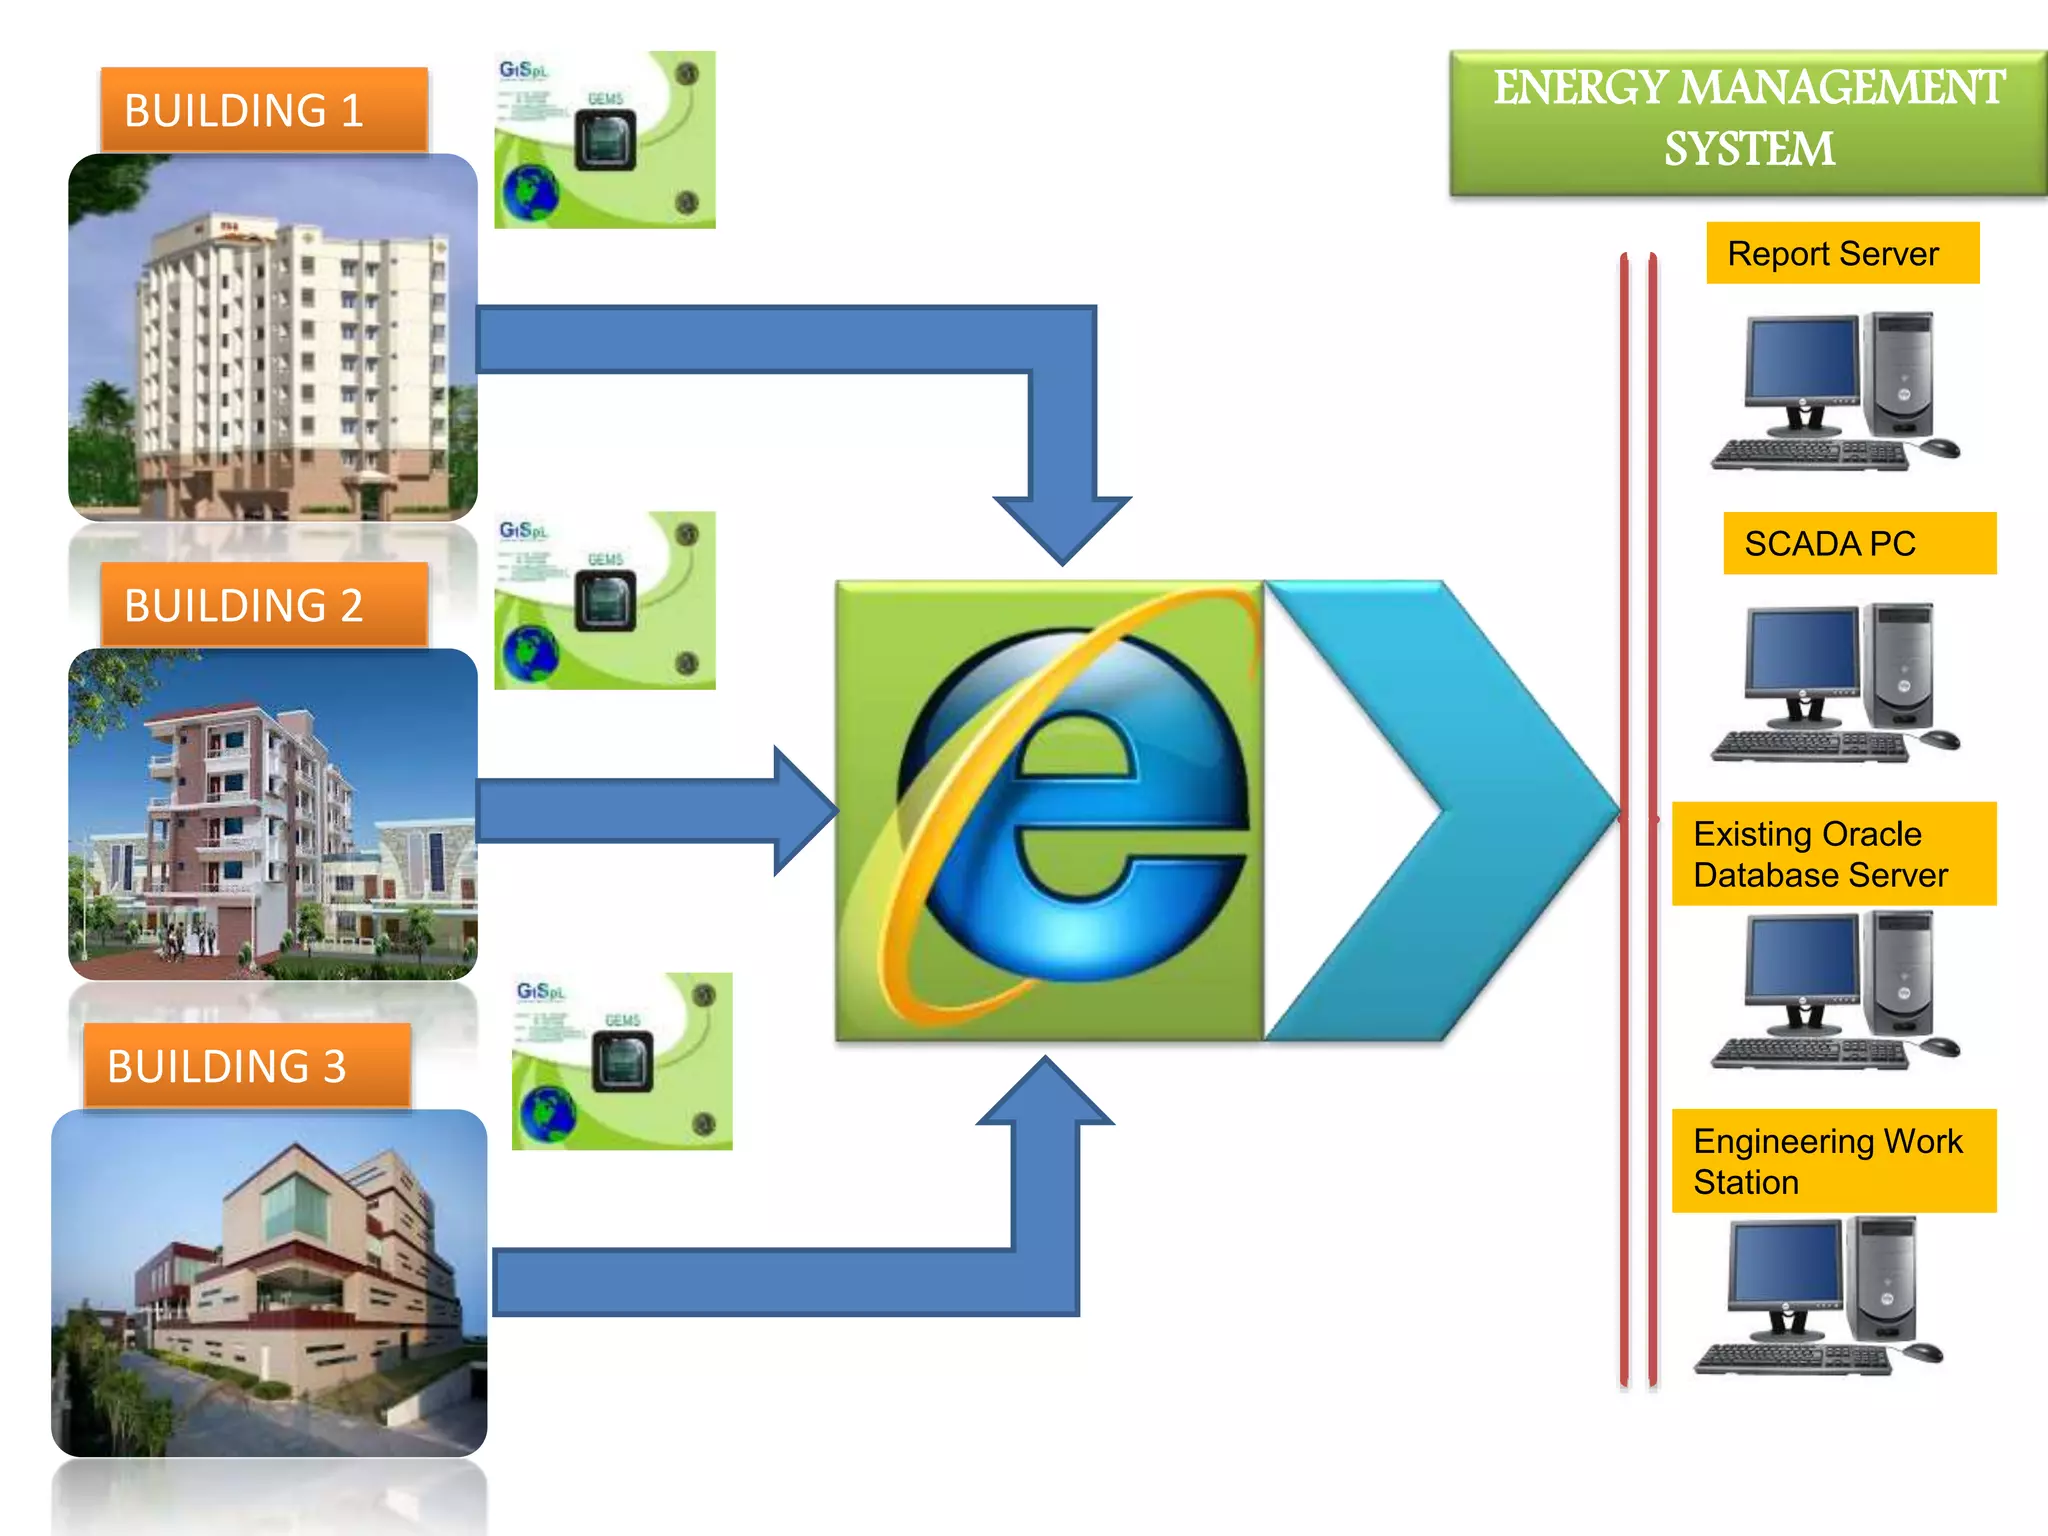
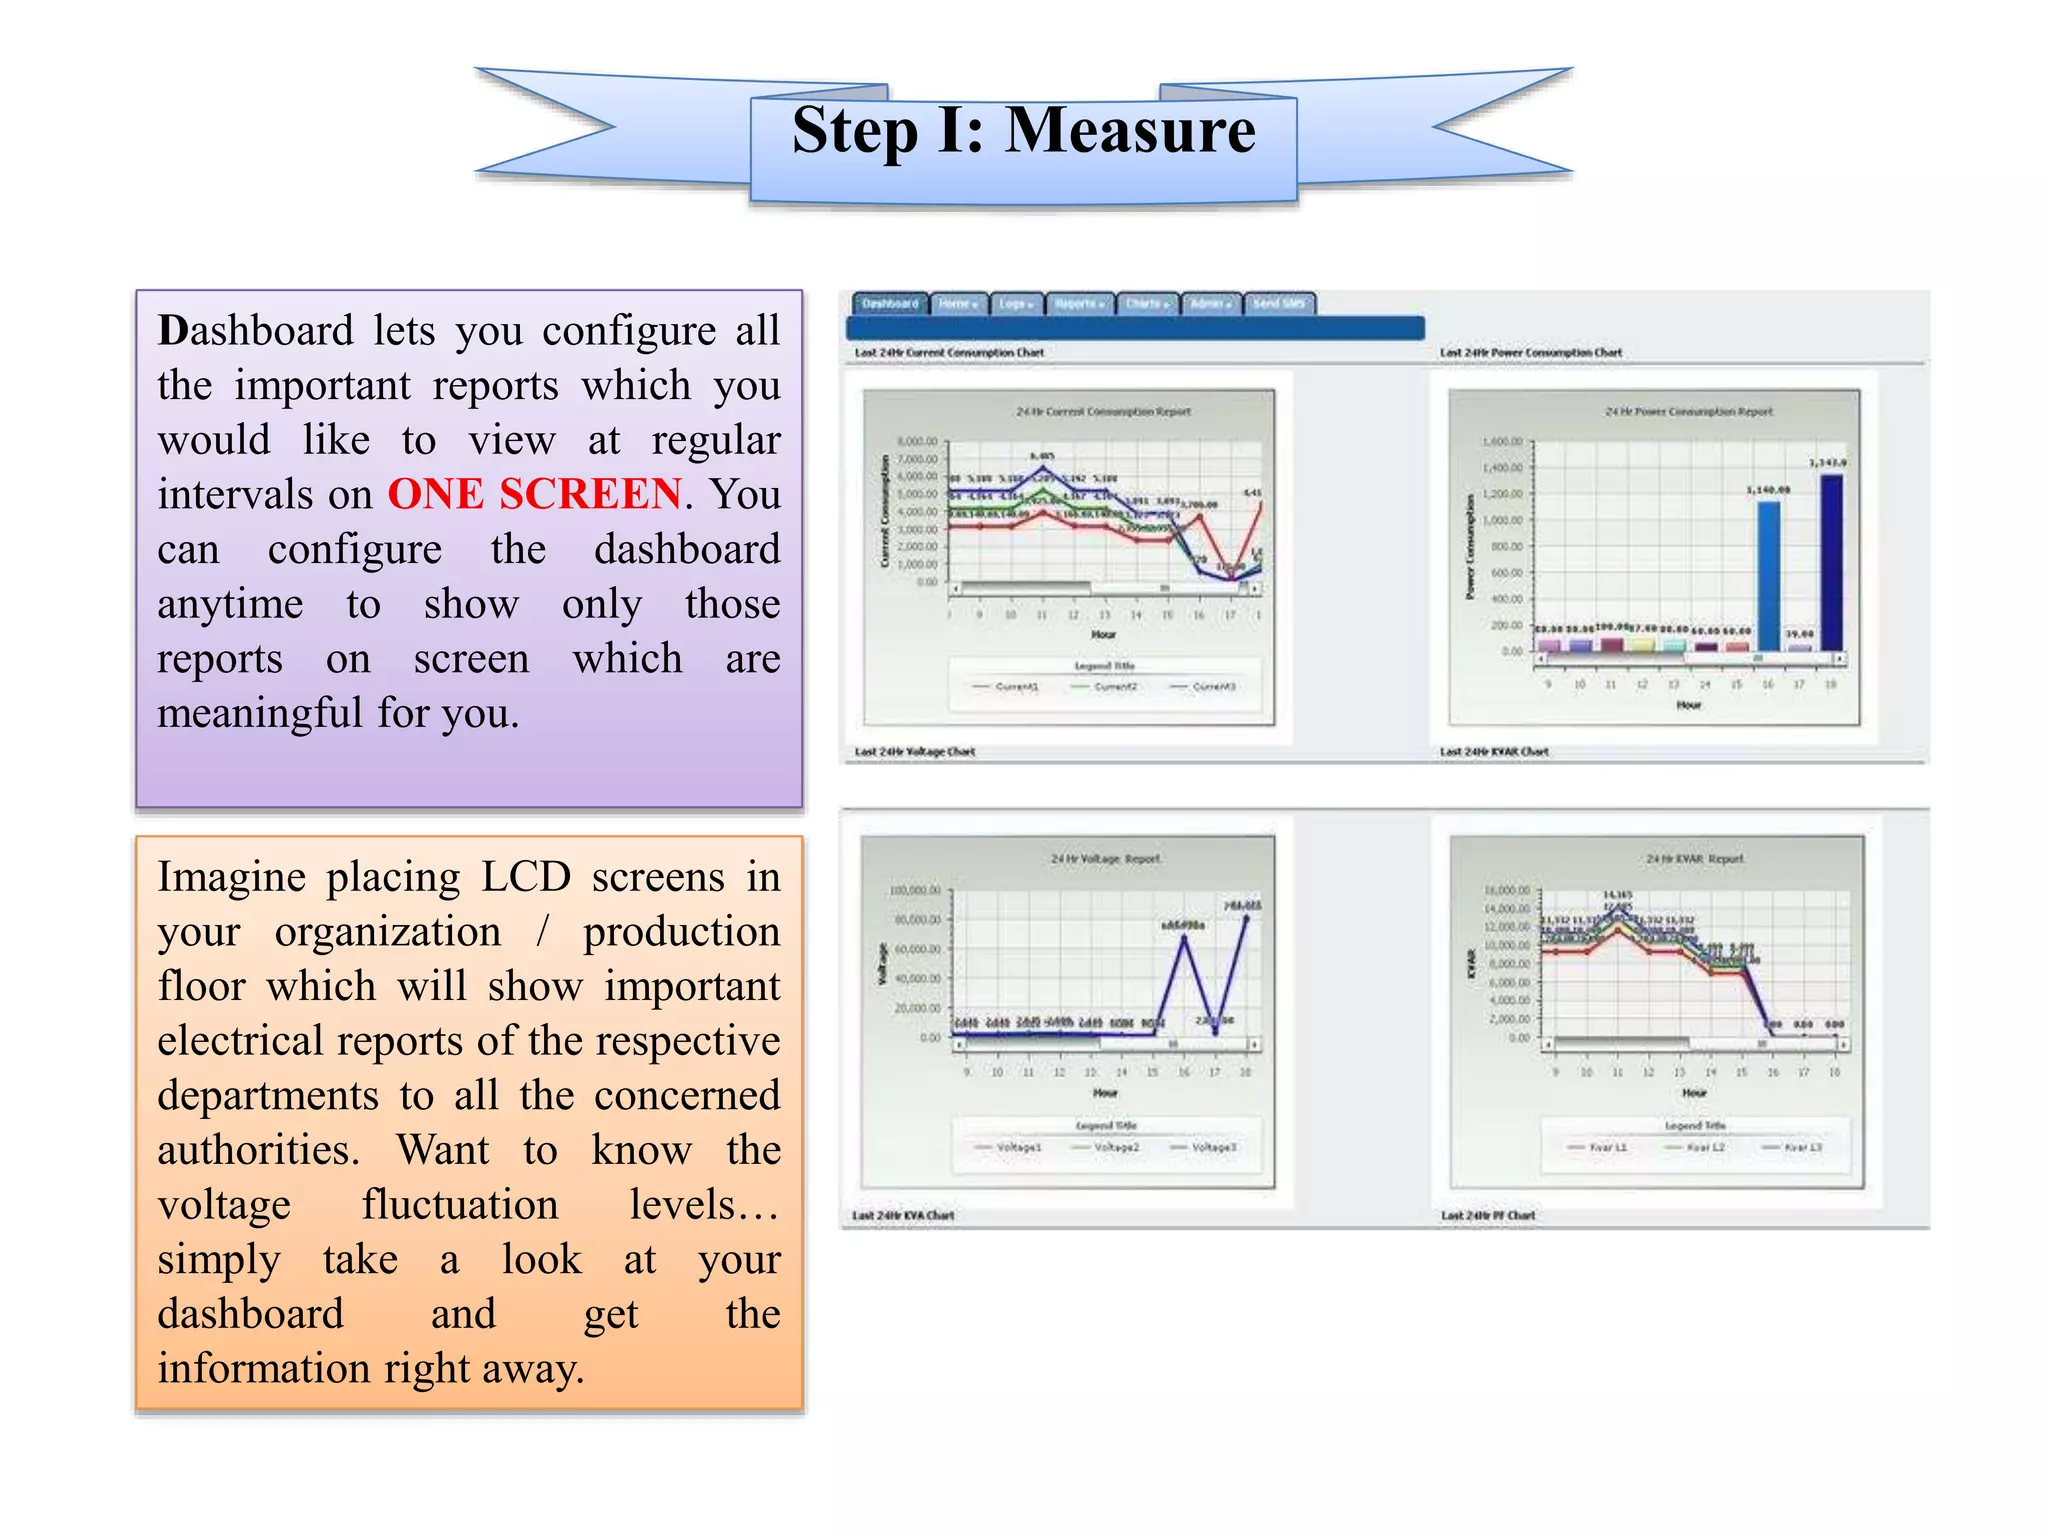
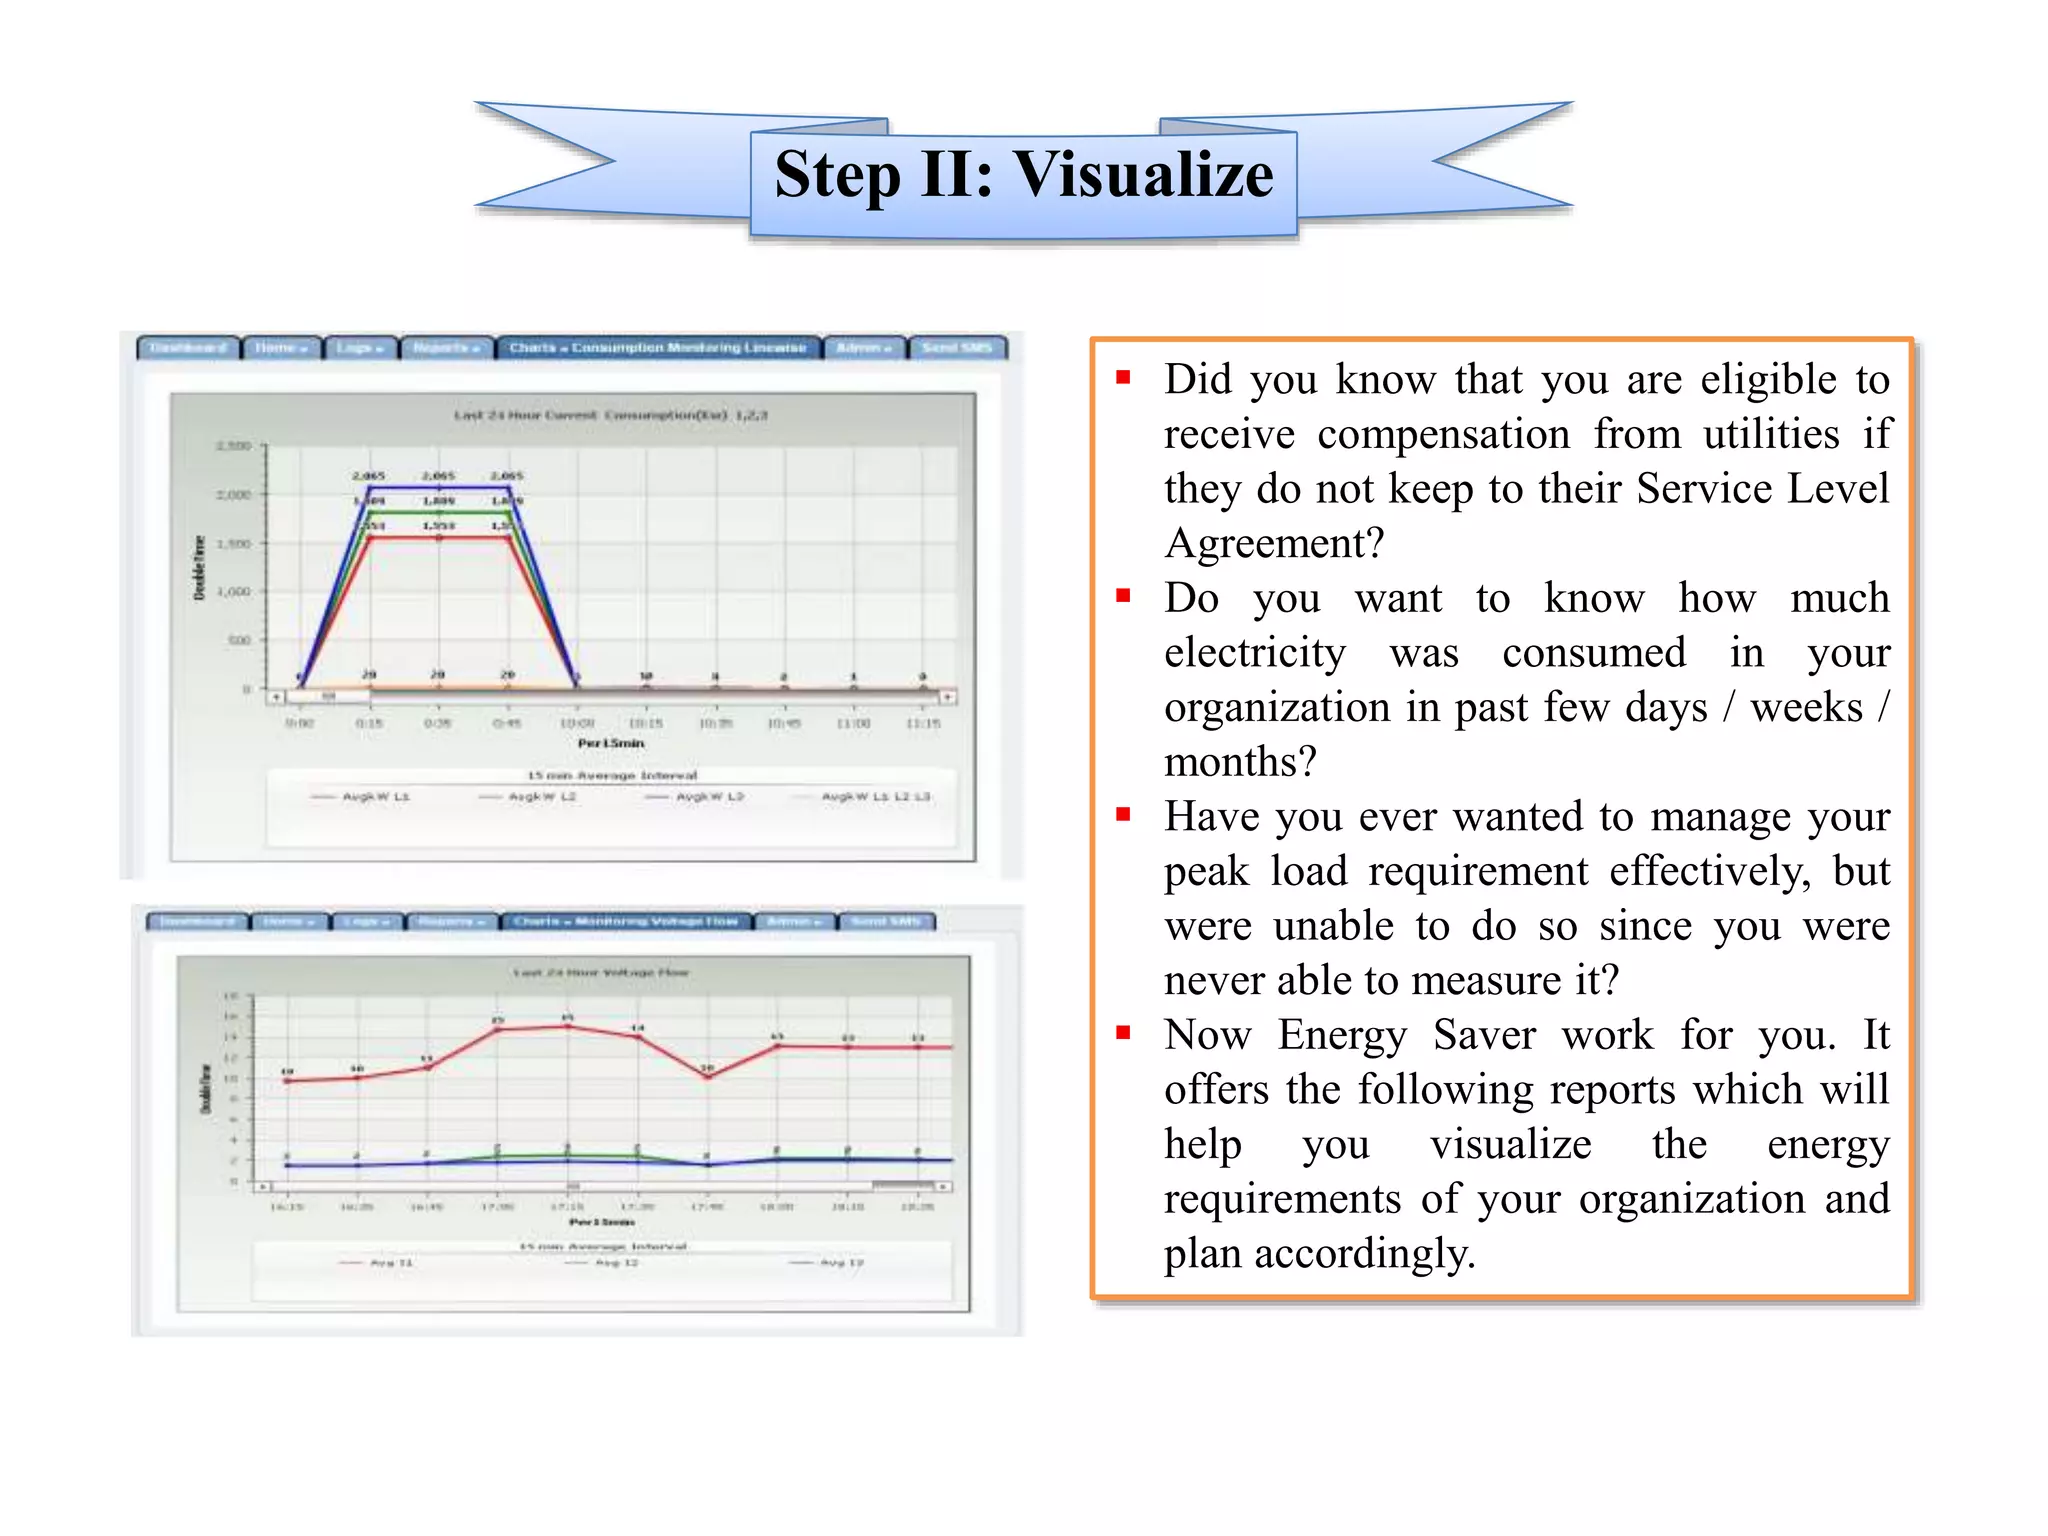
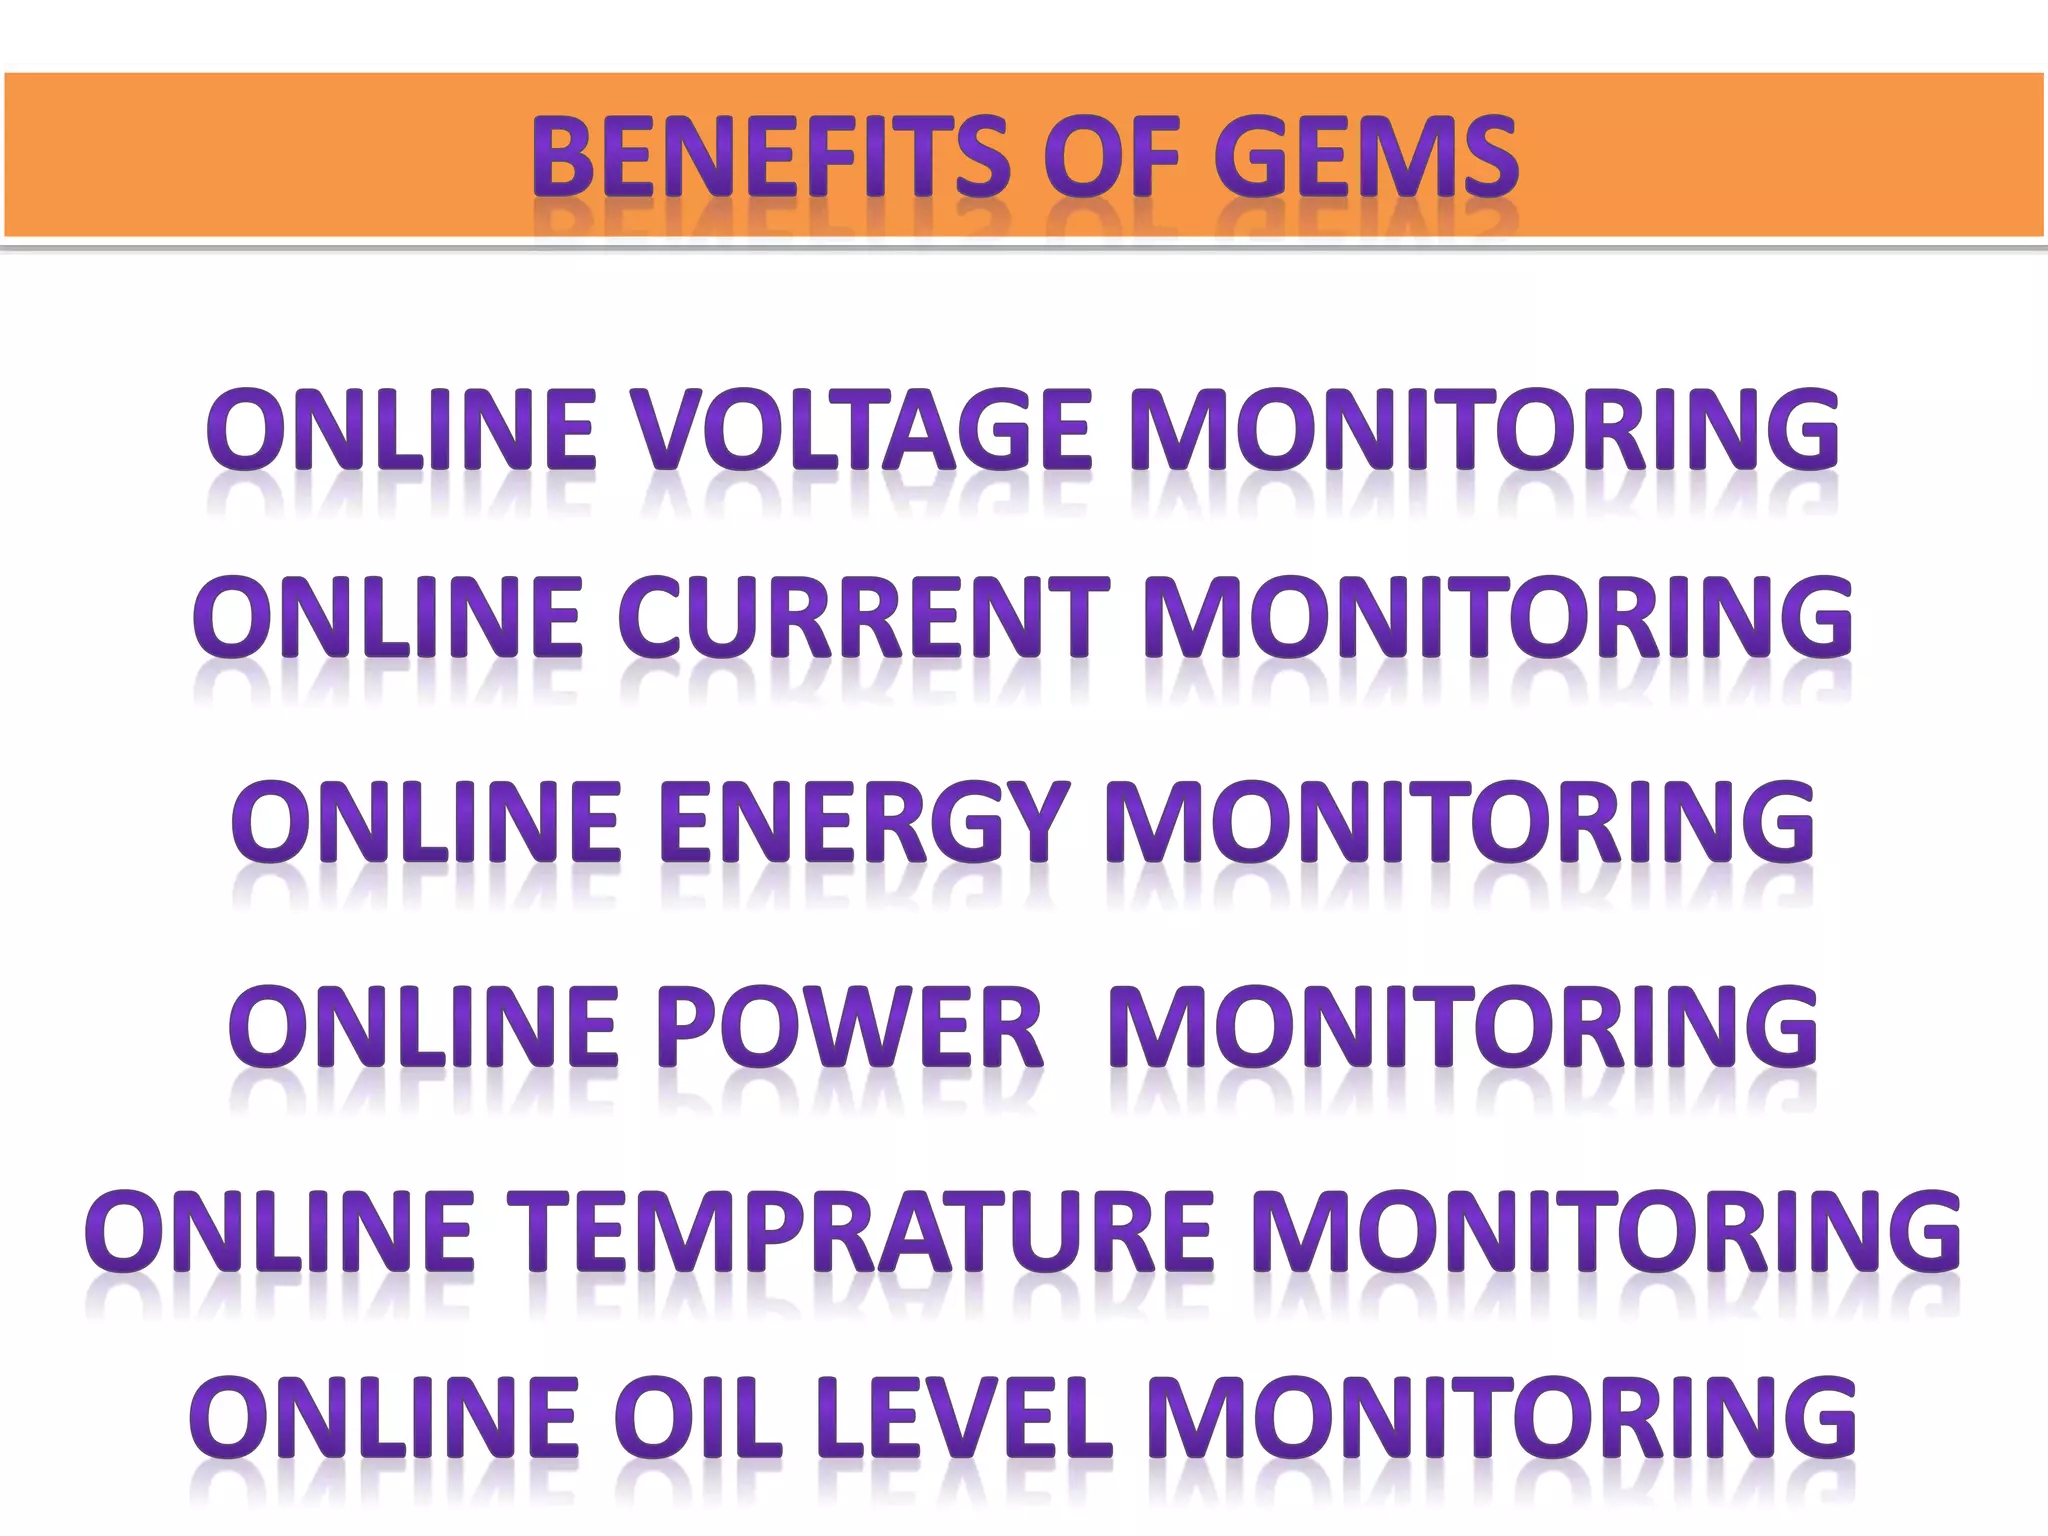
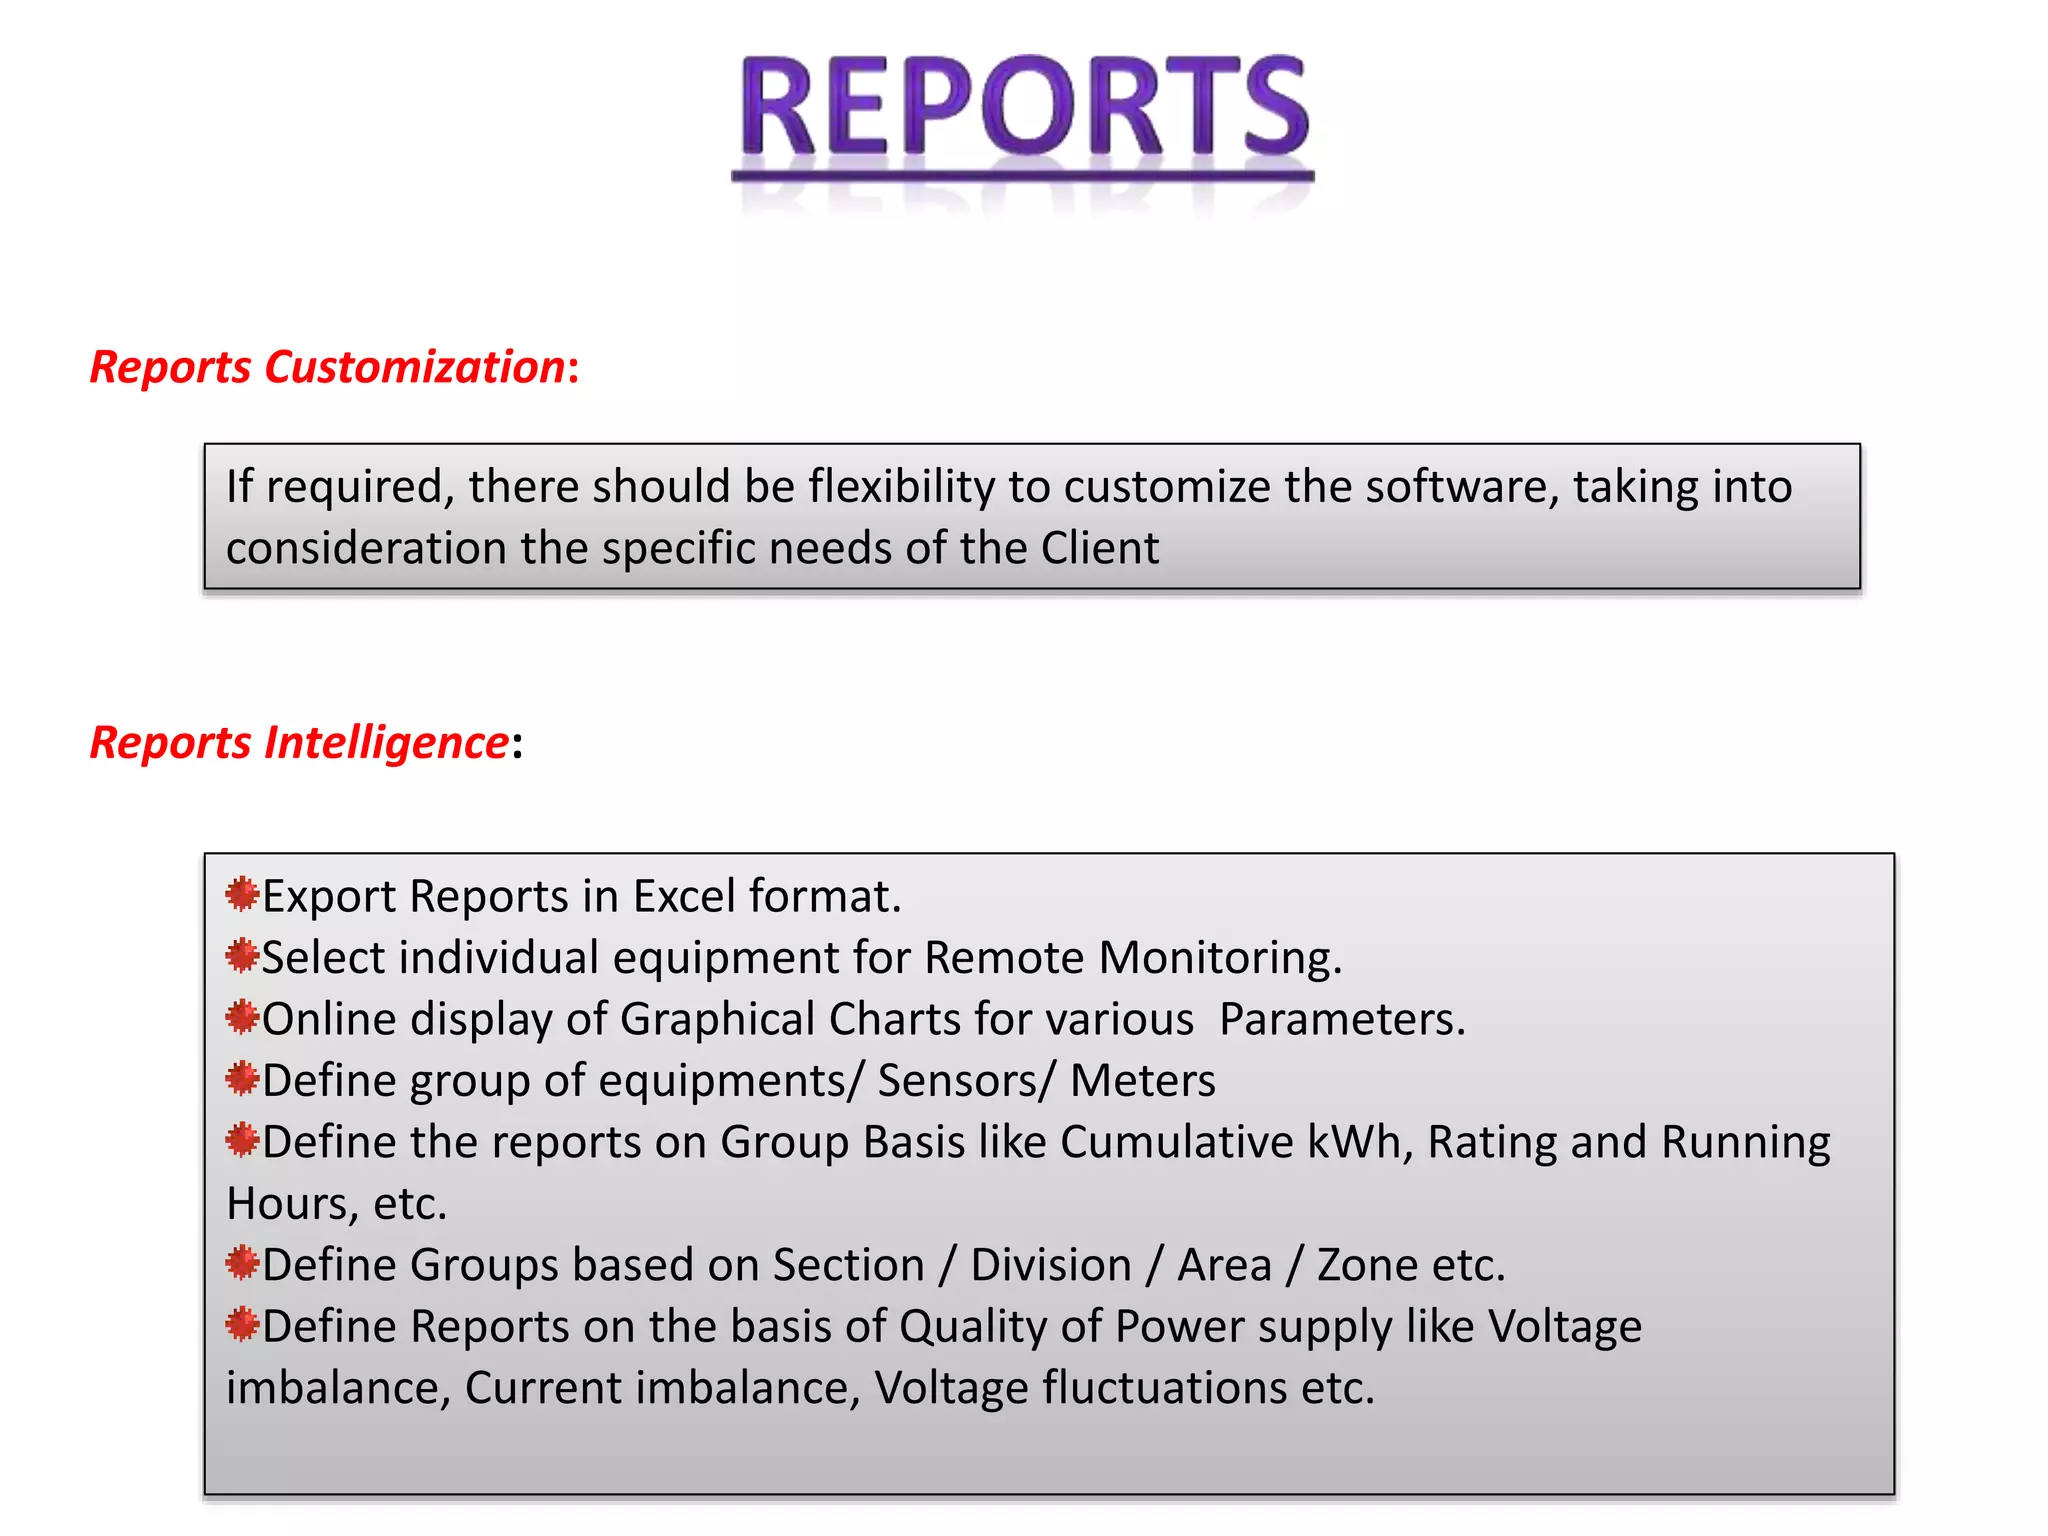
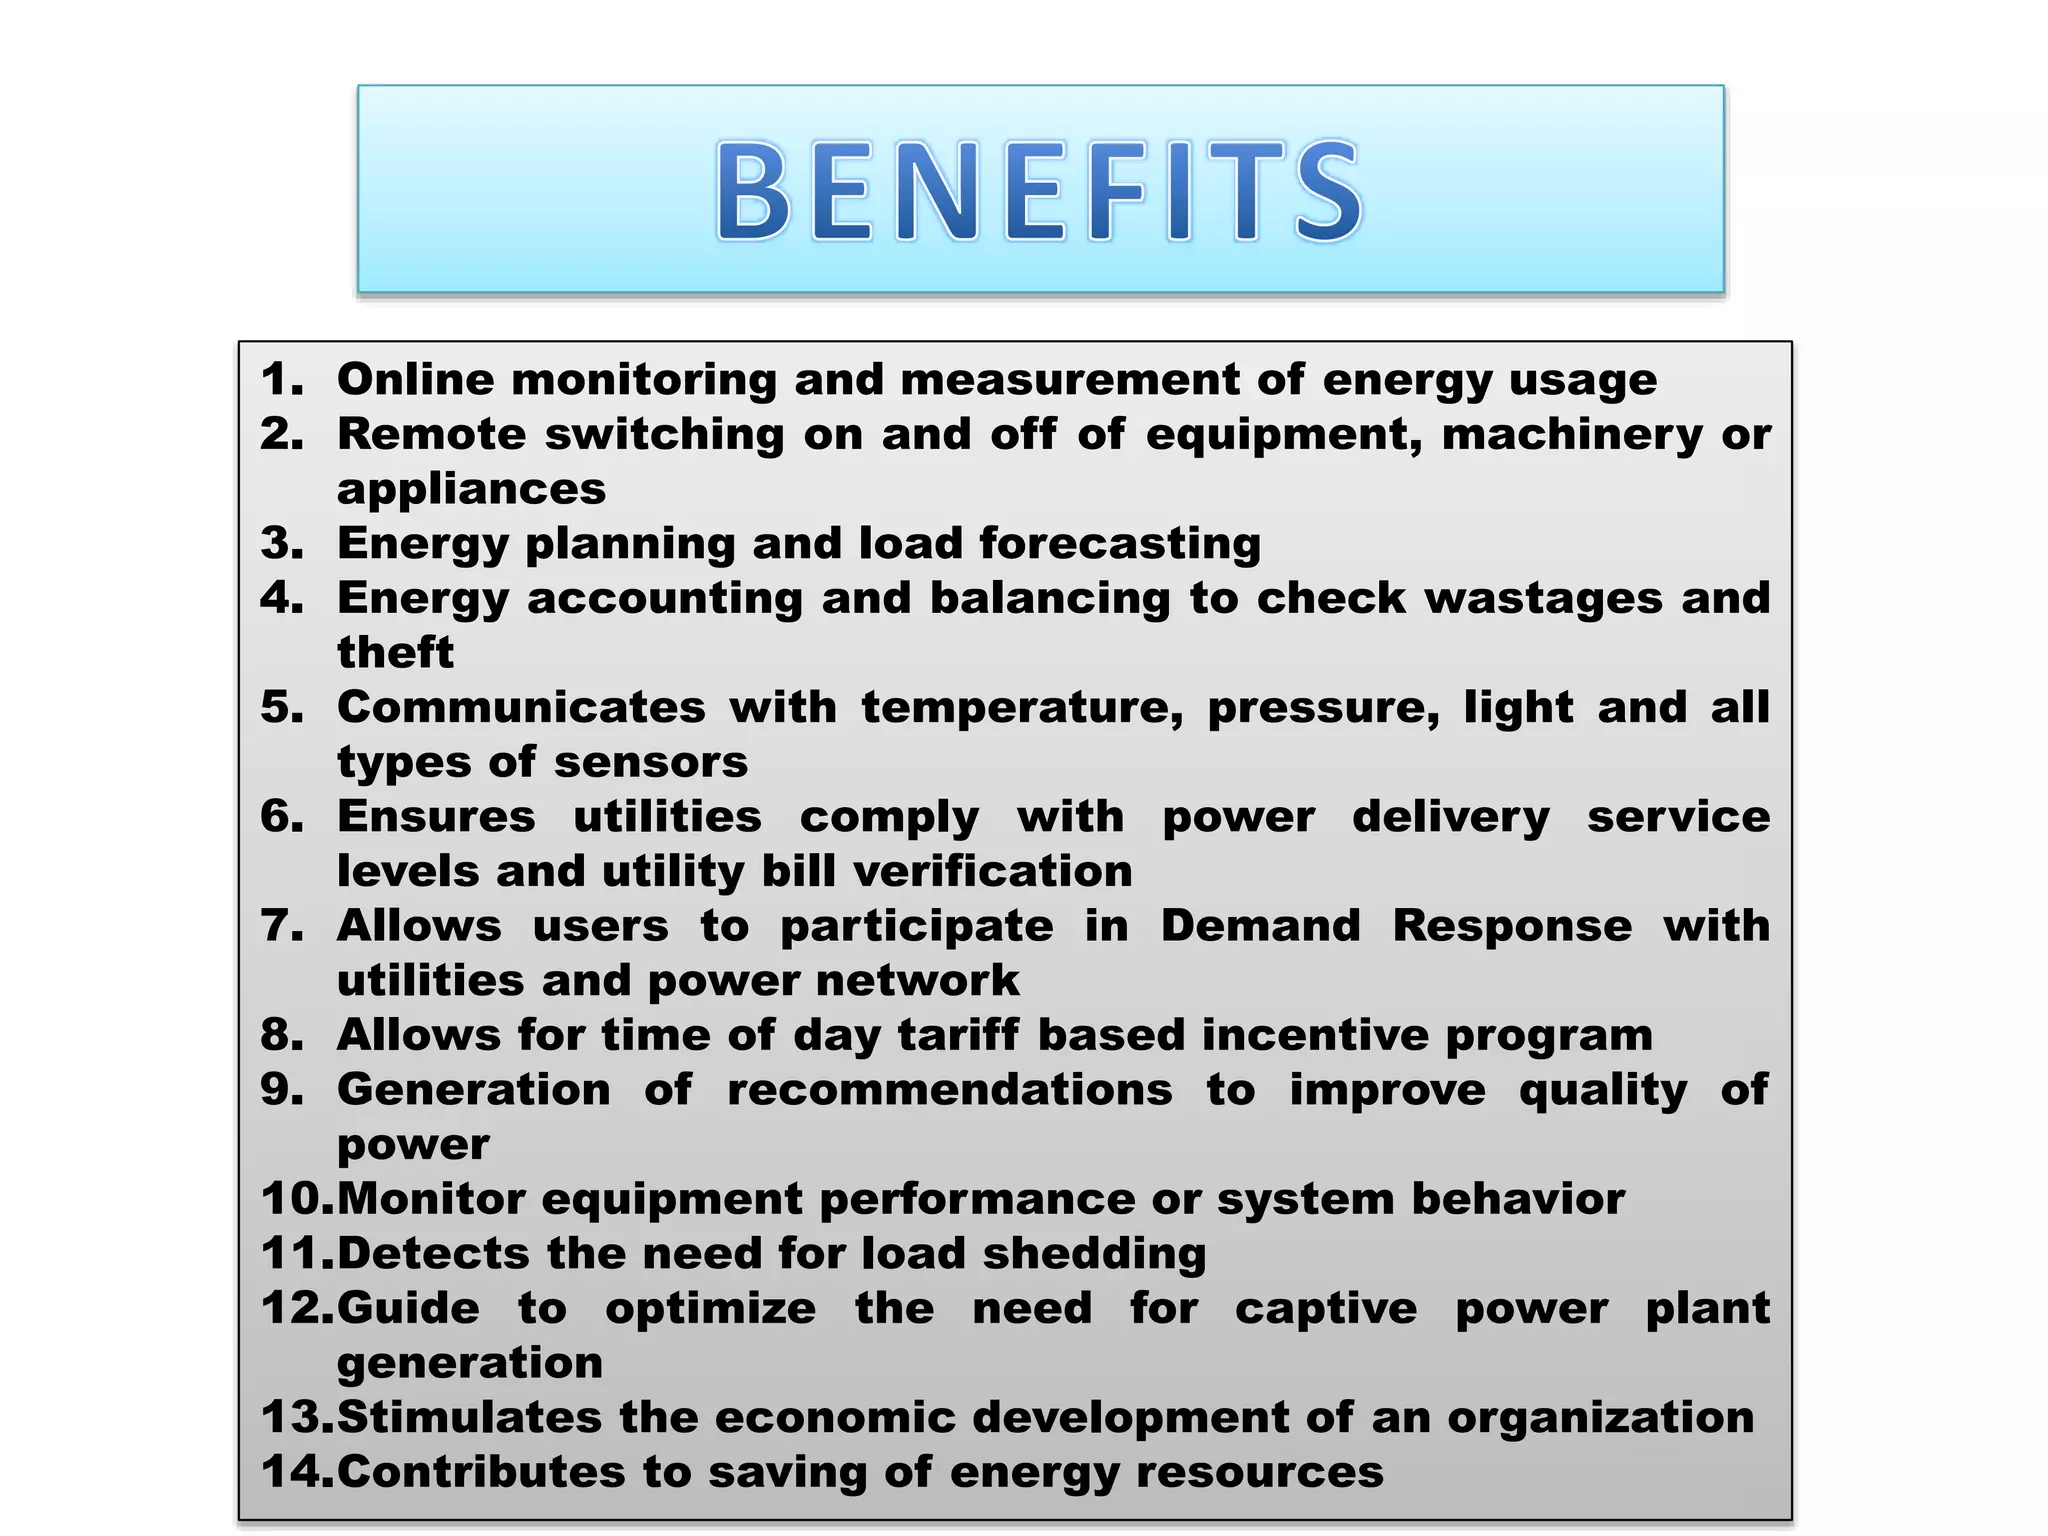
INTELLIGENT WIRELESS ENERGY
MONITORING AND CONTROLLING
SYSTEM
It's official
The government wants to save
energy & have a greener planet
Energy Policy Act of 2005 >>> EPACT 2005
Energy Independence and Security Act of 2007 >>> EISA 2007
American Recovery and Reinvestment Act of 2009 >>> ARRA 2009
To achieve and maintain optimum energy
procurement and utilization, throughout the
organization
To minimize energy costs / waste without
affecting production & quality
To reduce import dependency
To enhance energy security, economic
competitiveness, and environmental quality
MEASURE
• Know your Energy & Utility consumption hour by hour
VISUALIZE
• Supervision of parameters through graphical information for
energy, security and operation of facility
ANALYZE
• To develop energy management and conservation strategy
CONTROL
• Web based instant and rule based control of electricity
consumption and equipment
SAVE
• Improving energy & operational efficiency to reduce costs and
increase profits.
POWER GRID
HT /LT
TRANSFORMER
MONITORING/CONTROLLING PANELS
END USER
Communication
Server
Engineering Work
Station
Report Server
Existing Oracle
Database Server
Engineering Work
Station
SCADA PC
ENERGY MANAGEMENT
SYSTEM
BUILDING 1
BUILDING 2
BUILDING 3
Step I: Measure
Dashboard lets you configure all
the important reports which you
would like to view at regular
intervals on ONE SCREEN. You
can configure the dashboard
anytime to show only those
reports on screen which are
meaningful for you.
Imagine placing LCD screens in
your organization / production
floor which will show important
electrical reports of the respective
departments to all the concerned
authorities. Want to know the
voltage fluctuation levels…
simply take a look at your
dashboard and get the
information right away.
Step II: Visualize
 Did you know that you are eligible to
receive compensation from utilities if
they do not keep to their Service Level
Agreement?
 Do you want to know how much
electricity was consumed in your
organization in past few days / weeks /
months?
 Have you ever wanted to manage your
peak load requirement effectively, but
were unable to do so since you were
never able to measure it?
 Now Energy Saver work for you. It
offers the following reports which will
help you visualize the energy
requirements of your organization and
plan accordingly.
Step III: Analyze
 Cost Analysis & Tariff Calculation : The Energy Saver solution comes with an in-built
tariff logic.
 You need not engage extra resources for cost analysis of energy consumption.
 It’s as simple as clicking a link to know the cost of your energy consumption.
 Drill Down your wastage to the point level and understand the monetary impact of the
same.
 Energy Saver helps you adhere to your energy budgets more efficiently.
Step IV: Control
 REMOTE SWITCH ON/OFF (DIGITAL SWITCHES): Controlling your devices was
never so easy. With the Energy Saver solution, control all your equipment, anytime and
from anywhere. Since Energy Saver is web-based, the solution is available 24X7.
 You simply need to login to the secure website using your unique username and password
and you get access to your Energy Saver network diagram, which will help you view the
equipments currently running and those that need to be turned off. Energy Saver offers a
tree-structure based module to access the root point to be remotely switched on/off.
 Based on your selection, the equipment’s state is changed using Energy Saver digital
switches and you receive a confirmation of the action on the Internet. Imagine being able
to notice wastage due to equipment running idle or on standby and having the power to cut
down this wastage with a single click. Energy Saver makes this possible.
Reports Customization:
If required, there should be flexibility to customize the software, taking into
consideration the specific needs of the Client
Reports Intelligence:
Export Reports in Excel format.
Select individual equipment for Remote Monitoring.
Online display of Graphical Charts for various Parameters.
Define group of equipments/ Sensors/ Meters
Define the reports on Group Basis like Cumulative kWh, Rating and Running
Hours, etc.
Define Groups based on Section / Division / Area / Zone etc.
Define Reports on the basis of Quality of Power supply like Voltage
imbalance, Current imbalance, Voltage fluctuations etc.
1. Online monitoring and measurement of energy usage
2. Remote switching on and off of equipment, machinery or
appliances
3. Energy planning and load forecasting
4. Energy accounting and balancing to check wastages and
theft
5. Communicates with temperature, pressure, light and all
types of sensors
6. Ensures utilities comply with power delivery service
levels and utility bill verification
7. Allows users to participate in Demand Response with
utilities and power network
8. Allows for time of day tariff based incentive program
9. Generation of recommendations to improve quality of
power
10.Monitor equipment performance or system behavior
11.Detects the need for load shedding
12.Guide to optimize the need for captive power plant
generation
13.Stimulates the economic development of an organization
14.Contributes to saving of energy resources
Energy Monitoring System -GSM/GPRS enable online wireless and web based Energy Management Solution

Energy Monitoring System -GSM/GPRS enable online wireless and web based Energy Management Solution

  • 1.
  • 3.
    It's official The governmentwants to save energy & have a greener planet Energy Policy Act of 2005 >>> EPACT 2005 Energy Independence and Security Act of 2007 >>> EISA 2007 American Recovery and Reinvestment Act of 2009 >>> ARRA 2009
  • 4.
    To achieve andmaintain optimum energy procurement and utilization, throughout the organization To minimize energy costs / waste without affecting production & quality To reduce import dependency To enhance energy security, economic competitiveness, and environmental quality
  • 5.
    MEASURE • Know yourEnergy & Utility consumption hour by hour VISUALIZE • Supervision of parameters through graphical information for energy, security and operation of facility ANALYZE • To develop energy management and conservation strategy CONTROL • Web based instant and rule based control of electricity consumption and equipment SAVE • Improving energy & operational efficiency to reduce costs and increase profits.
  • 7.
  • 8.
  • 9.
    Report Server Existing Oracle DatabaseServer Engineering Work Station SCADA PC ENERGY MANAGEMENT SYSTEM BUILDING 1 BUILDING 2 BUILDING 3
  • 10.
    Step I: Measure Dashboardlets you configure all the important reports which you would like to view at regular intervals on ONE SCREEN. You can configure the dashboard anytime to show only those reports on screen which are meaningful for you. Imagine placing LCD screens in your organization / production floor which will show important electrical reports of the respective departments to all the concerned authorities. Want to know the voltage fluctuation levels… simply take a look at your dashboard and get the information right away.
  • 11.
    Step II: Visualize Did you know that you are eligible to receive compensation from utilities if they do not keep to their Service Level Agreement?  Do you want to know how much electricity was consumed in your organization in past few days / weeks / months?  Have you ever wanted to manage your peak load requirement effectively, but were unable to do so since you were never able to measure it?  Now Energy Saver work for you. It offers the following reports which will help you visualize the energy requirements of your organization and plan accordingly.
  • 12.
    Step III: Analyze Cost Analysis & Tariff Calculation : The Energy Saver solution comes with an in-built tariff logic.  You need not engage extra resources for cost analysis of energy consumption.  It’s as simple as clicking a link to know the cost of your energy consumption.  Drill Down your wastage to the point level and understand the monetary impact of the same.  Energy Saver helps you adhere to your energy budgets more efficiently.
  • 13.
    Step IV: Control REMOTE SWITCH ON/OFF (DIGITAL SWITCHES): Controlling your devices was never so easy. With the Energy Saver solution, control all your equipment, anytime and from anywhere. Since Energy Saver is web-based, the solution is available 24X7.  You simply need to login to the secure website using your unique username and password and you get access to your Energy Saver network diagram, which will help you view the equipments currently running and those that need to be turned off. Energy Saver offers a tree-structure based module to access the root point to be remotely switched on/off.  Based on your selection, the equipment’s state is changed using Energy Saver digital switches and you receive a confirmation of the action on the Internet. Imagine being able to notice wastage due to equipment running idle or on standby and having the power to cut down this wastage with a single click. Energy Saver makes this possible.
  • 15.
    Reports Customization: If required,there should be flexibility to customize the software, taking into consideration the specific needs of the Client Reports Intelligence: Export Reports in Excel format. Select individual equipment for Remote Monitoring. Online display of Graphical Charts for various Parameters. Define group of equipments/ Sensors/ Meters Define the reports on Group Basis like Cumulative kWh, Rating and Running Hours, etc. Define Groups based on Section / Division / Area / Zone etc. Define Reports on the basis of Quality of Power supply like Voltage imbalance, Current imbalance, Voltage fluctuations etc.
  • 16.
    1. Online monitoringand measurement of energy usage 2. Remote switching on and off of equipment, machinery or appliances 3. Energy planning and load forecasting 4. Energy accounting and balancing to check wastages and theft 5. Communicates with temperature, pressure, light and all types of sensors 6. Ensures utilities comply with power delivery service levels and utility bill verification 7. Allows users to participate in Demand Response with utilities and power network 8. Allows for time of day tariff based incentive program 9. Generation of recommendations to improve quality of power 10.Monitor equipment performance or system behavior 11.Detects the need for load shedding 12.Guide to optimize the need for captive power plant generation 13.Stimulates the economic development of an organization 14.Contributes to saving of energy resources