Downloaded 44 times


![Switching off more does not always mean saving more! Switch off scheme geometry (1,2) linear (2,3) linear (3,4) squared (8,9) squared Load ratio 2 3 4 9 Cell radius 2x 3x 2x 3x PB[W] 5 18 5 18 Night zone 16h30m 14h40m 12h20m 7h NodeB saving [%] 68.7 61.1 50.4 29.1 Network saving 34.3 40.7 37.8 25.9](https://image.slidesharecdn.com/imt-v3-091119031827-phpapp02/85/Energy-Efficient-Wireless-Internet-Access-52-320.jpg)
![Constant cost model: Total saving Saving can be huge! 0 5 10 15 20 0 0.1 0.2 0.3 0.4 0.5 0.6 0.7 0.8 0.9 1 0 10 20 30 40 Energy saving [cost/day] Energy saving [%] Traffic ratio, Roaming Saving Switching Max](https://image.slidesharecdn.com/imt-v3-091119031827-phpapp02/85/Energy-Efficient-Wireless-Internet-Access-63-320.jpg)
![Constant cost model: Roaming balance 0 5 10 15 20 0 0.1 0.2 0.3 0.4 0.5 0.6 0.7 0.8 0.9 1 0 10 20 30 40 Energy saving [cost/day] Energy saving [%] Traffic ratio, Total A B](https://image.slidesharecdn.com/imt-v3-091119031827-phpapp02/85/Energy-Efficient-Wireless-Internet-Access-64-320.jpg)
![Constant cost model: Switching balance 0 5 10 15 20 0 0.1 0.2 0.3 0.4 0.5 0.6 0.7 0.8 0.9 1 0 10 20 30 40 Energy saving [cost/day] Energy saving [%] Traffic ratio, Total A B](https://image.slidesharecdn.com/imt-v3-091119031827-phpapp02/85/Energy-Efficient-Wireless-Internet-Access-65-320.jpg)
![Variable cost model: Total saving Different cost models lead to different policies 0 5 10 15 20 0 0.1 0.2 0.3 0.4 0.5 0.6 0.7 0.8 0.9 1 Energy saving [cost/day] Traffic ratio, Roaming Saving Switching Max](https://image.slidesharecdn.com/imt-v3-091119031827-phpapp02/85/Energy-Efficient-Wireless-Internet-Access-66-320.jpg)
![Variable cost model: Total saving Different cost models lead to different policies 5 10 15 20 25 30 0 0.1 0.2 0.3 0.4 0.5 0.6 0.7 0.8 0.9 1 Energy saving [%] Traffic ratio, Roaming Saving Switching Max](https://image.slidesharecdn.com/imt-v3-091119031827-phpapp02/85/Energy-Efficient-Wireless-Internet-Access-67-320.jpg)
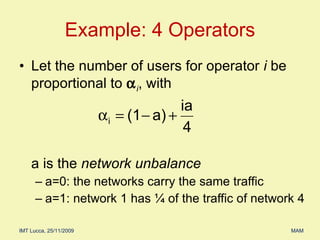
![2 Operators: Different QoS 0.4 0.5 0.6 0.7 0.8 0.9 1 =0.25 =0.50 =0.75 =1.00 0 5 10 15 20 25 0.1 0.2 0.3 Saving [%] QoS traffic reduction factor, ](https://image.slidesharecdn.com/imt-v3-091119031827-phpapp02/85/Energy-Efficient-Wireless-Internet-Access-69-320.jpg)
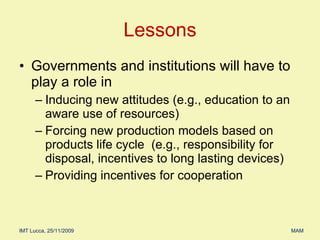
![4 Operators: Increasing Pattern Under same cost, increasing pattern is optimal 20 25 30 35 40 0 0.2 0.4 0.6 0.8 1 Saving [%] Network unbalance, a same cost - All var cost - All same cost - One var cost - One Roaming to all is more effective](https://image.slidesharecdn.com/imt-v3-091119031827-phpapp02/85/Energy-Efficient-Wireless-Internet-Access-73-320.jpg)
![4 Operators: Decreasing Pattern 20 25 30 35 40 0 0.2 0.4 0.6 0.8 1 Saving [%] Network unbalance, a same cost - All var cost - All same cost - One var cost - One](https://image.slidesharecdn.com/imt-v3-091119031827-phpapp02/85/Energy-Efficient-Wireless-Internet-Access-74-320.jpg)


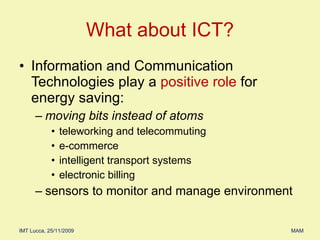
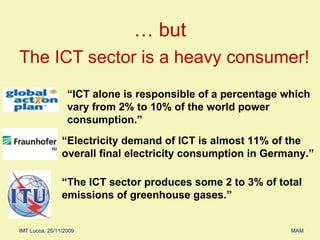
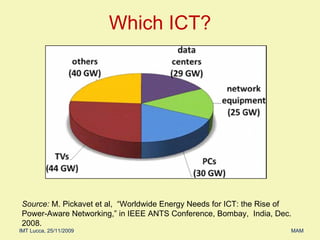
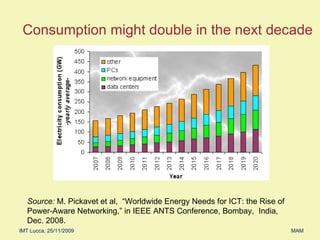
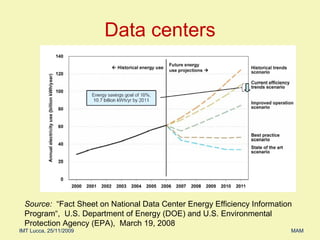
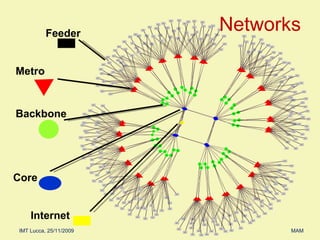
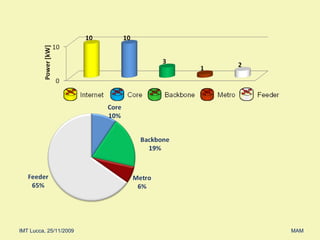
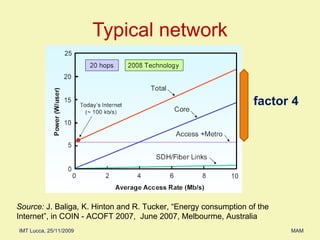
The document discusses the urgent need for energy-efficient wireless internet access and the implications of energy consumption in information and communication technologies (ICT). It highlights that ICT is responsible for a significant portion of global energy usage and greenhouse gas emissions, while also detailing various strategies to reduce energy consumption in networks, such as optimizing data centers and implementing dynamic network planning. The overarching emphasis is on the integration of 'green networking' practices to mitigate climate change and improve energy efficiency in technology-related sectors.


![Evs16 h13 [jp]act06 experinece of inducive charging](https://cdn.slidesharecdn.com/ss_thumbnails/evs16-h13jpact06experineceofinducivecharging-210921014051-thumbnail.jpg?width=640&height=640&fit=bounds)