SlideShare a Scribd company logo
1 of 1
Download to read offline
Emotional Quality of Life in Boys and Girls with Asthma 10 to 13 Years of Age
                                                        Noreen M. Clark, PhD1; Julie A. Dodge, RN MS1; Smita Shah, MBChB, MCH2; Roderick J.A. Little, PhD1; Rebecca R. Andridge, MS1; Daniel F. Awad, MA1; James Y. Paton, MD3
                                                                                                         1University of Michigan, 2University of Sidney, 3University of Glasgow


                                                                                   Table 1. Baseline Demographics and Health Status, Overall and by Gender                                                                                                                                                                                                     Table 3.Variables Associated with Emotional QL, by Gender
                       INTRODUCTION                                                                                                                                                                                                                             MEASURES                                                                                                                                                         P-Value
                                                                                                              Overall                         Males                         Females
                                                                                                              (N=776)                        (N=392)                        (N=384)                 p-value*                                                                                                                                                                                            Difference in              by                  P-value
The transition from childhood to adolescence is an important                                                                                                                                                   •Juniper Pediatric Asthma Quality of Life Questionnaire*:                                                                 Effect                   Comparison                                EQL                  gender             Boys vs Girls
                                                                       Demographics                                                                                                                            This measure contains 23 items that comprise three domains: activity limitation (5 
period for physical, social, and emotional development.  As they                                                                                                                                                                                                                                                                         Age                      +1 year                  Boys              -0.08                 0.49
                                                                                                                                                                                                                                                                                                                                                                                                                                                         0.16
                                                                                                                                                                                                               items); symptoms (10 items); and emotional quality of life (8 items). Results are 
move into and through adolescence, children with asthma need to        Age (Mean, SD)                       11.6 (0.6)                     11.7 (0.7)                      11.6 (0.6)                 0.02                                                                                                                                                                                 Girls             -0.31                 0.02
                                                                                                                                                                                                               expressed as a mean quality of life ranging from 1‐7 (low‐high). 
learn to recognize and treat symptoms independently in addition        African-American Race                 744 (96%)                      374 (95%)                      370 (96%)                  0.71     * Juniper EF, Guyatt, GH, Feeny, DH, Ferrie, PJ, Griffith, LE, Townshend, M. (1995). Measuring quality of life in         BMI Z-score              +1 unit                  Boys              -0.06                 0.28
                                                                                                                                                                                                                                                                                                                                                                                                                                                         0.42
to negotiating normal developmental tasks.  Little is available to     Parent Education
                                                                                                                                                                                                               children with asthma. Quality of Life Research: 5; 35‐46.
                                                                                                                                                                                                                                                                                                                                                                                           Girls             -0.13                 0.04
describe children with asthma in the pre teen age range (10‐13                                                                                                                                                 •BMI‐for‐age Z‐scores: BMI‐for‐age Z‐scores were calculated using the 2000 CDC Body 
                                                                                                                                                                                                                                                                                                                                         Yearly Income            <$15K vs >$15K           Boys              -0.23                 0.13
                                                                         Less than High School               142 (18%)                        77 (20%)                       65 (17%)                 0.58     Mass Index‐For‐Age Charts.  A Z‐score of zero is the population average.                                                                                                                                                                  0.78
years of age) as they begin this transition to autonomy and face                                                                                                                                                                                                                                                                                                                           Girls             -0.28                 0.06
                                                                                                                                                                                                               •Symptom Assessment: Parents reported day and nighttime asthma symptoms 
increasing disease management challenges.   In the study reported        High School graduate                280 (36%)                      141 (36%)                      139 (36%)
                                                                                                                                                                                                               experienced by the child in the past 12 months.  Symptom data were provided in a form                                     Symptom Nights           50% increase             Boys              -0.01                 0.40
                                                                                                                                                                                                                                                                                                                                                                                                                                                         0.24
here, asthma related emotional quality of life (EQOL) was                More than High School               354 (46%)                      174 (44%)                      180 (47%)                           developed by the researchers and based on the NAEPP national guidelines. 
                                                                                                                                                                                                                                                                                                                                                                                           Girls             -0.04                 0.01
hypothesized to be at risk as children move through this often                                                                                                                                                 •Asthma Diagnosis: Parents were asked to respond to the question, "Has a doctor or 
                                                                       Household Income
unsettling life phase.                                                                                                                                                                                         other health care provider ever told you that your child has asthma?"                                                     Data were analyzed to assess the relationship of symptoms and demographic factors
                                                                         < $15,000                           349 (45%)                      166 (42%)                      183 (48%)                  0.01     •Medication Use: Parents were asked to list the specific medications that their child                                     to asthma-related emotional quality of life. Among girls, increasing age (p=.02),
                                                                                                                                                                                                               currently takes for "asthma, wheezing, tightness in the chest, shortness of breath, or                                    increasing BMI (p=.04), an increase in nighttime symptoms (p=.01), and living in a
                                                                         $15,000-$40,000                     315 (41%)                      159 (41%)                      156 (41%)
                                                                                                                                                                                                               cough" and the form of administration.                                                                                    lower income household (p=.06) were associated with a decrease in emotional quality
                                                                         > $40,000                           112 (14%)                        67 (17%)                       45 (12%)                          •Demographics: Standard demographic items include child's age, gender,                                                    of life. None of these variables were significantly associated with a decrease in
                       METHODOLOGY                                                                                                                                                                             race/ethnicity, parent education level, and household income.                                                             emotional quality of life in the boys. No differences between boys and girls were
                                                                       Health
                                                                                                                                                                                                                                                                                                                                         statistically significant.
•As part of a randomized controlled trial to evaluate two self‐        BMI-for-age Z-score
                                                                       (Mean, SD)                             1.1 (1.3)                                       1.0 (1.3)                    1.1 (1.2)
management interventions for pre‐teens, case identification was 
                                                                       Quality of Life, Emotions
                                                                                                                                                                                                                                                                                                                                                                                       CONCLUSIONS
initiated by distributing a recruitment packet, including an asthma    (Mean, SD)                             5.3 (1.5)                                       5.3 (1.5)                    5.2 (1.5)                                               STATISTICAL METHODS                                                                   •     Despite high levels of nighttime symptom frequency about one‐third of respondents say 
symptom questionnaire, to all 6th grade students attending 19          Asthma Status
                                                                                                                                                                                                                                                                                                                                               they were never told by a physician that they have asthma.
                                                                       Asthma Symptom Days,
middle schools in Detroit, Michigan. The packets were sent home        past year                                                                                                                               Both emotional quality of life and symptom level were modeled using linear mixed 
                                                                                                                                                                                                                                                                                                                                         •     Factors associated with increased nighttime symptoms in these African American middle 
                                                                                                                                                                                                               models. Symptom counts were log‐transformed to better approximate normality. Each 
with children, completed by the parent/guardian, and returned to          None                                82 (11%)                                         39 (10%)                     43 (11%)                                                                                                                                           school students include BMI and very low income.
                                                                                                                                                                                                               predictor variable was used separately (along with the gender indicator and its 
the schools (return rate of 71.3%).                                                                                                                                                                            interaction) to predict the outcomes. Unadjusted models were used since we were                                           •     The data suggest that asthma related emotional quality of life in African American girls 
                                                                          1 - 12 days                        149 (19%)                                         67 (17%)                     82 (21%)                                                                                                                                           declines as they advance in age, increase in BMI, and experience more asthma 
                                                                                                                                                                                                               interested in what was univariately associated with the outcomes. Since schools were 
                                                                          13 - 52 days                       206 (27%)                                       111 (28%)                      95 (25%)           the unit of randomization, all models included a random effect for the school within                                            symptoms.  In addition, very low income appears to be associated with decreased 
•A total of 906 low income African American children with asthma                                                                                                                                               recruitment year. Statistical analyses were done using the SAS System, version 9.1.                                             emotional quality of life in these preteen girls with asthma. 
symptoms and their parent/guardians agreed to participate in the          53 - 365 days                      208 (27%)                                       105 (27%)                    103 (27%)

study and completed baseline data collection. Research staff              > 365 days                         131 (17%)                                         70 (18%)                     61 (16%)
                                                                       Asthma Symptom Nights,
interviewed the children face‐to‐face at school while the parents      past year
were interviewed by telephone.  The current findings are based on 
a sample of 776 parents and children with complete data on the 
                                                                                                                                                                                                                                                                   RESULTS
                                                                         None                                150 (20%)                        70 (18%)                       80 (21%)                 0.12
variables being evaluated.                                               1 - 12 nights                       202 (27%)                        97 (25%)                     105 (27%)
                                                                                                                                                                                                                                Table 2. Variables Associated with Nighttime Symptoms, by Gender
                                                                                                                                                                                                                                                                                                                                                                                       IMPLICATIONS
                                                                         13 - 52 nights                      167 (22%)                      103 (26%)                        64 (24%)                                                                                        % Increase in            P-Value              P-value
                                                                                                                                                                                                               Effect                    Comparison                           Symptoms               by gender           Boys vs Girls   •Low‐income African‐American children may need special consideration in asthma 
                                                                         53 – 365 nights                     146 (20%)                        78 (20%)                       68 (18%)
                                                                                                                                                                                                               Age                       +1 year                Boys              -2%                   0.90
                                                                                                                                                                                                                                                                                                                                         counseling and patient education.  Targeting those of low income is important given that 
                                                                                                                                                                                                                                                                                                                              0.45       low income was associated with both increased nighttime symptoms and decreased 
                                                                         > 365 nights                         81 (11%)                        44 (11%)                       37 (10%)
    BASELINE DESCRIPTION OF SAMPLE (N=776)                             Ever Diagnosed with
                                                                                                                                                                                                                                                                Girls             17%                   0.38
                                                                                                                                                                                                                                                                                                                                         emotional quality of life in this urban, middle school population.  
                                                                       Asthma                                477 (62%)                      260 (66%)                      217 (57%)                  0.01     BMI Z-score               +1 unit                Boys              20%                   0.02
                                                                                                                                                                                                                                                                                                                              0.71       •Programs might also be offered separately for boys and girls to address gender‐specific 
The mean age at baseline was 11.6 years. Fifty‐one percent (51%)       Uses a Bronchodilator                 415 (54%)                      230 (59%)                      185 (49%)                 0.003
                                                                                                                                                                                                                                                                Girls             26%                   0.01                             issues related to asthma self‐management.  
of the students were male, while 96% were African‐American.                                                                                                                                                    Yearly Income             <$15K vs >$15K         Boys              11%                   0.62                             •Efforts to address excess weight and related factors such as diet and activity are also 
                                                                       Uses an Anti-Inflammatory             160 (21%)                        98 (25%)                       62 (16%)                0.002                                                                                                                    0.16
                                                                                                                                                                                                                                                                                                                                         indicated by these study findings and are supported by recent data that demonstrate the 
Forty‐five percent (45%) reported living in households with an                                                                                                                                                                                                  Girls             67%                   0.01
                                                                                                                                                                                                                                                                                                                                         poorly understood association between pediatric asthma and overweight status (Abramson, 
annual income of less than $15,000.  While all of the children         Uses No Asthma Meds                   344 (45%)                      151 (39%)                      193 (51%)                 0.001
                                                                                                                                                                                                               Nighttime symptoms increased with higher BMI for both girls (p=.02) and boys (p=.01).                                     et al, 2008). *
reported symptoms of asthma on the case identification                   None                                150 (20%)                        70 (18%)                       80 (21%)                 0.12     Nighttime symptom counts were significantly higher (p=.01) for girls living in households with                            Actions such as these may improve the symptom experience and emotional quality of life of early adolescent children, 
                                                                                                                                                                                                                                                                                                                                         especially girls, with asthma.  
questionnaire, only 62% reported having ever been told by a                                                                                                                                                    an annual income less than $15,000 compared to households with income above $15,000.
                                                                                   All percentages use the number of valid responses as the denominator. Valid percentages range from 96 to 100%.              Despite apparent differences in point estimates there were no statistically significant differences                       *Abramson, NW, Wamboldt, FS, Mansell, AL, Carter, R, Federico, MJ, Wamboldt, MZ. (2008). Frequency and  correlates of 
health care provider that they had asthma.                                         *Comparisons made using linear and non-linear mixed models with a random effect for the school within cohort.               in these effects comparing boys to girls.                                                                                 overweight status in adolescent asthma. Journal of Asthma: 45; 135‐139. 

More Related Content

More from Center for Managing Chronic Disease

Self regulation the continuous and reciprocal nature of self regulation
Self regulation the continuous and reciprocal nature of self regulationSelf regulation the continuous and reciprocal nature of self regulation
Self regulation the continuous and reciprocal nature of self regulation
Center for Managing Chronic Disease
 

More from Center for Managing Chronic Disease (20)

2013 womens health_poster_ver.2
2013 womens health_poster_ver.22013 womens health_poster_ver.2
2013 womens health_poster_ver.2
 
Kamerow 10 12 ada forum poster - final.pdf
Kamerow 10 12 ada forum poster - final.pdfKamerow 10 12 ada forum poster - final.pdf
Kamerow 10 12 ada forum poster - final.pdf
 
Wca womens health_poster_final
Wca womens health_poster_finalWca womens health_poster_final
Wca womens health_poster_final
 
Development of a Health Game to Promote Self-Management Skills Among Adolesc...
Development of a Health Game to Promote Self-Management Skills  Among Adolesc...Development of a Health Game to Promote Self-Management Skills  Among Adolesc...
Development of a Health Game to Promote Self-Management Skills Among Adolesc...
 
Developing an Integrated Text Messaging Care Management Program for Diabetes
Developing an Integrated Text Messaging Care Management Program for DiabetesDeveloping an Integrated Text Messaging Care Management Program for Diabetes
Developing an Integrated Text Messaging Care Management Program for Diabetes
 
Integration of Clinical Care and Public Health Systems: The need as reflected...
Integration of Clinical Care and Public Health Systems: The need as reflected...Integration of Clinical Care and Public Health Systems: The need as reflected...
Integration of Clinical Care and Public Health Systems: The need as reflected...
 
Photos from the Summit
Photos from the SummitPhotos from the Summit
Photos from the Summit
 
Organizational Policy and Systems Change
Organizational Policy and Systems ChangeOrganizational Policy and Systems Change
Organizational Policy and Systems Change
 
PACE Australia Intervention
PACE Australia InterventionPACE Australia Intervention
PACE Australia Intervention
 
Mobilizing the faith community for diabetes prevention and control
Mobilizing the faith community for diabetes prevention and controlMobilizing the faith community for diabetes prevention and control
Mobilizing the faith community for diabetes prevention and control
 
Improving Diabetes Care and Outcomes on the South Side of Chicago
Improving Diabetes Care and Outcomes on the South Side of ChicagoImproving Diabetes Care and Outcomes on the South Side of Chicago
Improving Diabetes Care and Outcomes on the South Side of Chicago
 
Camden Citywide Diabetes Collaborative
Camden Citywide Diabetes CollaborativeCamden Citywide Diabetes Collaborative
Camden Citywide Diabetes Collaborative
 
Diabetes Equity Project, Dallas, Texas
Diabetes Equity Project, Dallas, TexasDiabetes Equity Project, Dallas, Texas
Diabetes Equity Project, Dallas, Texas
 
Wind River Reservation: Reducing Diabetes Disparities in American Indian Com...
Wind River Reservation: Reducing Diabetes Disparities in  American Indian Com...Wind River Reservation: Reducing Diabetes Disparities in  American Indian Com...
Wind River Reservation: Reducing Diabetes Disparities in American Indian Com...
 
The Alliance to Reduce Disparities in Diabetes: Advancing Policy and Systems ...
The Alliance to Reduce Disparities in Diabetes: Advancing Policy and Systems ...The Alliance to Reduce Disparities in Diabetes: Advancing Policy and Systems ...
The Alliance to Reduce Disparities in Diabetes: Advancing Policy and Systems ...
 
The Alliance to Reduce Disparities in Diabetes: An Overview
The Alliance to Reduce Disparities in Diabetes: An OverviewThe Alliance to Reduce Disparities in Diabetes: An Overview
The Alliance to Reduce Disparities in Diabetes: An Overview
 
Obesity poster20071109
Obesity poster20071109Obesity poster20071109
Obesity poster20071109
 
Self regulation the continuous and reciprocal nature of self regulation
Self regulation the continuous and reciprocal nature of self regulationSelf regulation the continuous and reciprocal nature of self regulation
Self regulation the continuous and reciprocal nature of self regulation
 
Perceived caregiver financial barriers and asthma outcomes in urban elementar...
Perceived caregiver financial barriers and asthma outcomes in urban elementar...Perceived caregiver financial barriers and asthma outcomes in urban elementar...
Perceived caregiver financial barriers and asthma outcomes in urban elementar...
 
Using outcomes of interest to plan asthma programs.
Using outcomes of interest to plan asthma programs.Using outcomes of interest to plan asthma programs.
Using outcomes of interest to plan asthma programs.
 

Emotional quality of life in boys and girls with asthma 10 to 13 years of age

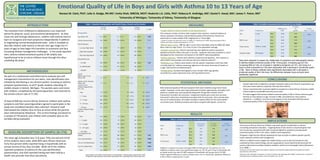
  • 1. Emotional Quality of Life in Boys and Girls with Asthma 10 to 13 Years of Age Noreen M. Clark, PhD1; Julie A. Dodge, RN MS1; Smita Shah, MBChB, MCH2; Roderick J.A. Little, PhD1; Rebecca R. Andridge, MS1; Daniel F. Awad, MA1; James Y. Paton, MD3 1University of Michigan, 2University of Sidney, 3University of Glasgow Table 1. Baseline Demographics and Health Status, Overall and by Gender Table 3.Variables Associated with Emotional QL, by Gender INTRODUCTION MEASURES P-Value Overall Males Females (N=776) (N=392) (N=384) p-value* Difference in by P-value The transition from childhood to adolescence is an important  •Juniper Pediatric Asthma Quality of Life Questionnaire*:   Effect Comparison EQL gender Boys vs Girls Demographics This measure contains 23 items that comprise three domains: activity limitation (5  period for physical, social, and emotional development.  As they Age +1 year Boys -0.08 0.49 0.16 items); symptoms (10 items); and emotional quality of life (8 items). Results are  move into and through adolescence, children with asthma need to  Age (Mean, SD) 11.6 (0.6) 11.7 (0.7) 11.6 (0.6) 0.02 Girls -0.31 0.02 expressed as a mean quality of life ranging from 1‐7 (low‐high).  learn to recognize and treat symptoms independently in addition  African-American Race 744 (96%) 374 (95%) 370 (96%) 0.71 * Juniper EF, Guyatt, GH, Feeny, DH, Ferrie, PJ, Griffith, LE, Townshend, M. (1995). Measuring quality of life in  BMI Z-score +1 unit Boys -0.06 0.28 0.42 to negotiating normal developmental tasks.  Little is available to  Parent Education children with asthma. Quality of Life Research: 5; 35‐46. Girls -0.13 0.04 describe children with asthma in the pre teen age range (10‐13  •BMI‐for‐age Z‐scores: BMI‐for‐age Z‐scores were calculated using the 2000 CDC Body  Yearly Income <$15K vs >$15K Boys -0.23 0.13 Less than High School 142 (18%) 77 (20%) 65 (17%) 0.58 Mass Index‐For‐Age Charts.  A Z‐score of zero is the population average. 0.78 years of age) as they begin this transition to autonomy and face Girls -0.28 0.06 •Symptom Assessment: Parents reported day and nighttime asthma symptoms  increasing disease management challenges.   In the study reported  High School graduate 280 (36%) 141 (36%) 139 (36%) experienced by the child in the past 12 months.  Symptom data were provided in a form  Symptom Nights 50% increase Boys -0.01 0.40 0.24 here, asthma related emotional quality of life (EQOL) was  More than High School 354 (46%) 174 (44%) 180 (47%) developed by the researchers and based on the NAEPP national guidelines.  Girls -0.04 0.01 hypothesized to be at risk as children move through this often  •Asthma Diagnosis: Parents were asked to respond to the question, "Has a doctor or  Household Income unsettling life phase. other health care provider ever told you that your child has asthma?"  Data were analyzed to assess the relationship of symptoms and demographic factors < $15,000 349 (45%) 166 (42%) 183 (48%) 0.01 •Medication Use: Parents were asked to list the specific medications that their child  to asthma-related emotional quality of life. Among girls, increasing age (p=.02), currently takes for "asthma, wheezing, tightness in the chest, shortness of breath, or  increasing BMI (p=.04), an increase in nighttime symptoms (p=.01), and living in a $15,000-$40,000 315 (41%) 159 (41%) 156 (41%) cough" and the form of administration.  lower income household (p=.06) were associated with a decrease in emotional quality > $40,000 112 (14%) 67 (17%) 45 (12%) •Demographics: Standard demographic items include child's age, gender,  of life. None of these variables were significantly associated with a decrease in METHODOLOGY race/ethnicity, parent education level, and household income. emotional quality of life in the boys. No differences between boys and girls were Health statistically significant. •As part of a randomized controlled trial to evaluate two self‐ BMI-for-age Z-score (Mean, SD) 1.1 (1.3) 1.0 (1.3) 1.1 (1.2) management interventions for pre‐teens, case identification was  Quality of Life, Emotions CONCLUSIONS initiated by distributing a recruitment packet, including an asthma  (Mean, SD) 5.3 (1.5) 5.3 (1.5) 5.2 (1.5) STATISTICAL METHODS • Despite high levels of nighttime symptom frequency about one‐third of respondents say  symptom questionnaire, to all 6th grade students attending 19  Asthma Status they were never told by a physician that they have asthma. Asthma Symptom Days, middle schools in Detroit, Michigan. The packets were sent home  past year Both emotional quality of life and symptom level were modeled using linear mixed  • Factors associated with increased nighttime symptoms in these African American middle  models. Symptom counts were log‐transformed to better approximate normality. Each  with children, completed by the parent/guardian, and returned to None 82 (11%) 39 (10%) 43 (11%) school students include BMI and very low income. predictor variable was used separately (along with the gender indicator and its  the schools (return rate of 71.3%).  interaction) to predict the outcomes. Unadjusted models were used since we were  • The data suggest that asthma related emotional quality of life in African American girls  1 - 12 days 149 (19%) 67 (17%) 82 (21%) declines as they advance in age, increase in BMI, and experience more asthma  interested in what was univariately associated with the outcomes. Since schools were  13 - 52 days 206 (27%) 111 (28%) 95 (25%) the unit of randomization, all models included a random effect for the school within  symptoms.  In addition, very low income appears to be associated with decreased  •A total of 906 low income African American children with asthma  recruitment year. Statistical analyses were done using the SAS System, version 9.1. emotional quality of life in these preteen girls with asthma.  symptoms and their parent/guardians agreed to participate in the 53 - 365 days 208 (27%) 105 (27%) 103 (27%) study and completed baseline data collection. Research staff  > 365 days 131 (17%) 70 (18%) 61 (16%) Asthma Symptom Nights, interviewed the children face‐to‐face at school while the parents  past year were interviewed by telephone.  The current findings are based on  a sample of 776 parents and children with complete data on the  RESULTS None 150 (20%) 70 (18%) 80 (21%) 0.12 variables being evaluated. 1 - 12 nights 202 (27%) 97 (25%) 105 (27%) Table 2. Variables Associated with Nighttime Symptoms, by Gender IMPLICATIONS 13 - 52 nights 167 (22%) 103 (26%) 64 (24%) % Increase in P-Value P-value Effect Comparison Symptoms by gender Boys vs Girls •Low‐income African‐American children may need special consideration in asthma  53 – 365 nights 146 (20%) 78 (20%) 68 (18%) Age +1 year Boys -2% 0.90 counseling and patient education.  Targeting those of low income is important given that  0.45 low income was associated with both increased nighttime symptoms and decreased  > 365 nights 81 (11%) 44 (11%) 37 (10%) BASELINE DESCRIPTION OF SAMPLE (N=776) Ever Diagnosed with Girls 17% 0.38 emotional quality of life in this urban, middle school population.   Asthma 477 (62%) 260 (66%) 217 (57%) 0.01 BMI Z-score +1 unit Boys 20% 0.02 0.71 •Programs might also be offered separately for boys and girls to address gender‐specific  The mean age at baseline was 11.6 years. Fifty‐one percent (51%)  Uses a Bronchodilator 415 (54%) 230 (59%) 185 (49%) 0.003 Girls 26% 0.01 issues related to asthma self‐management.   of the students were male, while 96% were African‐American.   Yearly Income <$15K vs >$15K Boys 11% 0.62 •Efforts to address excess weight and related factors such as diet and activity are also  Uses an Anti-Inflammatory 160 (21%) 98 (25%) 62 (16%) 0.002 0.16 indicated by these study findings and are supported by recent data that demonstrate the  Forty‐five percent (45%) reported living in households with an  Girls 67% 0.01 poorly understood association between pediatric asthma and overweight status (Abramson,  annual income of less than $15,000.  While all of the children  Uses No Asthma Meds 344 (45%) 151 (39%) 193 (51%) 0.001 Nighttime symptoms increased with higher BMI for both girls (p=.02) and boys (p=.01). et al, 2008). * reported symptoms of asthma on the case identification  None 150 (20%) 70 (18%) 80 (21%) 0.12 Nighttime symptom counts were significantly higher (p=.01) for girls living in households with Actions such as these may improve the symptom experience and emotional quality of life of early adolescent children,  especially girls, with asthma.   questionnaire, only 62% reported having ever been told by a  an annual income less than $15,000 compared to households with income above $15,000. All percentages use the number of valid responses as the denominator. Valid percentages range from 96 to 100%. Despite apparent differences in point estimates there were no statistically significant differences *Abramson, NW, Wamboldt, FS, Mansell, AL, Carter, R, Federico, MJ, Wamboldt, MZ. (2008). Frequency and  correlates of  health care provider that they had asthma. *Comparisons made using linear and non-linear mixed models with a random effect for the school within cohort. in these effects comparing boys to girls. overweight status in adolescent asthma. Journal of Asthma: 45; 135‐139.