Download as PDF, PPTX

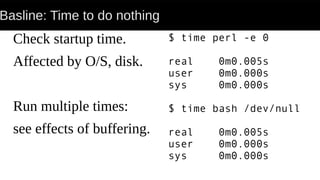
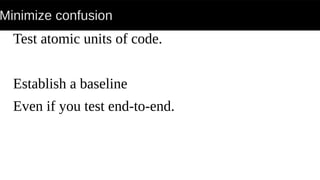
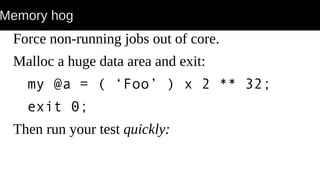
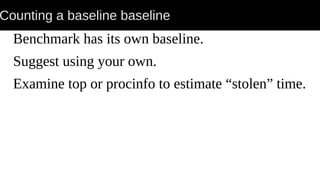
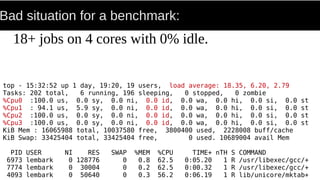
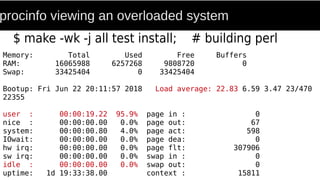
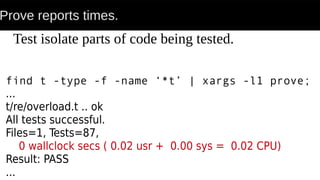
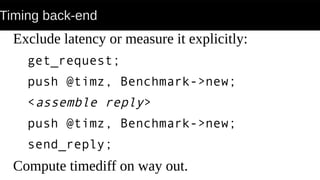
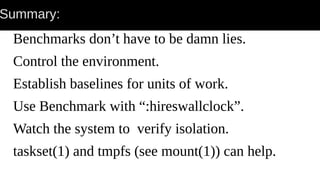

The document discusses benchmarks, emphasizing the difference between performance and functionality measurements and the importance of controlled testing environments. It outlines methods to minimize confusion and obtain accurate timing data for software and hardware tests while setting baselines for various units of work. The author advocates for specific strategies to avoid common pitfalls in benchmarking, including the use of the Perl benchmarking tools and monitoring system performance during tests.


![Getting Started with Apache Spark: Big Data Made Simple [Free Meetup]](https://cdn.slidesharecdn.com/ss_thumbnails/apachesparkgettingstarted-260203175547-8361bcc3-thumbnail.jpg?width=640&height=640&fit=bounds)


