Download free for 30 days
Sign in
Upload
Language (EN)
Support
Business
Mobile
Social Media
Marketing
Technology
Art & Photos
Career
Design
Education
Presentations & Public Speaking
Government & Nonprofit
Healthcare
Internet
Law
Leadership & Management
Automotive
Engineering
Software
Recruiting & HR
Retail
Sales
Services
Science
Small Business & Entrepreneurship
Food
Environment
Economy & Finance
Data & Analytics
Investor Relations
Sports
Spiritual
News & Politics
Travel
Self Improvement
Real Estate
Entertainment & Humor
Health & Medicine
Devices & Hardware
Lifestyle
Change Language
Language
English
Español
Português
Français
Deutsche
Cancel
Save
Submit search
EN
Uploaded by
Abdul Kadarusno
2,751 views
Durbin watson
Jenis Uji Statistik
Presentations & Public Speaking
◦
Read more
0
Save
Share
Embed
Embed presentation
Download
Download to read offline
1
/ 4
2
/ 4
Most read
3
/ 4
Most read
4
/ 4
Most read
More Related Content
PDF
Tabla distribución t de student
by
davinsonbmx
PDF
Tabla z
by
fredsaint
PDF
Tabla-F-Fisher-2-colas.pdf
by
SergioJ11
PDF
Tablas, estadistica
by
Allan Mejia Ramirez
XLSX
Ejemplo Prueba De Medias
by
Instituto Tecnologico De Pachuca
DOCX
Trabajo de microeconomía
by
Carlos Eduardo Quisse Sánchez
PDF
Tablas Kolmogorov-Smirnov
by
Byron Pérez
DOC
Tabla distribución normal 1 cola z=0 a derecha
by
Francisco Molina
Tabla distribución t de student
by
davinsonbmx
Tabla z
by
fredsaint
Tabla-F-Fisher-2-colas.pdf
by
SergioJ11
Tablas, estadistica
by
Allan Mejia Ramirez
Ejemplo Prueba De Medias
by
Instituto Tecnologico De Pachuca
Trabajo de microeconomía
by
Carlos Eduardo Quisse Sánchez
Tablas Kolmogorov-Smirnov
by
Byron Pérez
Tabla distribución normal 1 cola z=0 a derecha
by
Francisco Molina
What's hot
PDF
Tablas de factores de valor presente y valor futuro cantidad única y anualidades
by
Omaira Barca
XLS
Problema De Regresion Lineal
by
guestb9bf58
PDF
Tabla chi cuadrado
by
Univ Peruana Los Andes
PDF
Tabla de chi-cuadrado
by
Fer´ 2012
PPTX
Ejercicios 1 4 regreción y correlación
by
sontorito0o
PDF
Procesos estocasticos y cadenas de markov
by
Jhon Ericson Juarez Alburqueque
PDF
Análisis de Regresión Múltiple
by
Universidad Nacional Mayor de San Marcos
TXT
72116073 fundamentos-de-ingenieria-economica
by
cgviviana
PPTX
Algoritmo congruencial multiplicativo y prueba de medias u otavalo
by
Roberth Burgos
ODP
Método de gauss
by
pepemunoz
DOCX
Expo 2 método de dos fases
by
Ayda Ramirez Montalvo
PDF
Series de Tiempo Regresión
by
Norlan0987
DOCX
Subir tarea estadistica chi cuadrado
by
Andy Shalom
DOC
Pronósticos
by
María Guadalupe Rodríguez Marthell
PDF
Tabla chi cuadrado
by
pilosofando
PDF
Tabla Chi cuadrado PSPP
by
Mauricio Medina
PDF
Ejercicios sesion 3 resuelto
by
Mario Laura
PDF
Tabla t
by
GOPPASUDD
DOCX
Estadistica inferencial 2 Relaciones covarianzas y varianzas
by
Genesis Acosta
DOCX
2.ejeercicios
by
zooneerborre
Tablas de factores de valor presente y valor futuro cantidad única y anualidades
by
Omaira Barca
Problema De Regresion Lineal
by
guestb9bf58
Tabla chi cuadrado
by
Univ Peruana Los Andes
Tabla de chi-cuadrado
by
Fer´ 2012
Ejercicios 1 4 regreción y correlación
by
sontorito0o
Procesos estocasticos y cadenas de markov
by
Jhon Ericson Juarez Alburqueque
Análisis de Regresión Múltiple
by
Universidad Nacional Mayor de San Marcos
72116073 fundamentos-de-ingenieria-economica
by
cgviviana
Algoritmo congruencial multiplicativo y prueba de medias u otavalo
by
Roberth Burgos
Método de gauss
by
pepemunoz
Expo 2 método de dos fases
by
Ayda Ramirez Montalvo
Series de Tiempo Regresión
by
Norlan0987
Subir tarea estadistica chi cuadrado
by
Andy Shalom
Pronósticos
by
María Guadalupe Rodríguez Marthell
Tabla chi cuadrado
by
pilosofando
Tabla Chi cuadrado PSPP
by
Mauricio Medina
Ejercicios sesion 3 resuelto
by
Mario Laura
Tabla t
by
GOPPASUDD
Estadistica inferencial 2 Relaciones covarianzas y varianzas
by
Genesis Acosta
2.ejeercicios
by
zooneerborre
Durbin watson
1.
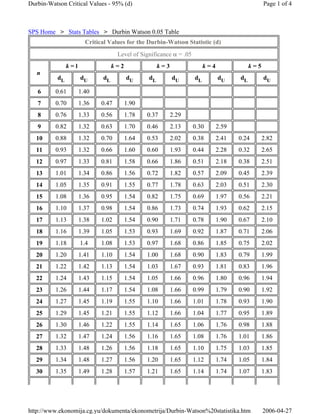
SPS Home >
Stats Tables > Durbin Watson 0.05 Table Critical Values for the Durbin-Watson Statistic (d) Level of Significance α = .05 n k = l k = 2 k = 3 k = 4 k = 5 dL dU dL dU dL dU dL dU dL dU 6 0.61 1.40 7 0.70 1.36 0.47 1.90 8 0.76 1.33 0.56 1.78 0.37 2.29 9 0.82 1.32 0.63 1.70 0.46 2.13 0.30 2.59 10 0.88 1.32 0.70 1.64 0.53 2.02 0.38 2.41 0.24 2.82 11 0.93 1.32 0.66 1.60 0.60 1.93 0.44 2.28 0.32 2.65 12 0.97 1.33 0.81 1.58 0.66 1.86 0.51 2.18 0.38 2.51 13 1.01 1.34 0.86 1.56 0.72 1.82 0.57 2.09 0.45 2.39 14 1.05 1.35 0.91 1.55 0.77 1.78 0.63 2.03 0.51 2.30 15 1.08 1.36 0.95 1.54 0.82 1.75 0.69 1.97 0.56 2.21 16 1.10 1.37 0.98 1.54 0.86 1.73 0.74 1.93 0.62 2.15 17 1.13 1.38 1.02 1.54 0.90 1.71 0.78 1.90 0.67 2.10 18 1.16 1.39 1.05 1.53 0.93 1.69 0.92 1.87 0.71 2.06 19 1.18 1.4 1.08 1.53 0.97 1.68 0.86 1.85 0.75 2.02 20 1.20 1.41 1.10 1.54 1.00 1.68 0.90 1.83 0.79 1.99 21 1.22 1.42 1.13 1.54 1.03 1.67 0.93 1.81 0.83 1.96 22 1.24 1.43 1.15 1.54 1.05 1.66 0.96 1.80 0.96 1.94 23 1.26 1.44 1.17 1.54 1.08 1.66 0.99 1.79 0.90 1.92 24 1.27 1.45 1.19 1.55 1.10 1.66 1.01 1.78 0.93 1.90 25 1.29 1.45 1.21 1.55 1.12 1.66 1.04 1.77 0.95 1.89 26 1.30 1.46 1.22 1.55 1.14 1.65 1.06 1.76 0.98 1.88 27 1.32 1.47 1.24 1.56 1.16 1.65 1.08 1.76 1.01 1.86 28 1.33 1.48 1.26 1.56 1.18 1.65 1.10 1.75 1.03 1.85 29 1.34 1.48 1.27 1.56 1.20 1.65 1.12 1.74 1.05 1.84 30 1.35 1.49 1.28 1.57 1.21 1.65 1.14 1.74 1.07 1.83 Page 1 of 4Durbin-Watson Critical Values - 95% (d) 2006-04-27http://www.ekonomija.cg.yu/dokumenta/ekonometrija/Durbin-Watson%20statistika.htm
2.
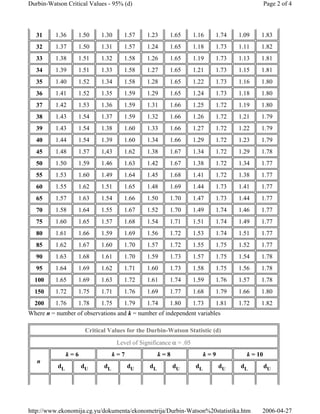
Where n =
number of observations and k = number of independent variables 31 1.36 1.50 1.30 1.57 1.23 1.65 1.16 1.74 1.09 1.83 32 1.37 1.50 1.31 1.57 1.24 1.65 1.18 1.73 1.11 1.82 33 1.38 1.51 1.32 1.58 1.26 1.65 1.19 1.73 1.13 1.81 34 1.39 1.51 1.33 1.58 1.27 1.65 1.21 1.73 1.15 1.81 35 1.40 1.52 1.34 1.58 1.28 1.65 1.22 1.73 1.16 1.80 36 1.41 1.52 1.35 1.59 1.29 1.65 1.24 1.73 1.18 1.80 37 1.42 1.53 1.36 1.59 1.31 1.66 1.25 1.72 1.19 1.80 38 1.43 1.54 1.37 1.59 1.32 1.66 1.26 1.72 1.21 1.79 39 1.43 1.54 1.38 1.60 1.33 1.66 1.27 1.72 1.22 1.79 40 1.44 1.54 1.39 1.60 1.34 1.66 1.29 1.72 1.23 1.79 45 1.48 1.57 1,43 1.62 1.38 1.67 1.34 1.72 1.29 1.78 50 1.50 1.59 1.46 1.63 1.42 1.67 1.38 1.72 1.34 1.77 55 1.53 1.60 1.49 1.64 1.45 1.68 1.41 1.72 1.38 1.77 60 1.55 1.62 1.51 1.65 1.48 1.69 1.44 1.73 1.41 1.77 65 1.57 1.63 1.54 1.66 1.50 1.70 1.47 1.73 1.44 1.77 70 1.58 1.64 1.55 1.67 1.52 1.70 1.49 1.74 1.46 1.77 75 1.60 1.65 1.57 1.68 1.54 1.71 1.51 1.74 1.49 1.77 80 1.61 1.66 1.59 1.69 1.56 1.72 1.53 1.74 1.51 1.77 85 1.62 1.67 1.60 1.70 1.57 1.72 1.55 1.75 1.52 1.77 90 1.63 1.68 1.61 1.70 1.59 1.73 1.57 1.75 1.54 1.78 95 1.64 1.69 1.62 1.71 1.60 1.73 1.58 1.75 1.56 1.78 100 1.65 1.69 1.63 1.72 1.61 1.74 1.59 1.76 1.57 1.78 150 1.72 1.75 1.71 1.76 1.69 1.77 1.68 1.79 1.66 1.80 200 1.76 1.78 1.75 1.79 1.74 1.80 1.73 1.81 1.72 1.82 Critical Values for the Durbin-Watson Statistic (d) Level of Significance α = .05 n k = 6 k = 7 k = 8 k = 9 k = 10 dL dU dL dU dL dU dL dU dL dU Page 2 of 4Durbin-Watson Critical Values - 95% (d) 2006-04-27http://www.ekonomija.cg.yu/dokumenta/ekonometrija/Durbin-Watson%20statistika.htm
3.
11 0.20 3.01 12
0.27 2.83 0.17 3.15 13 0.33 2.70 0.23 2.99 0.15 3.27 14 0.39 2.57 0.29 2.85 0.20 3.11 0.13 3.36 15 0.45 2.47 0.34 2.73 0.25 2.98 0.18 3.22 0.11 3.44 16 0.50 2.39 0.40 2.62 0.30 2.86 0.22 3.09 0.16 3.30 17 0.55 2.32 0.45 2.54 0.36 2.76 0.27 2.98 0.20 3.18 18 0.60 2.26 0.50 2.47 0.41 2.67 0.32 2.87 0.24 3.07 19 0.65 2.21 0.55 2.40 0.46 2.59 0.37 2.78 0.29 2.97 20 0.69 2.16 0.60 2.34 0.50 2.52 0.42 2.70 0.34 2.89 21 0.73 2.12 0.64 2.30 0.55 2.46 0.46 2.63 0.38 2.81 22 0.77 2.09 0.68 2.25 0.59 2.41 0.51 2.57 0.42 2.73 23 0.80 2.06 0.72 2.21 0.63 2.36 0.55 2.51 0.47 2.67 24 0.84 2.04 0.75 2.17 0.67 2.32 0.58 2.46 0.51 2.61 25 0.87 2.01 0.78 2.14 0.70 2.28 0.62 2.42 0.54 2.56 26 0.90 1.99 0.82 2.12 0.74 2.24 0.66 2.38 0.58 2.51 27 0.93 1.97 0.85 2.09 0.77 2.22 0.69 2.34 0.62 2.47 28 0.95 1.96 0.87 2.07 0.80 2.19 0.72 2.31 0.65 2.43 29 0.98 1.94 0.90 2.05 0.83 2.16 0.75 2.28 0.68 2.40 30 1.00 1.93 0.93 2.03 0.85 2.14 0.78 2.25 0.71 2.36 31 1.02 1.92 0.95 2.02 0.88 2.12 0.81 2.23 074 2.33 32 1.04 1.91 0.97 2.00 0.90 2.10 0.84 2.20 0.77 2.31 33 1.06 1.90 0.99 1.99 0.93 2.09 0.86 2.18 0.80 2.28 34 1.08 1.89 1.02 1.98 0.95 2.07 0.89 2.16 0.82 2.26 35 1.10 1.88 1.03 1.97 0.97 2.05 0.91 2.14 0.85 2.24 36 1.11 1.88 1.05 1.96 0.99 2.04 0.93 2.13 0.87 2.22 37 1.13 1.87 1.07 1.95 1.01 2.03 0.95 2.11 0.89 2.20 38 1.50 1.86 1.09 1.94 1.03 2.02 0.97 2.10 0.91 2.18 39 1.16 1.86 1.10 1.93 1.05 2.01 0.99 2.09 0.93 2.16 40 1.18 1.85 1.12 1.92 1.06 2.00 1.01 2.07 0.95 2.15 Page 3 of 4Durbin-Watson Critical Values - 95% (d) 2006-04-27http://www.ekonomija.cg.yu/dokumenta/ekonometrija/Durbin-Watson%20statistika.htm
4.
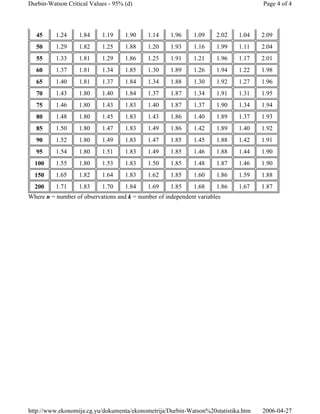
Where n =
number of observations and k = number of independent variables 45 1.24 1.84 1.19 1.90 1.14 1.96 1.09 2.02 1.04 2.09 50 1.29 1.82 1.25 1.88 1.20 1.93 1.16 1.99 1.11 2.04 55 1.33 1.81 1.29 1.86 1.25 1.91 1.21 1.96 1.17 2.01 60 1.37 1.81 1.34 1.85 1.30 1.89 1.26 1.94 1.22 1.98 65 1.40 1.81 1.37 1.84 1.34 1.88 1.30 1.92 1.27 1.96 70 1.43 1.80 1.40 1.84 1.37 1.87 1.34 1.91 1.31 1.95 75 1.46 1.80 1.43 1.83 1.40 1.87 1.37 1.90 1.34 1.94 80 1.48 1.80 1.45 1.83 1.43 1.86 1.40 1.89 1.37 1.93 85 1.50 1.80 1.47 1.83 1.49 1.86 1.42 1.89 1.40 1.92 90 1.52 1.80 1.49 1.83 1.47 1.85 1.45 1.88 1.42 1.91 95 1.54 1.80 1.51 1.83 1.49 1.85 1.46 1.88 1.44 1.90 100 1.55 1.80 1.53 1.83 1.50 1.85 1.48 1.87 1.46 1.90 150 1.65 1.82 1.64 1.83 1.62 1.85 1.60 1.86 1.59 1.88 200 1.71 1.83 1.70 1.84 1.69 1.85 1.68 1.86 1.67 1.87 Page 4 of 4Durbin-Watson Critical Values - 95% (d) 2006-04-27http://www.ekonomija.cg.yu/dokumenta/ekonometrija/Durbin-Watson%20statistika.htm
Download