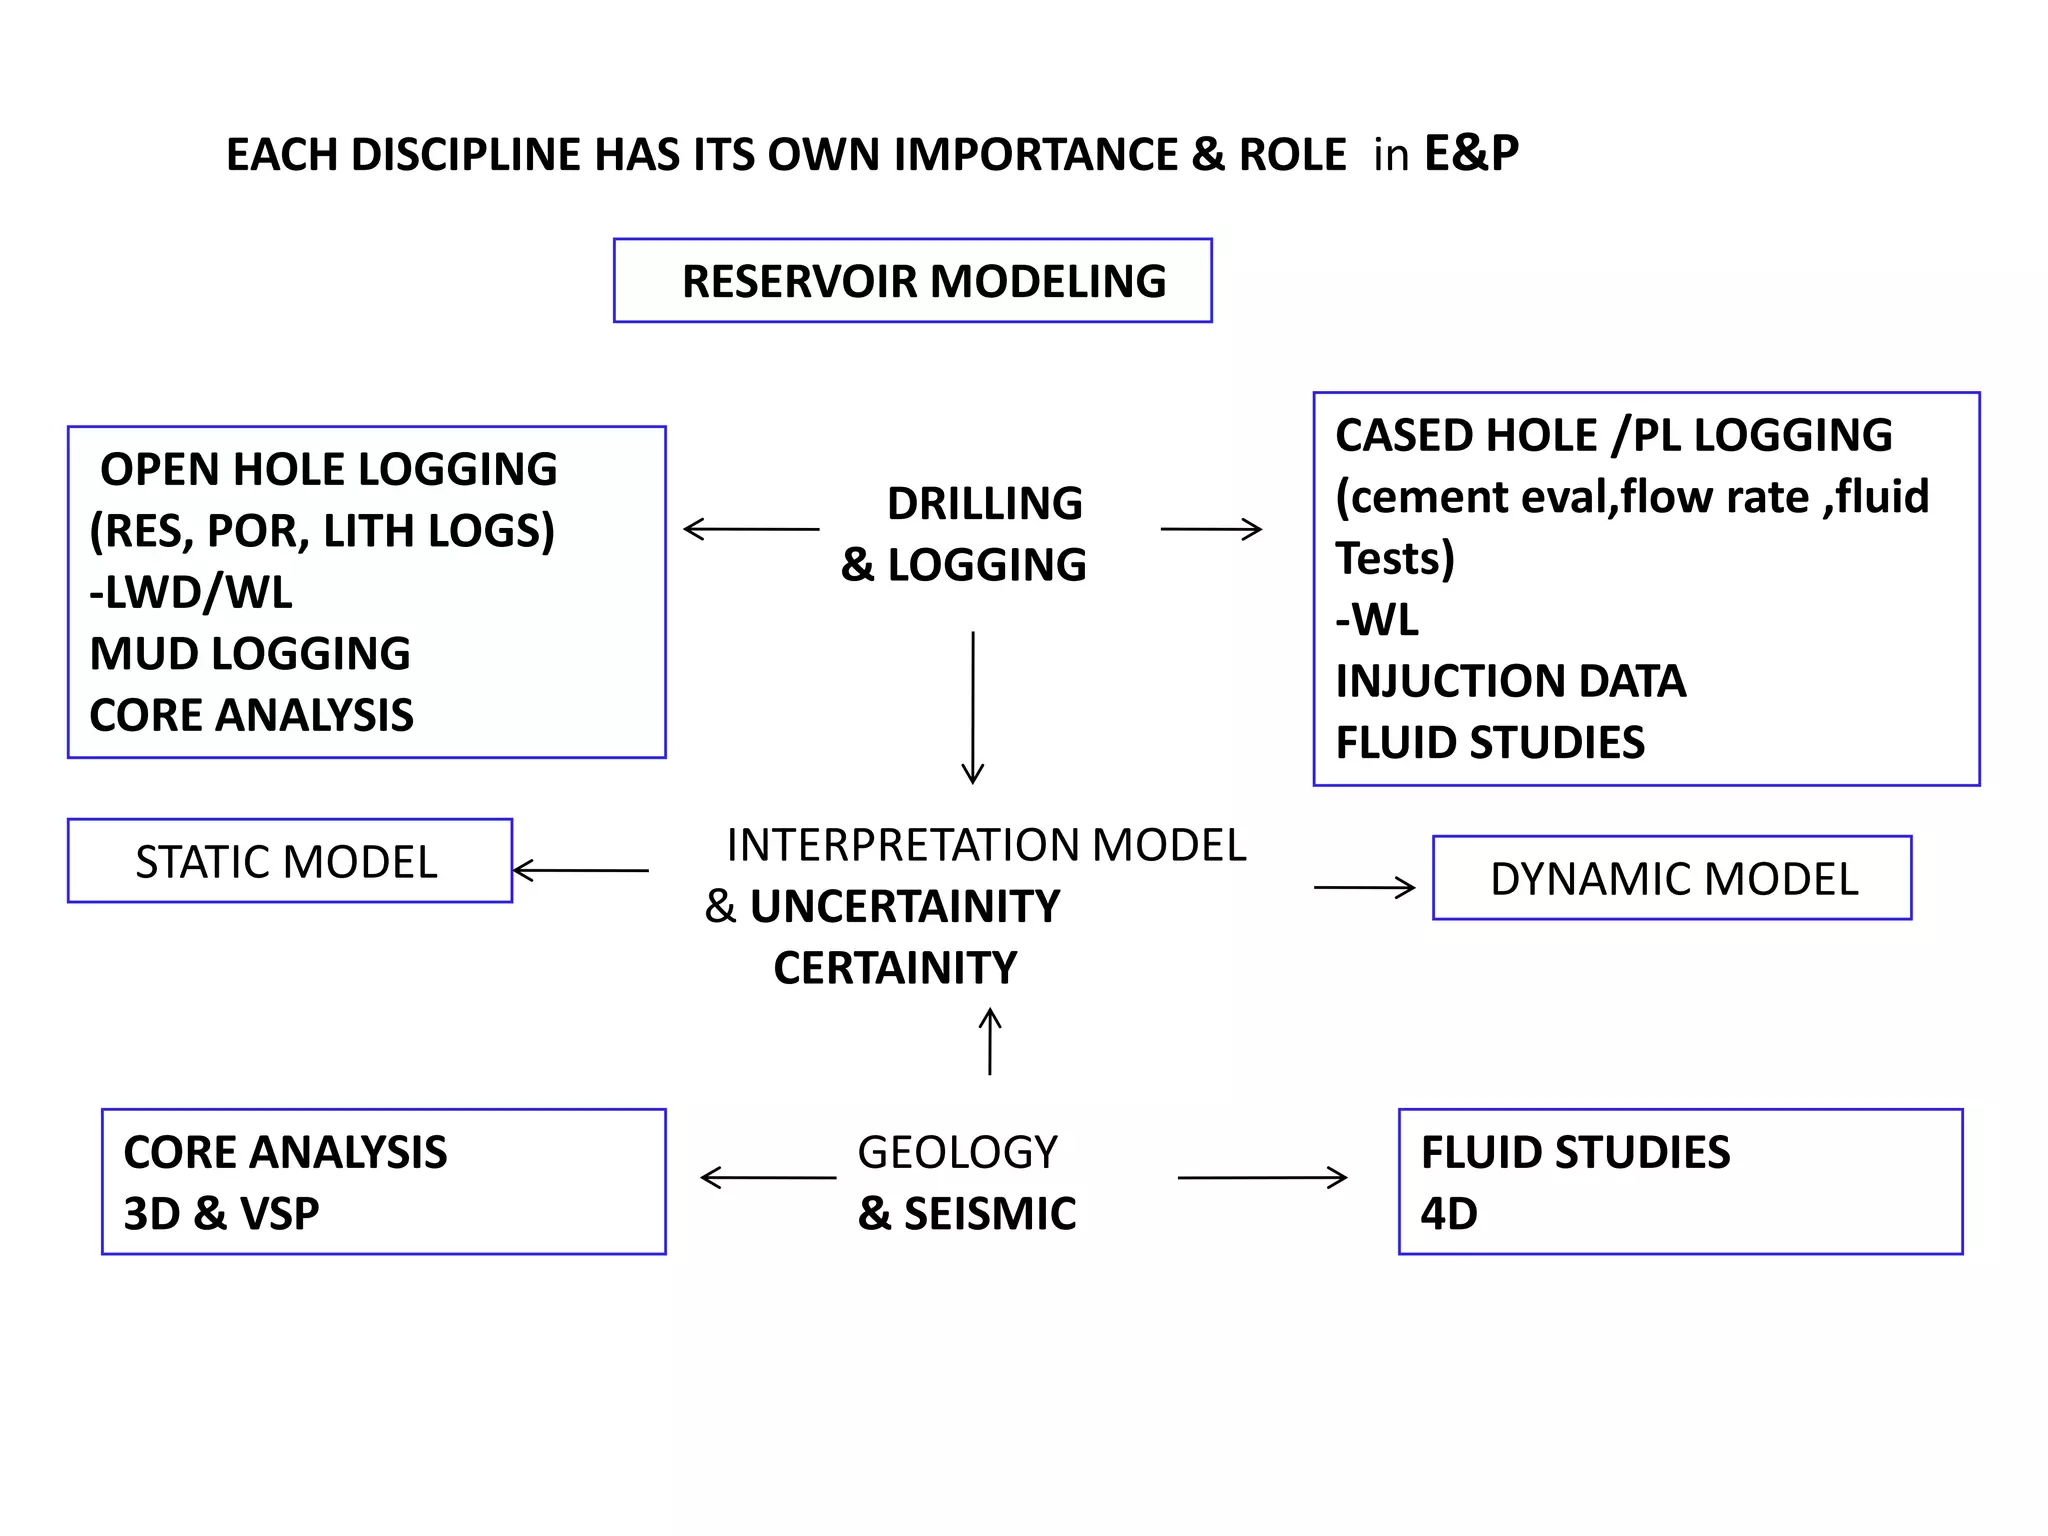
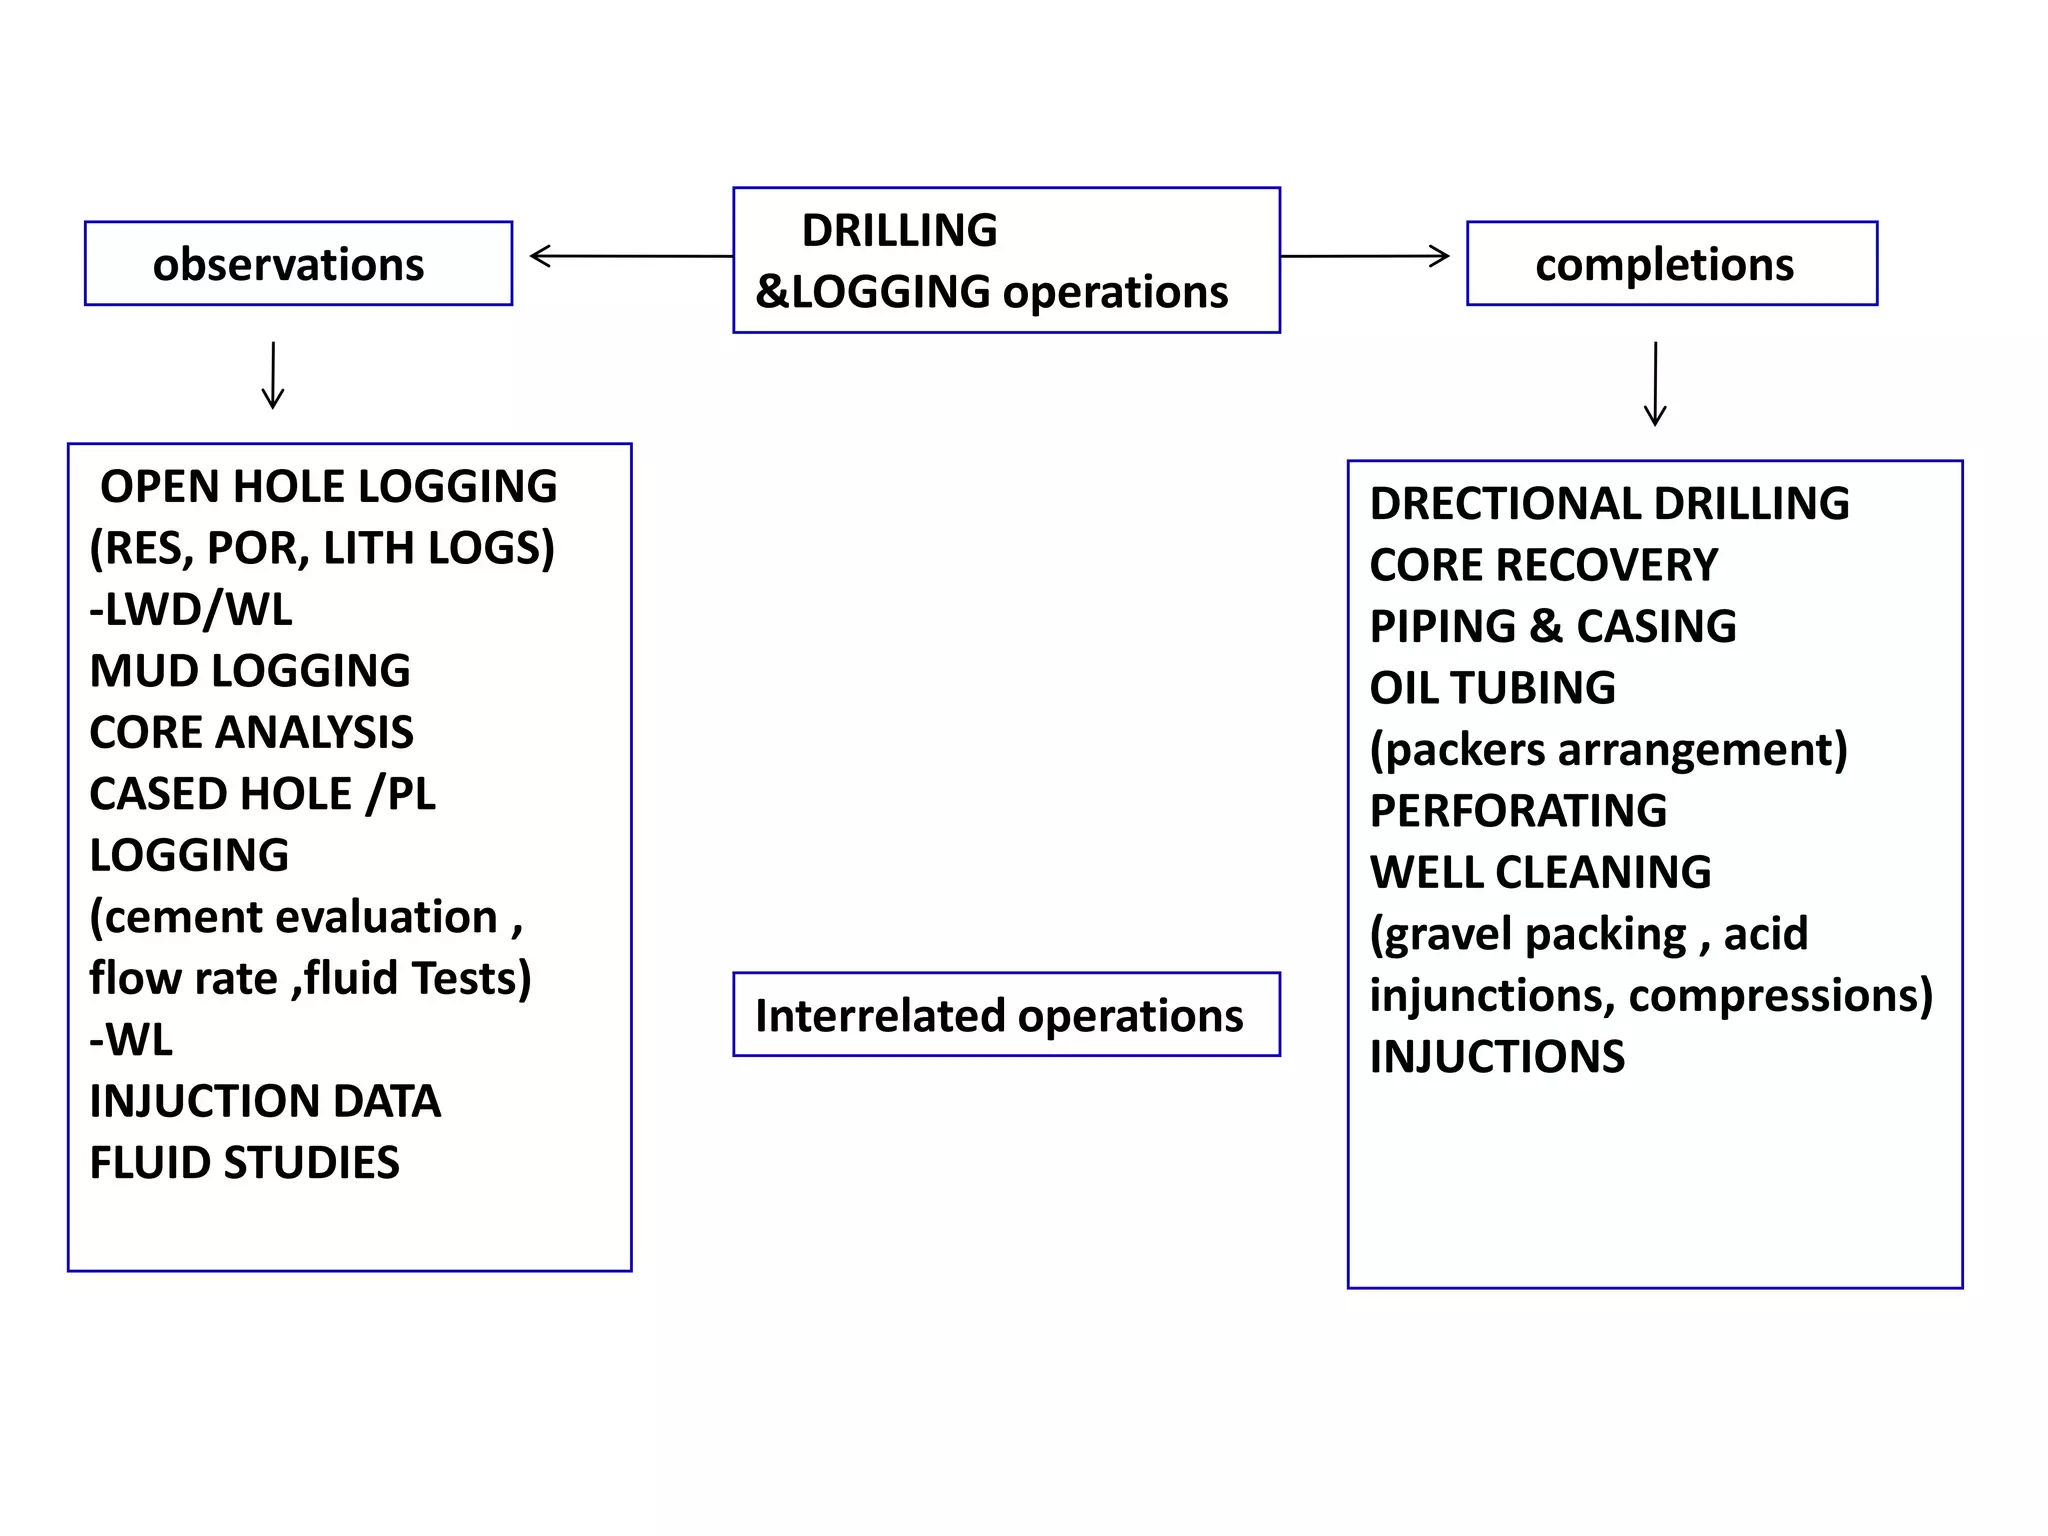
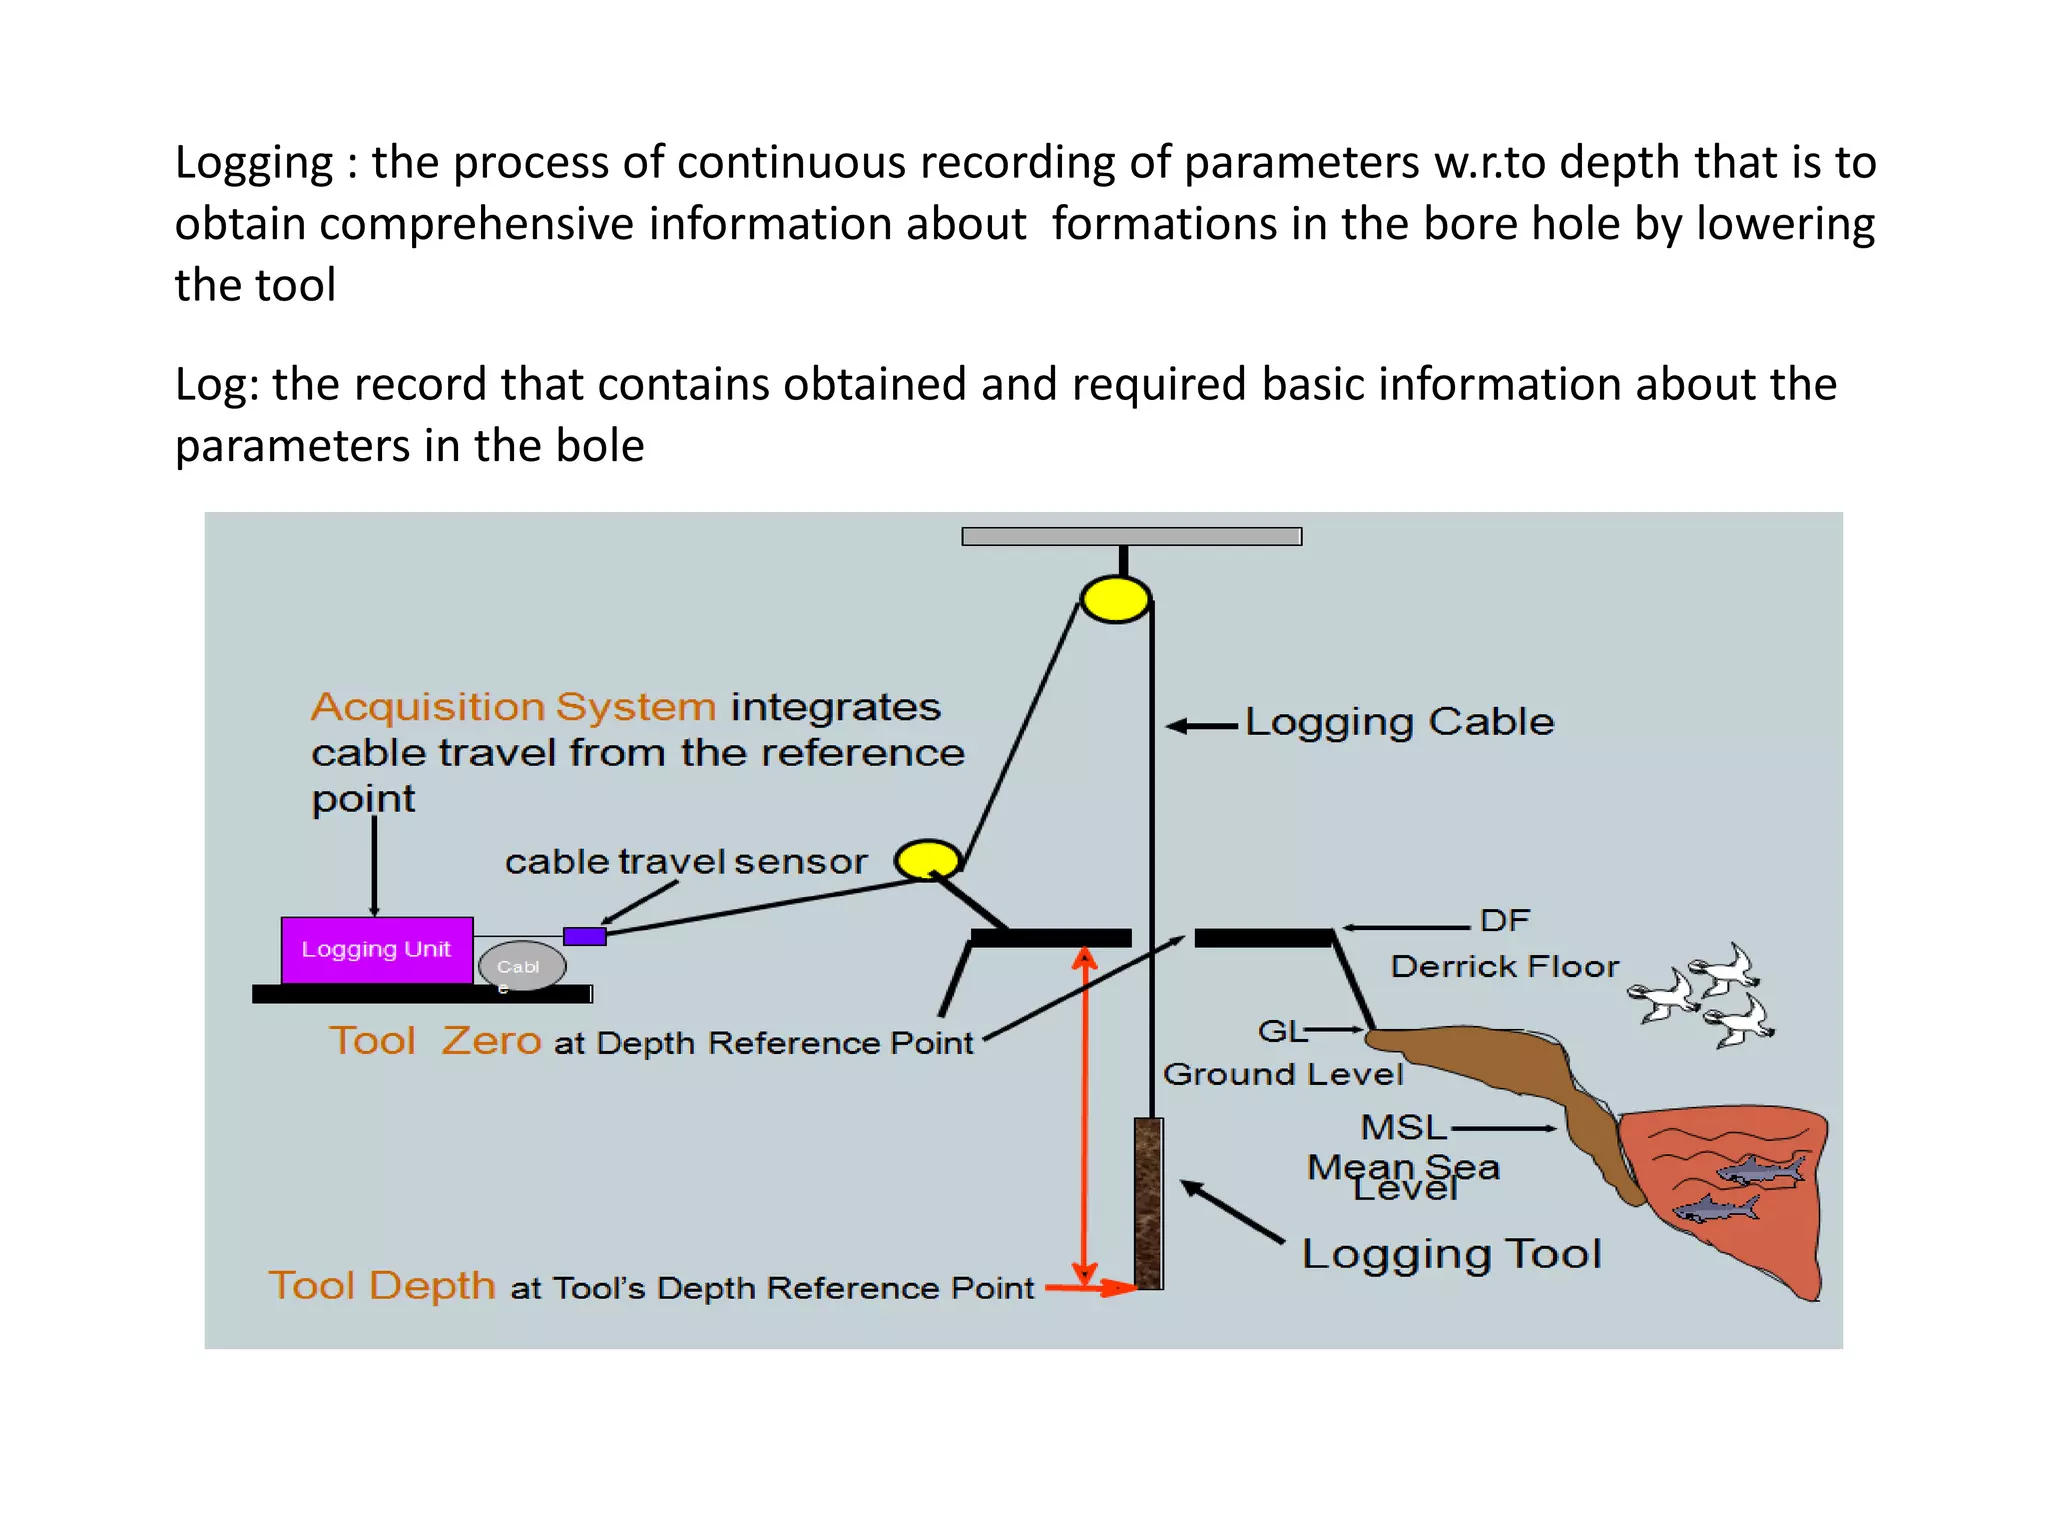
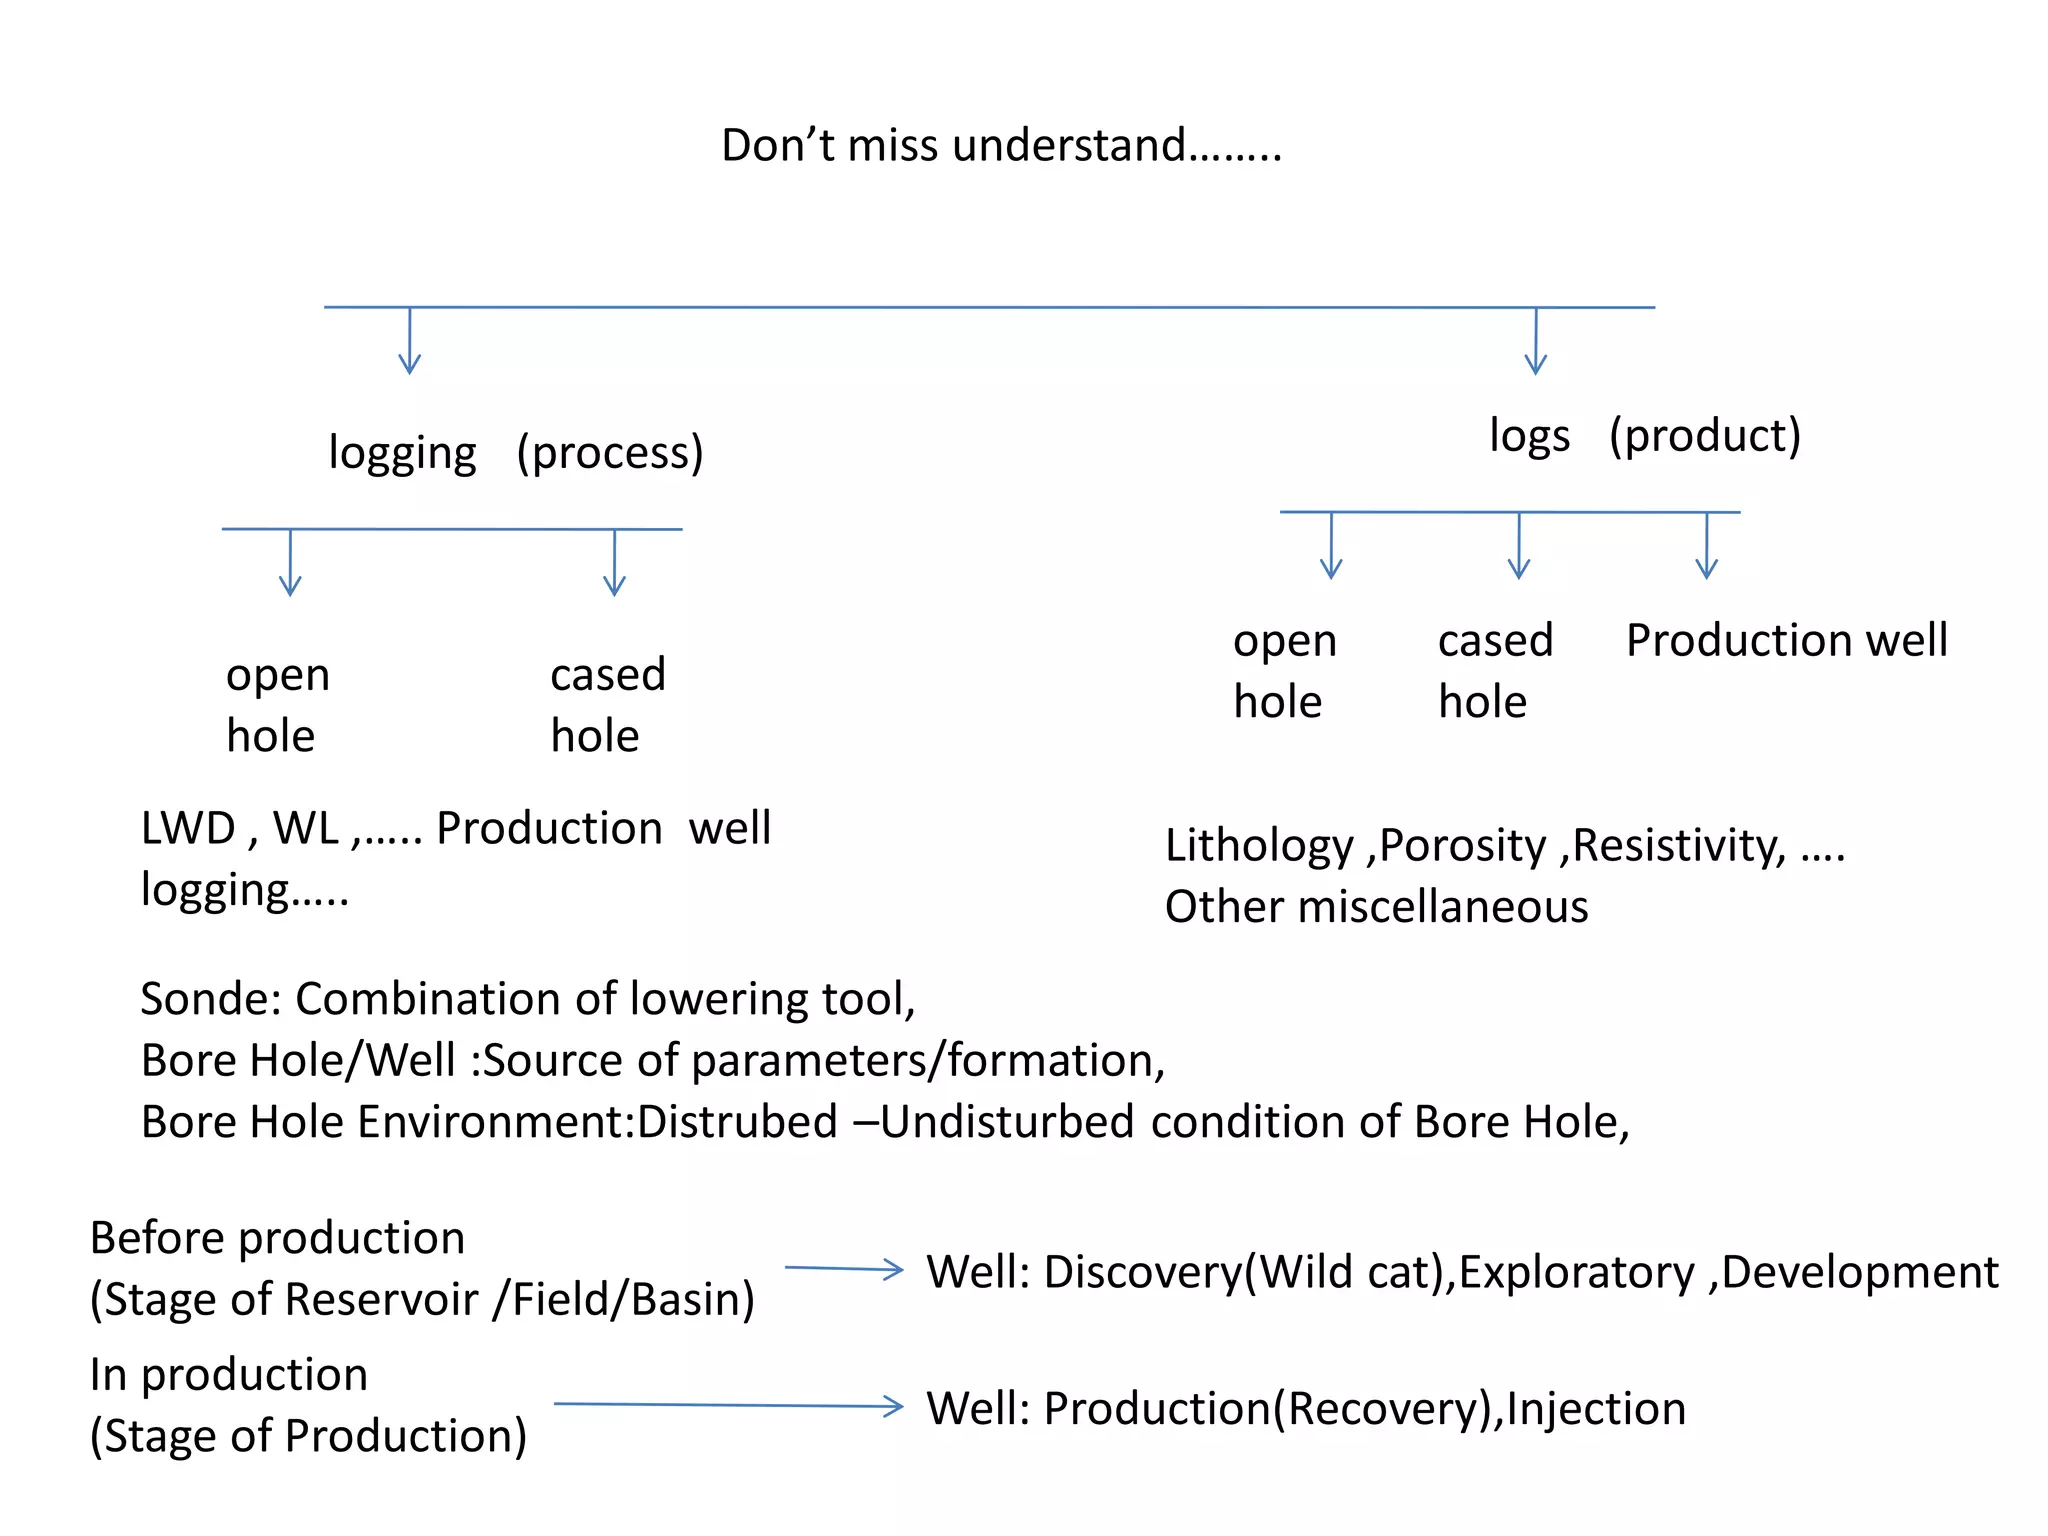
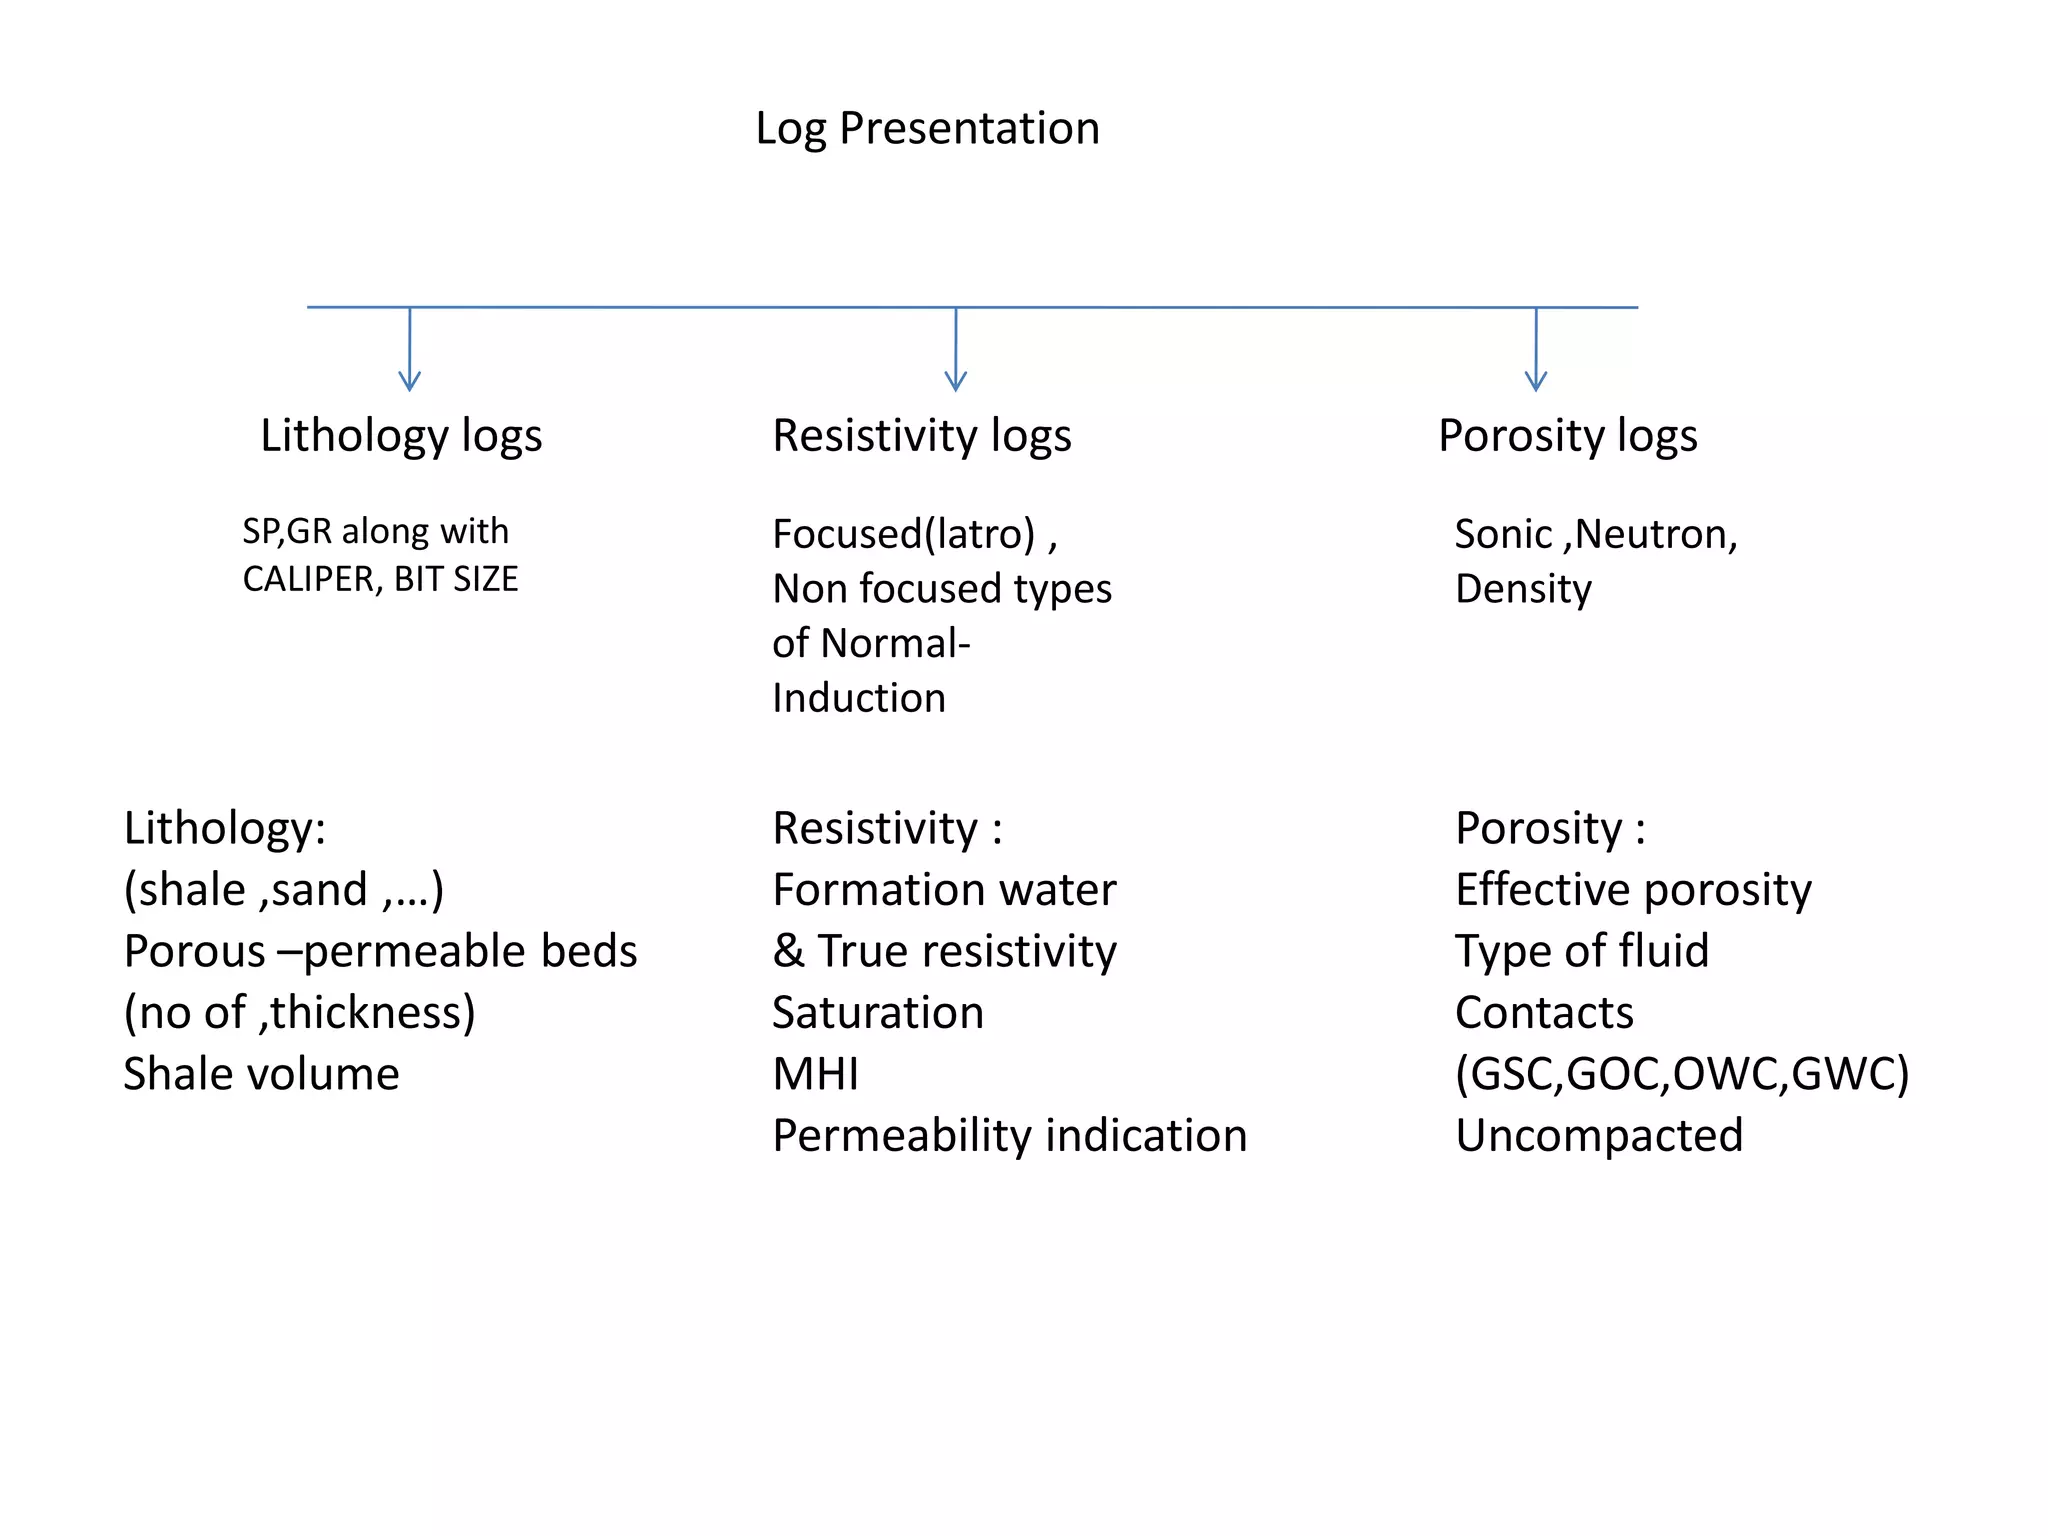
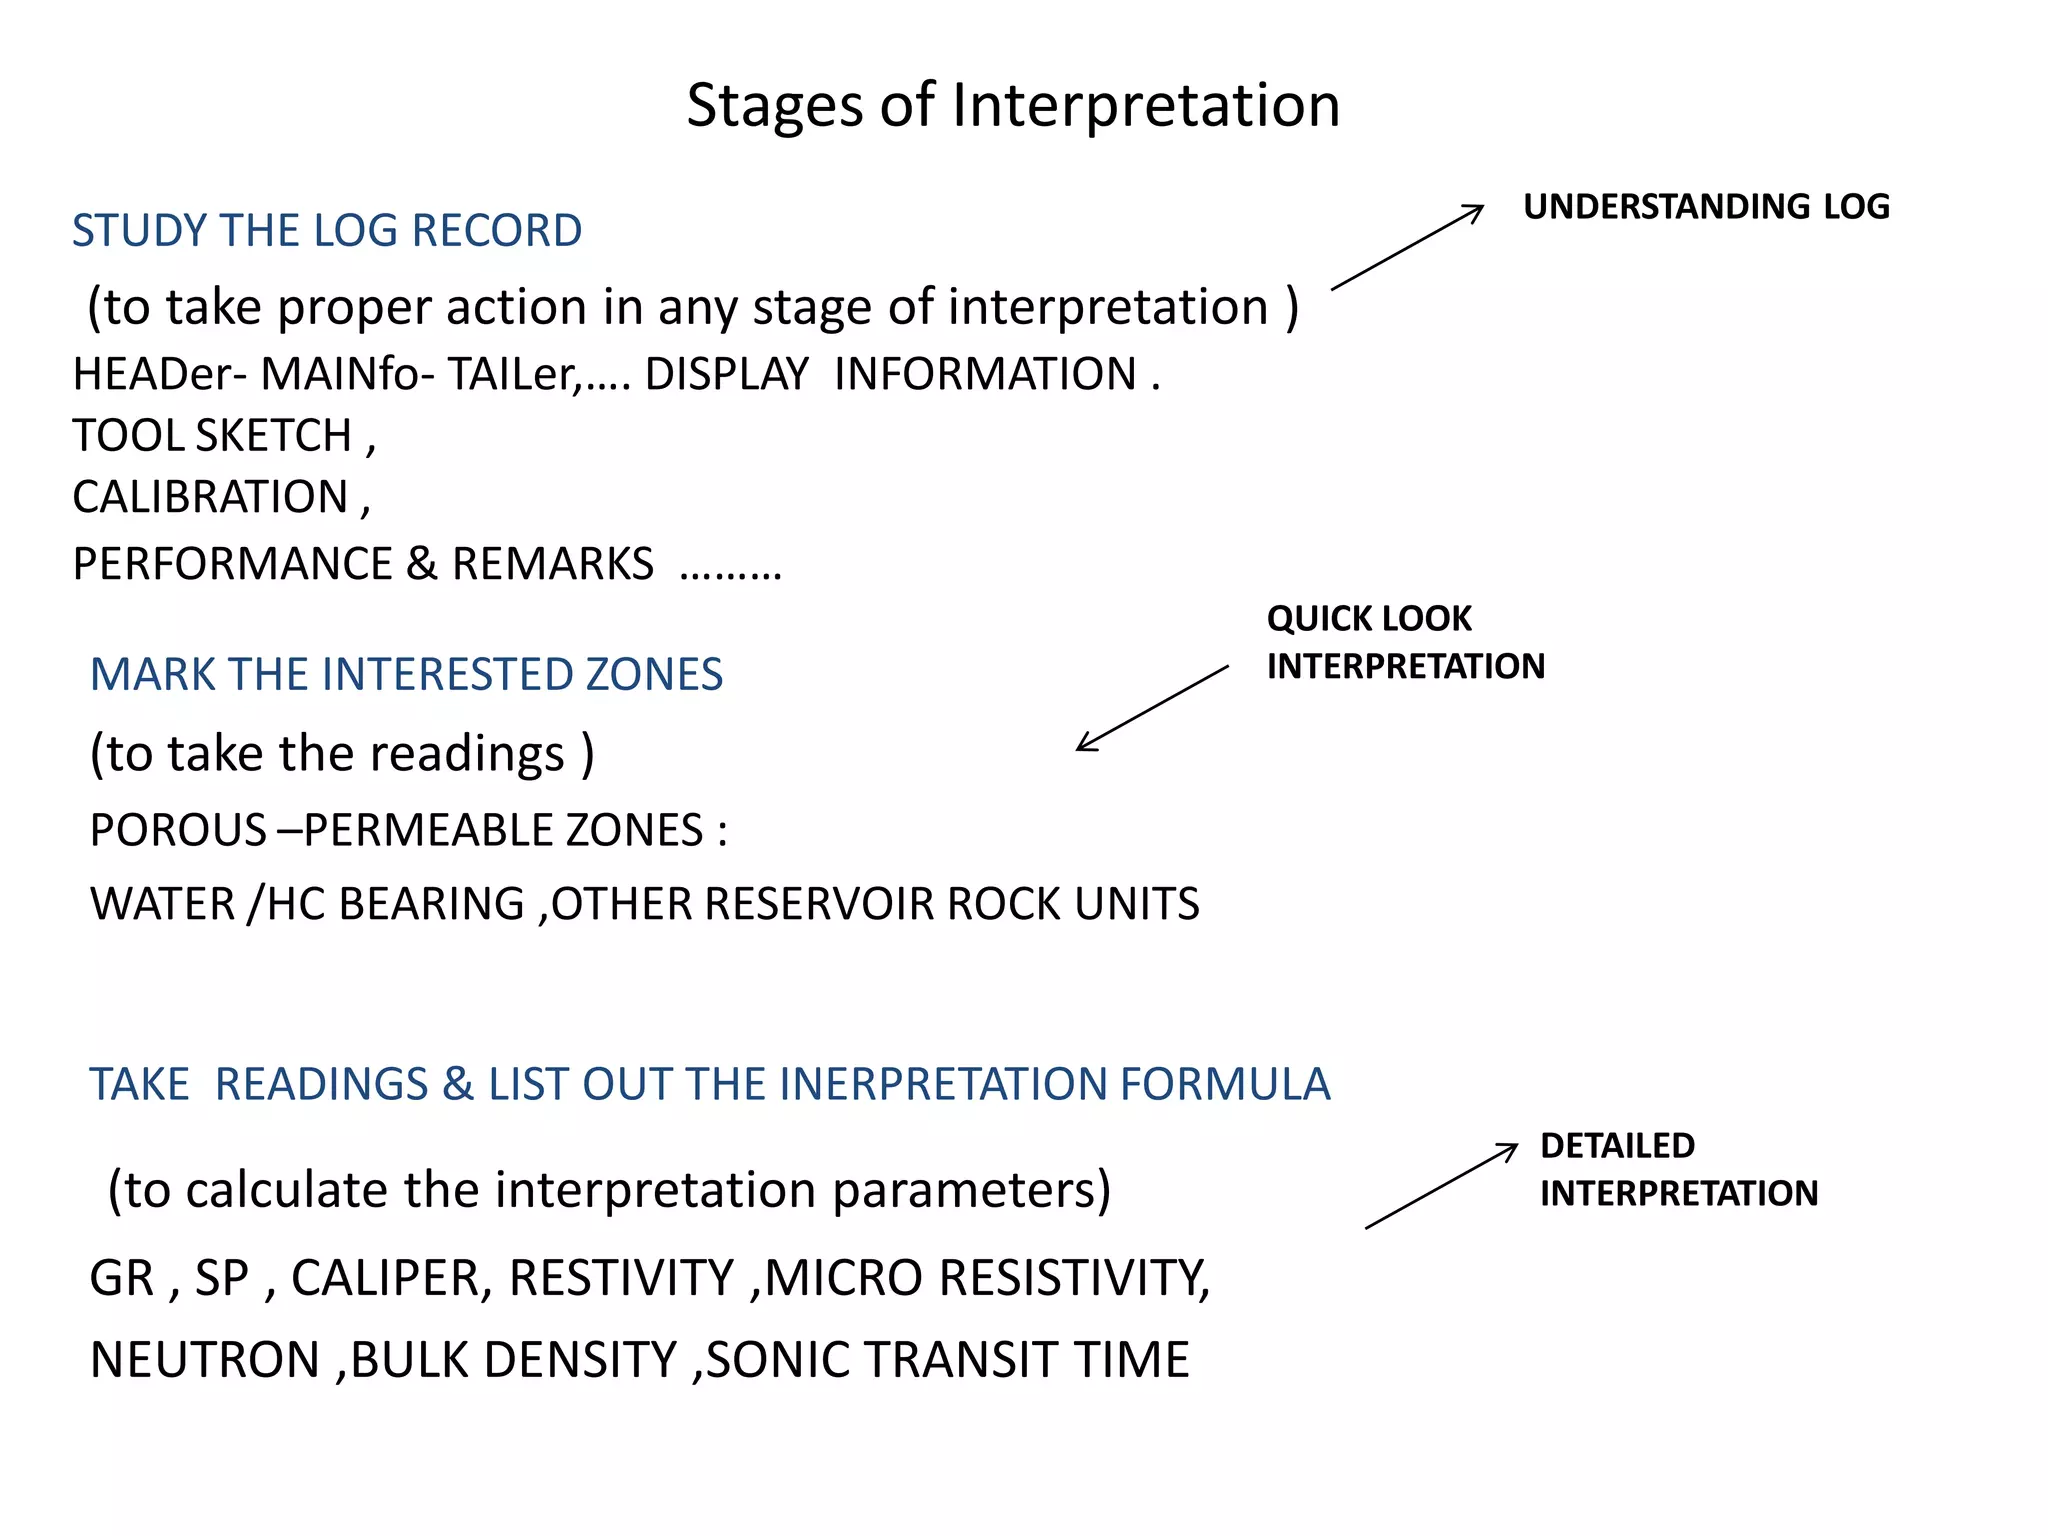
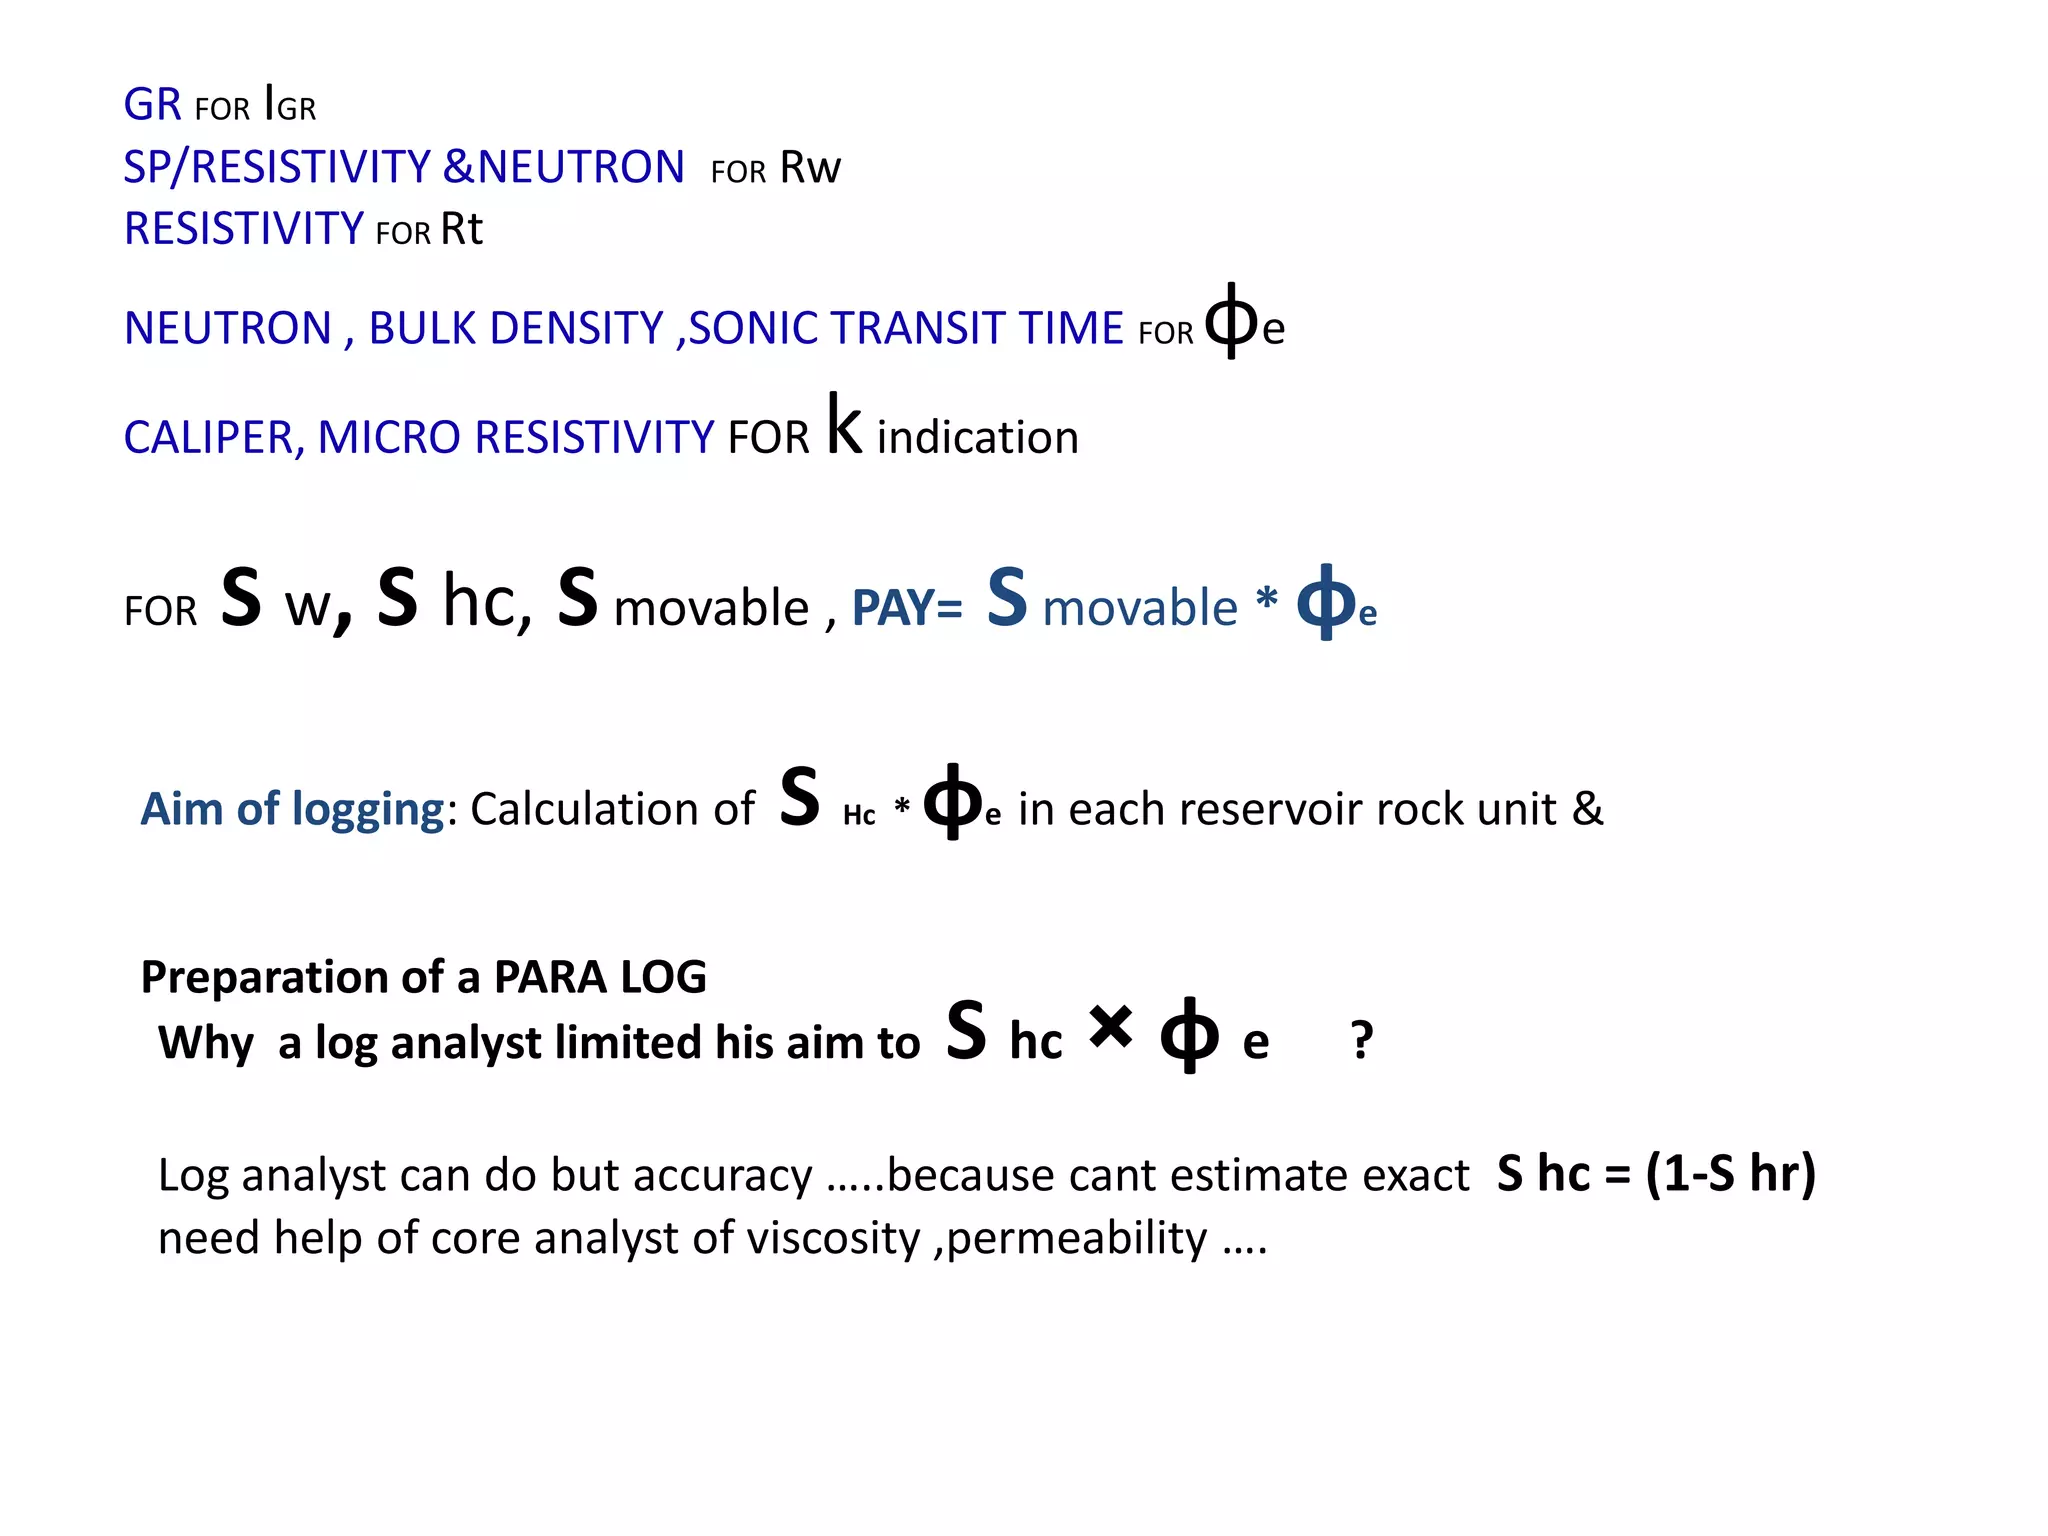
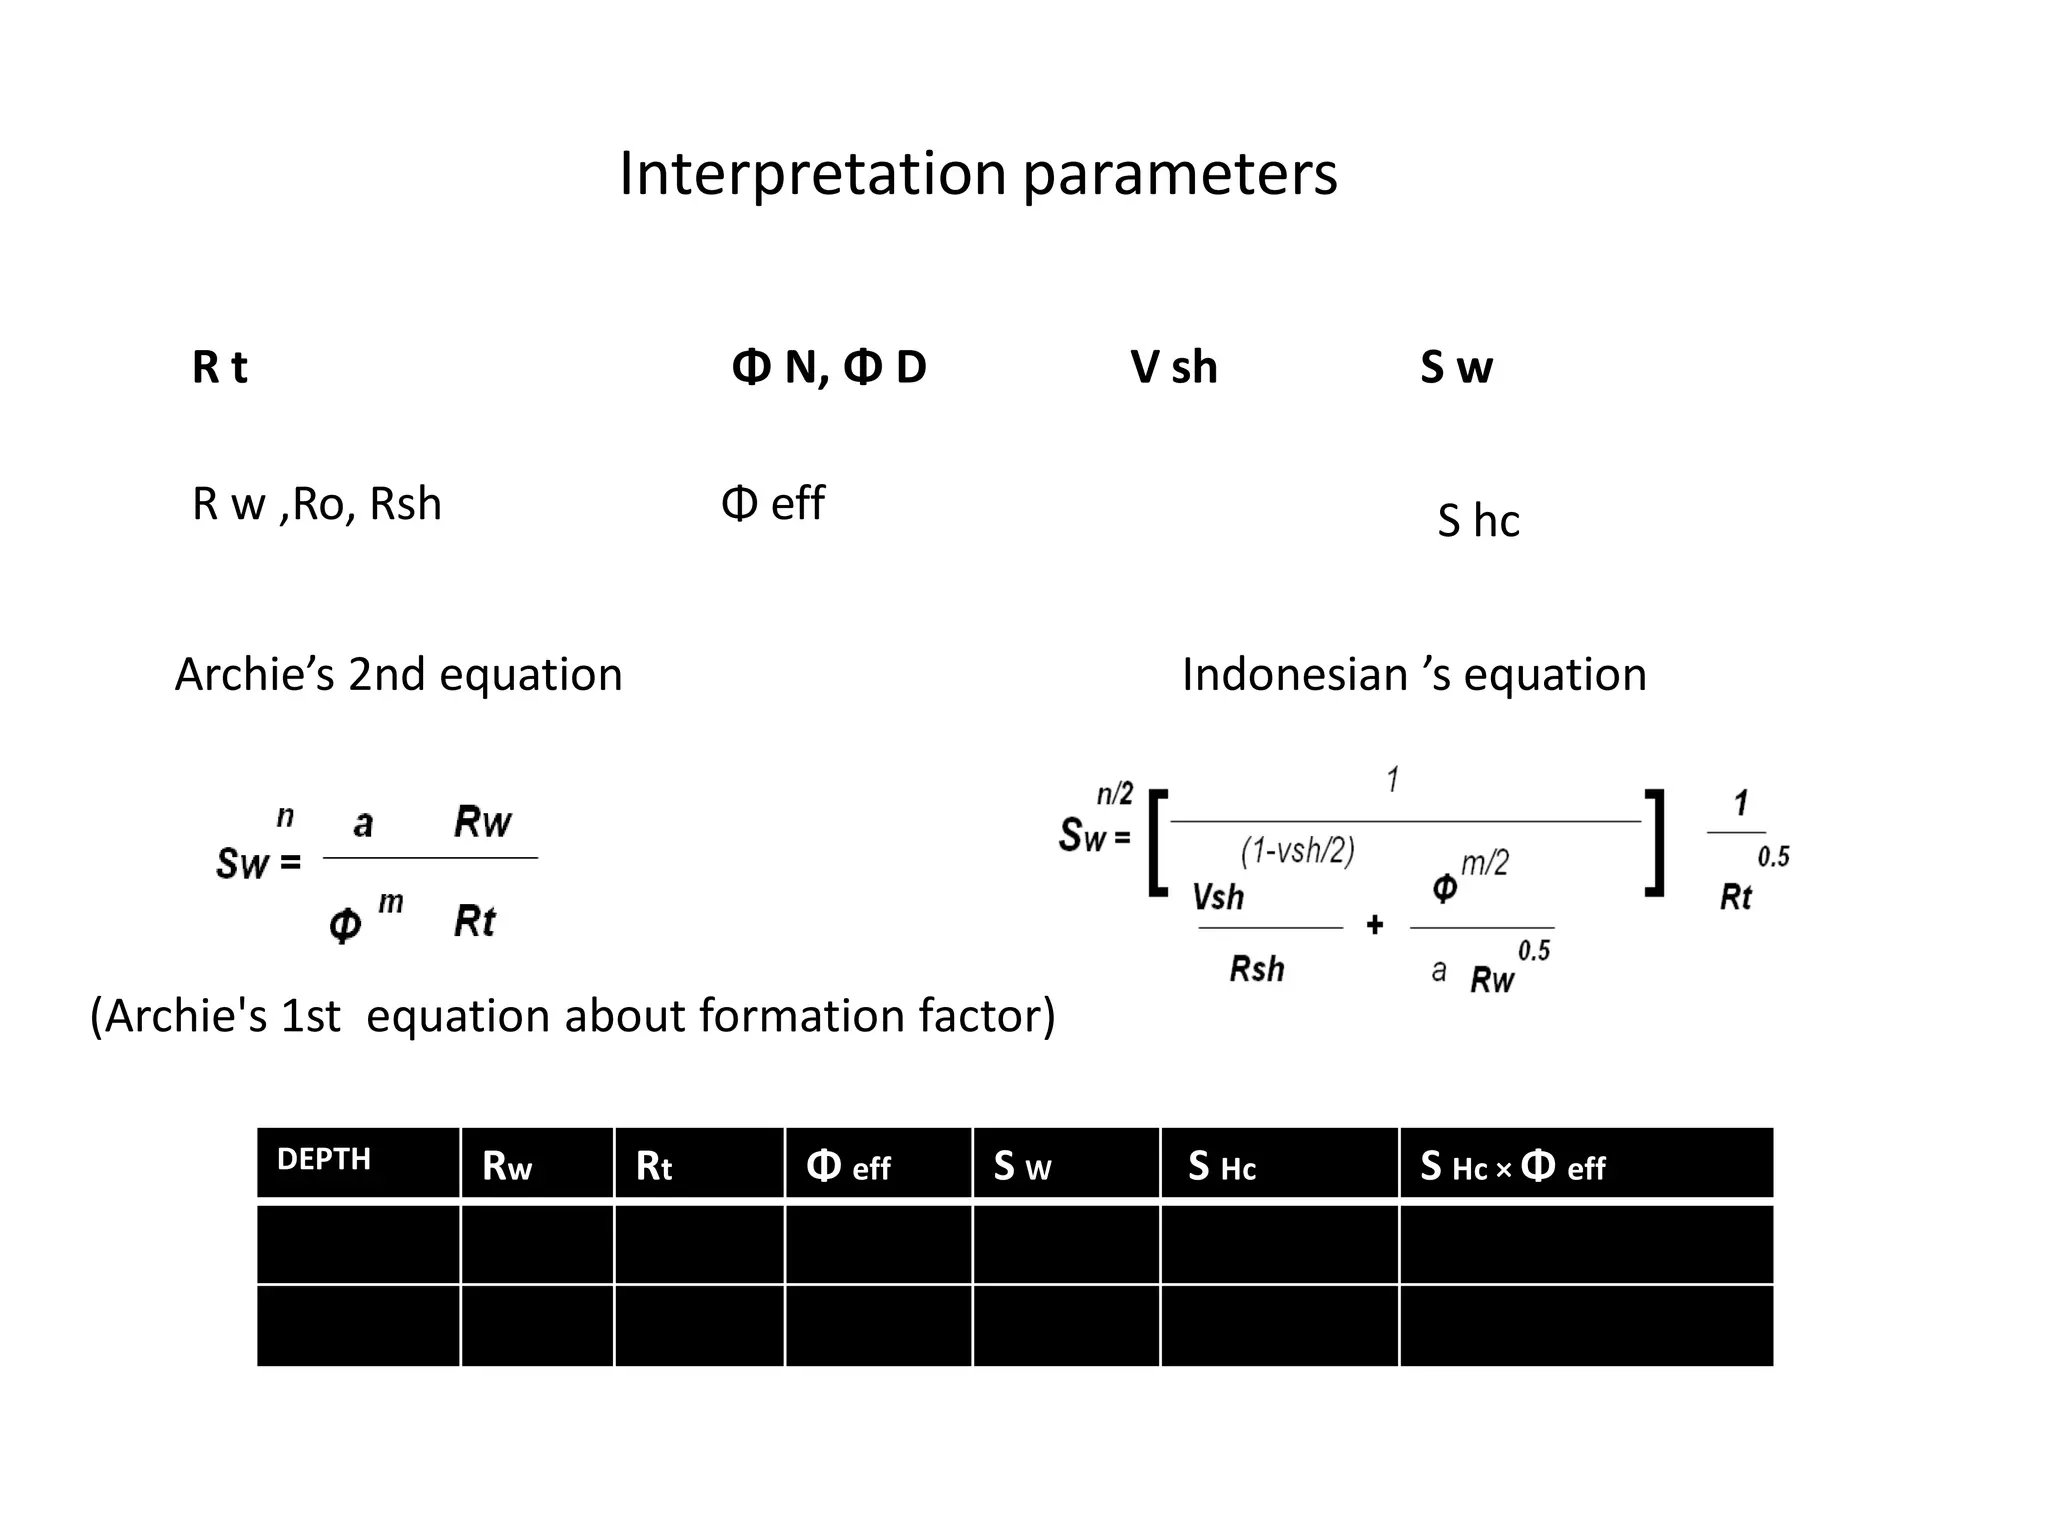
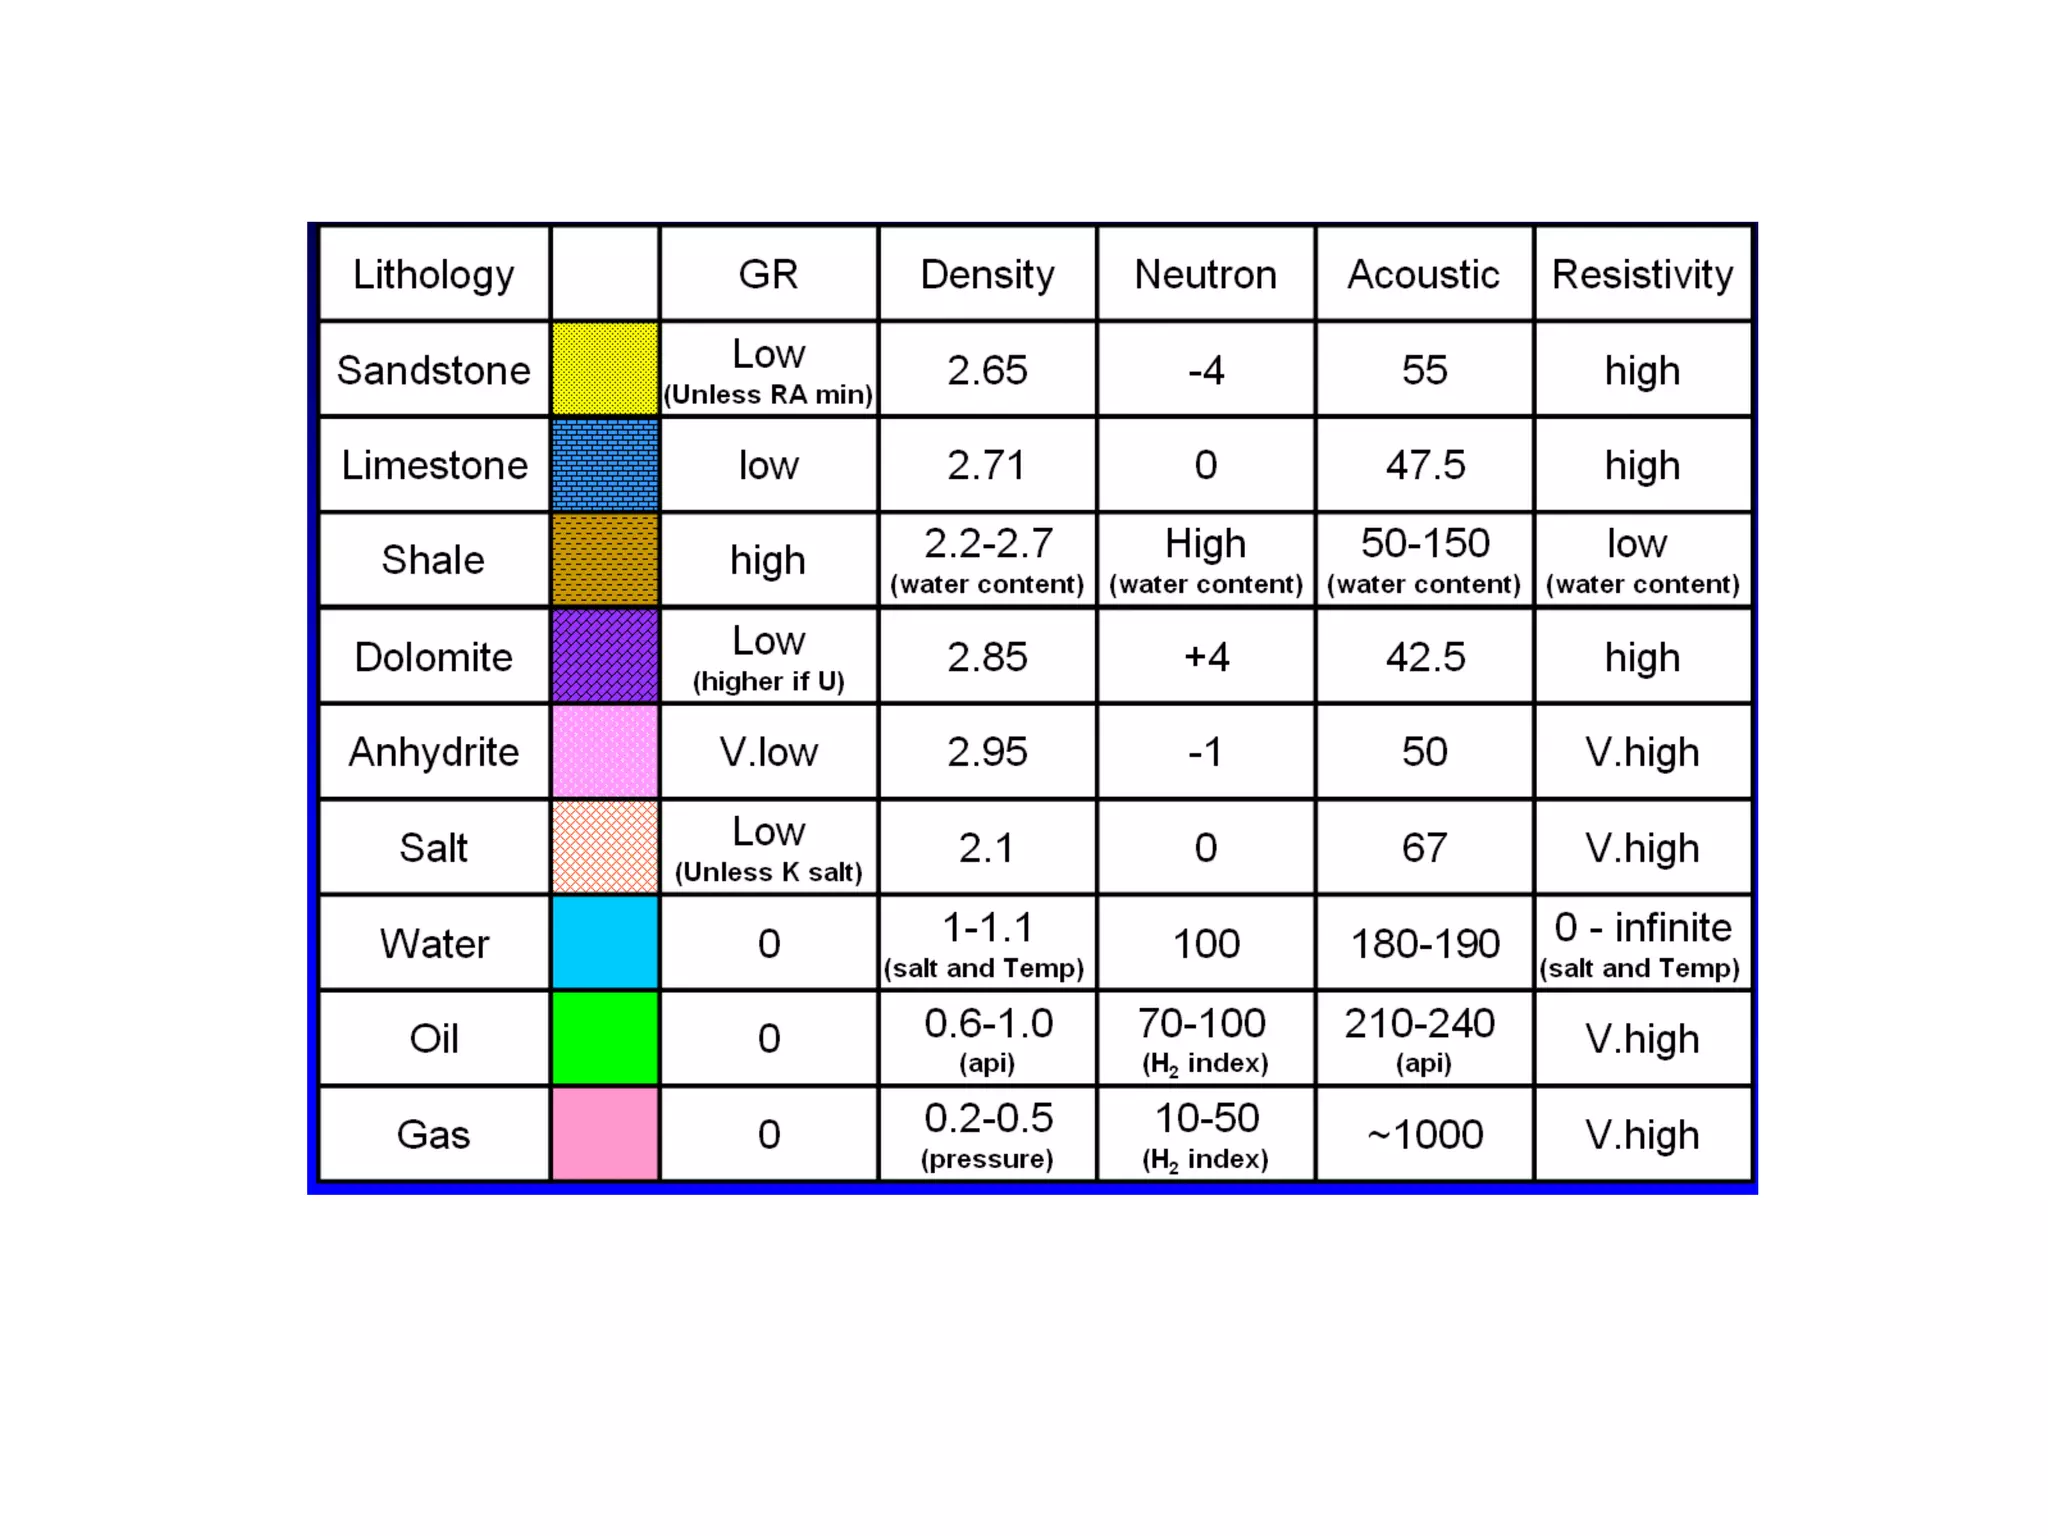
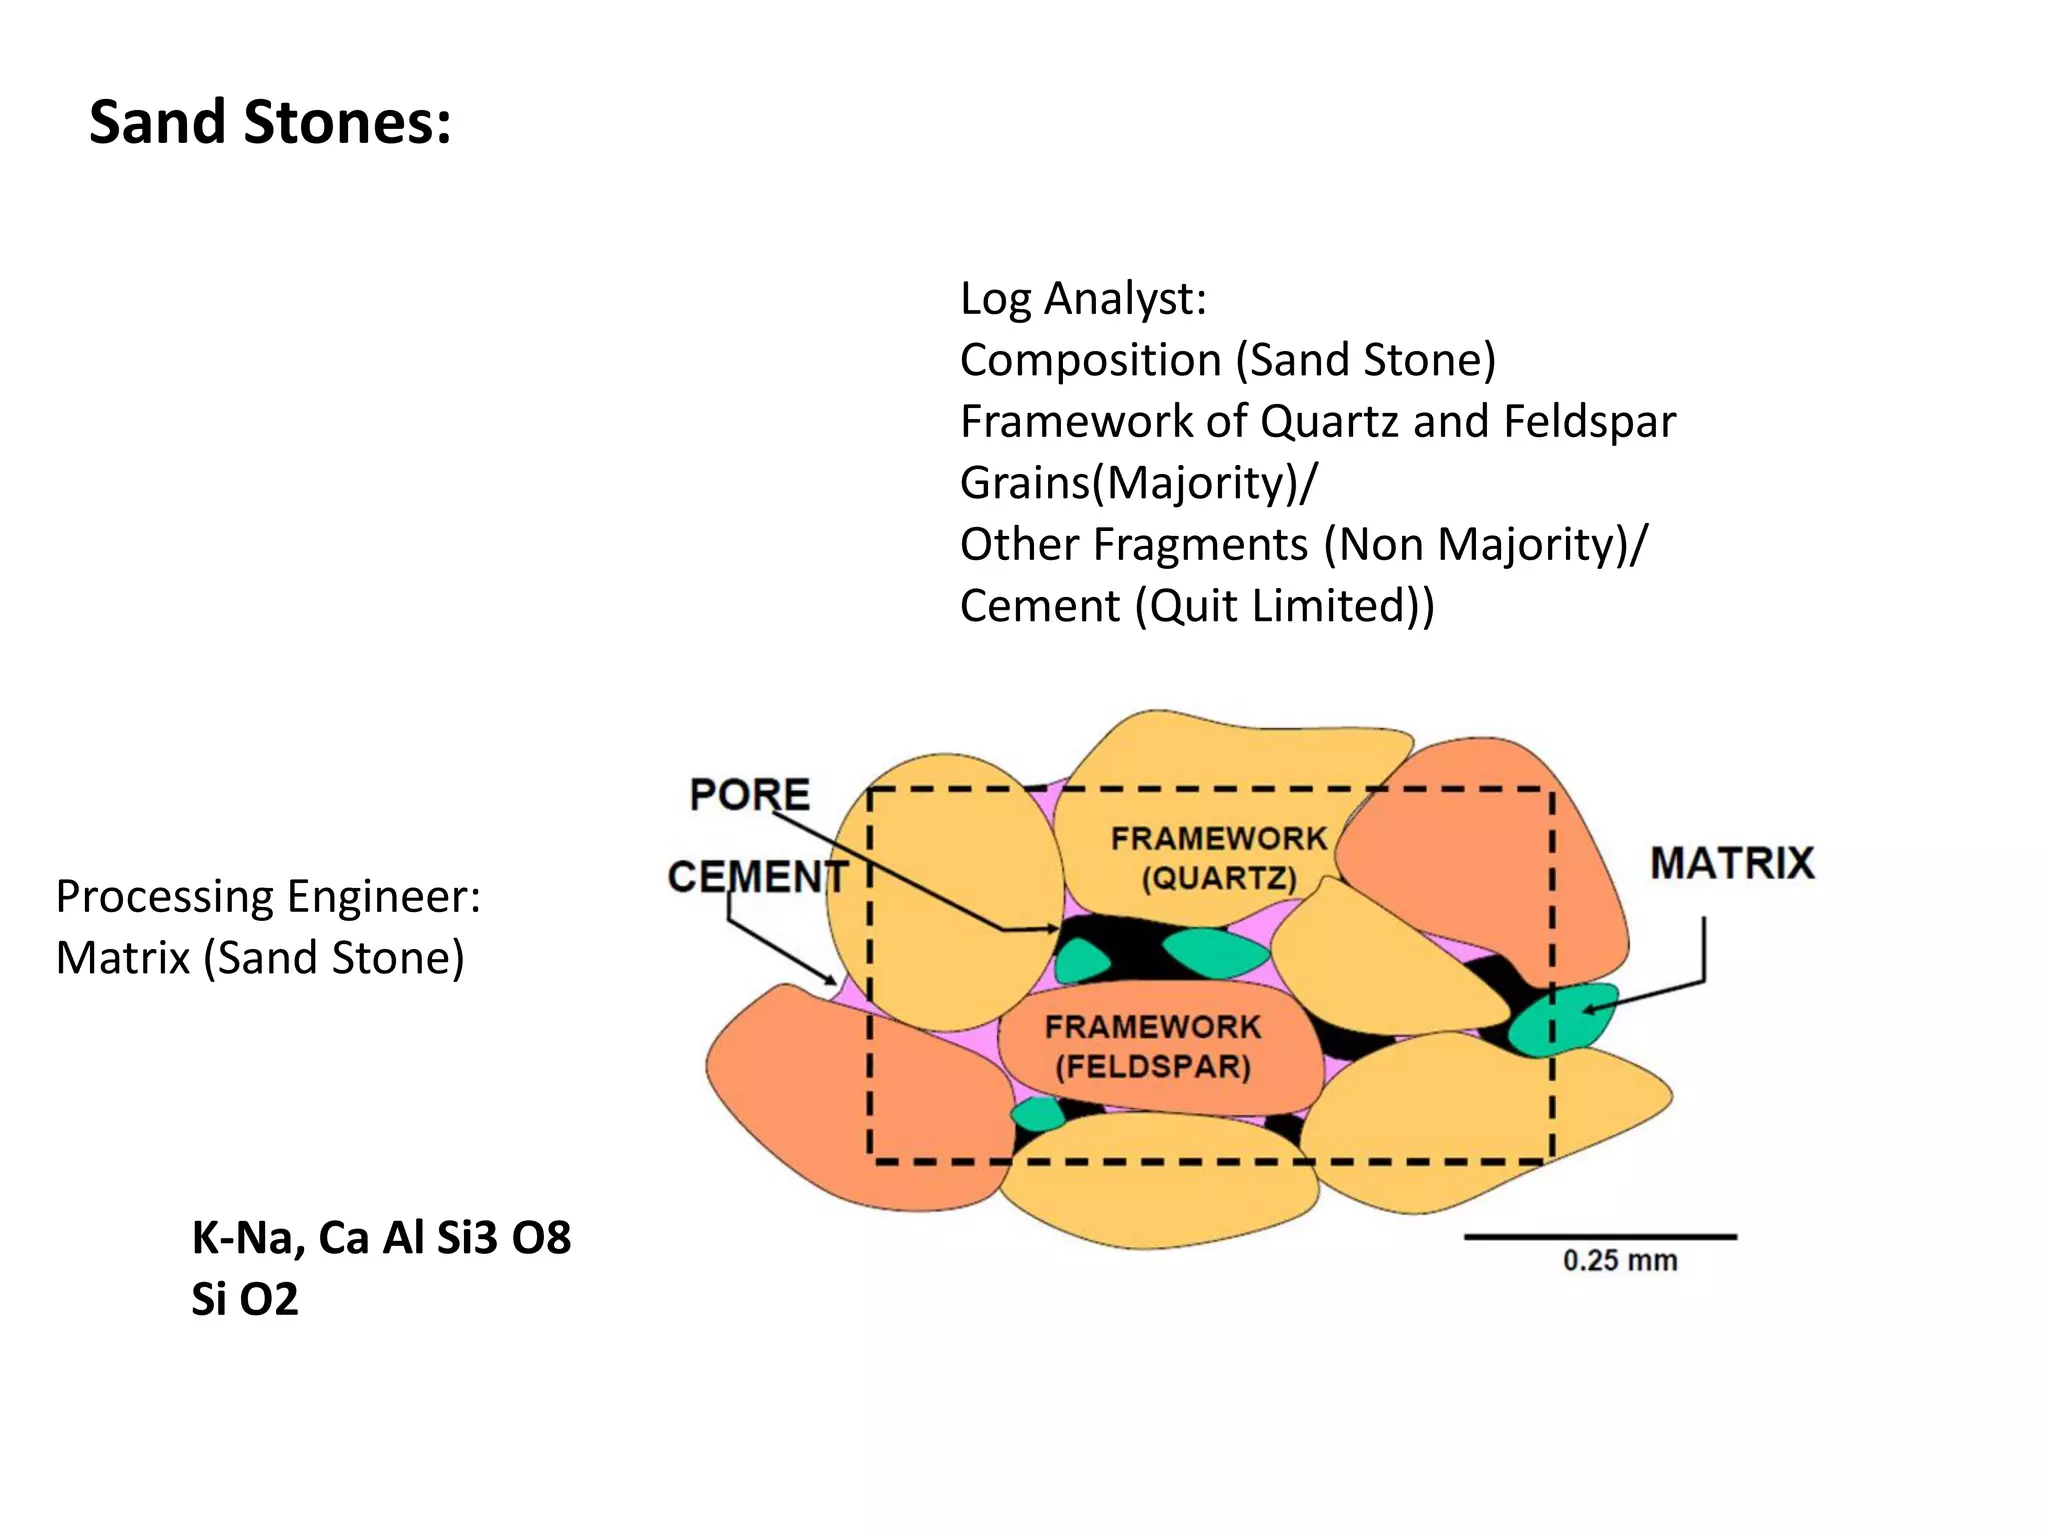
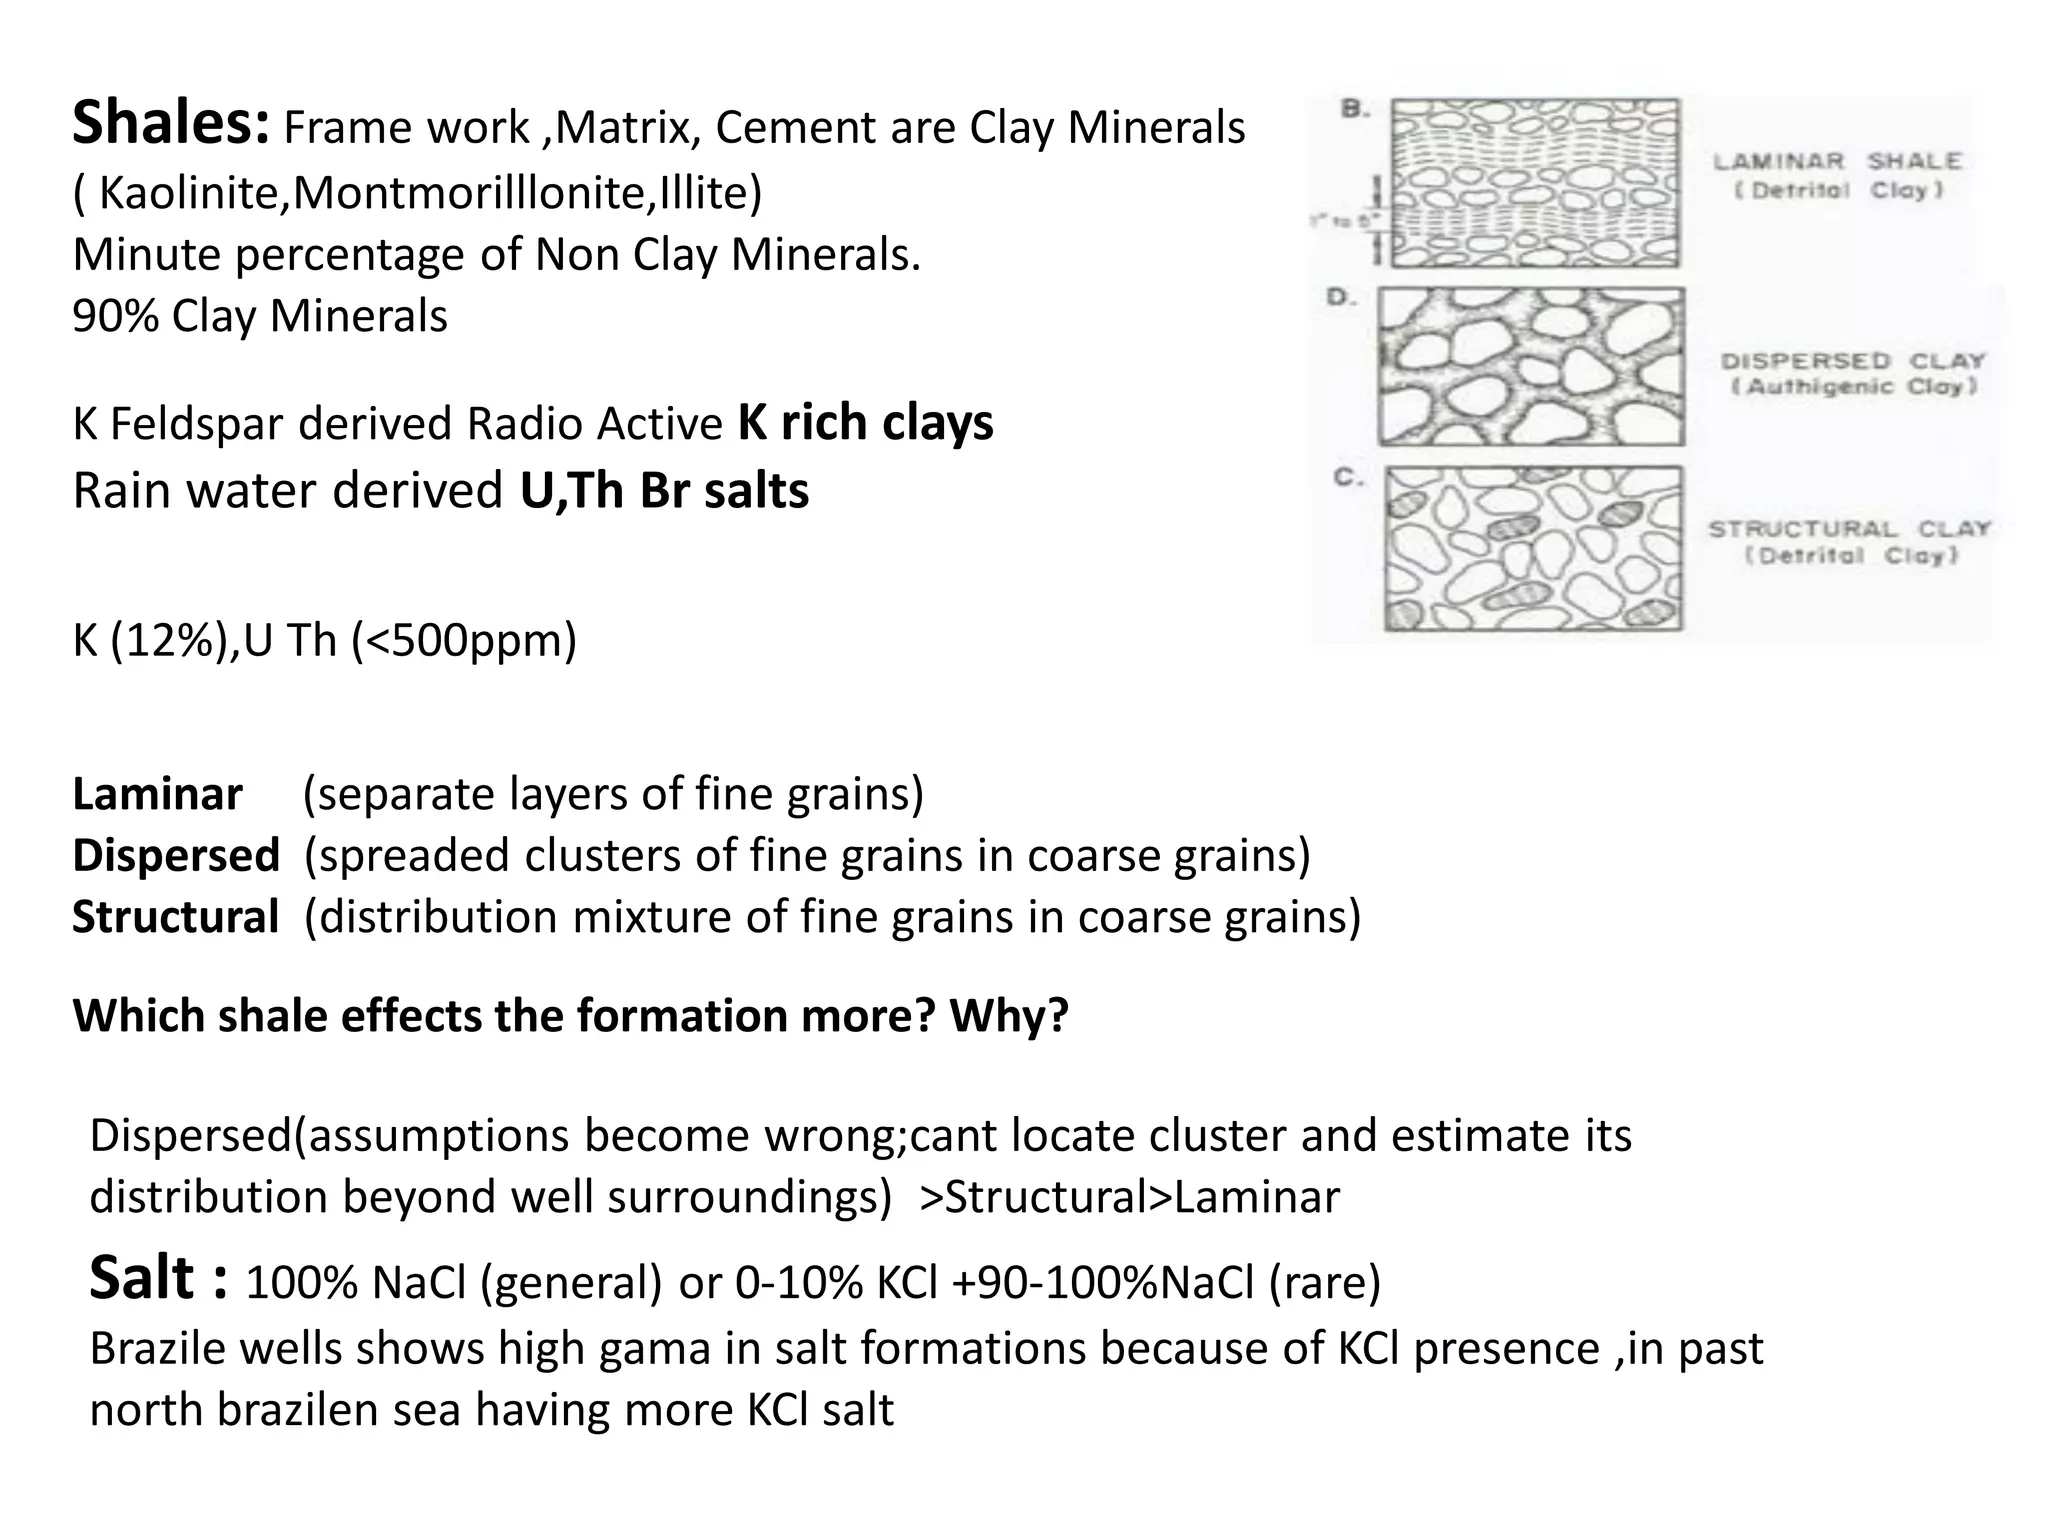
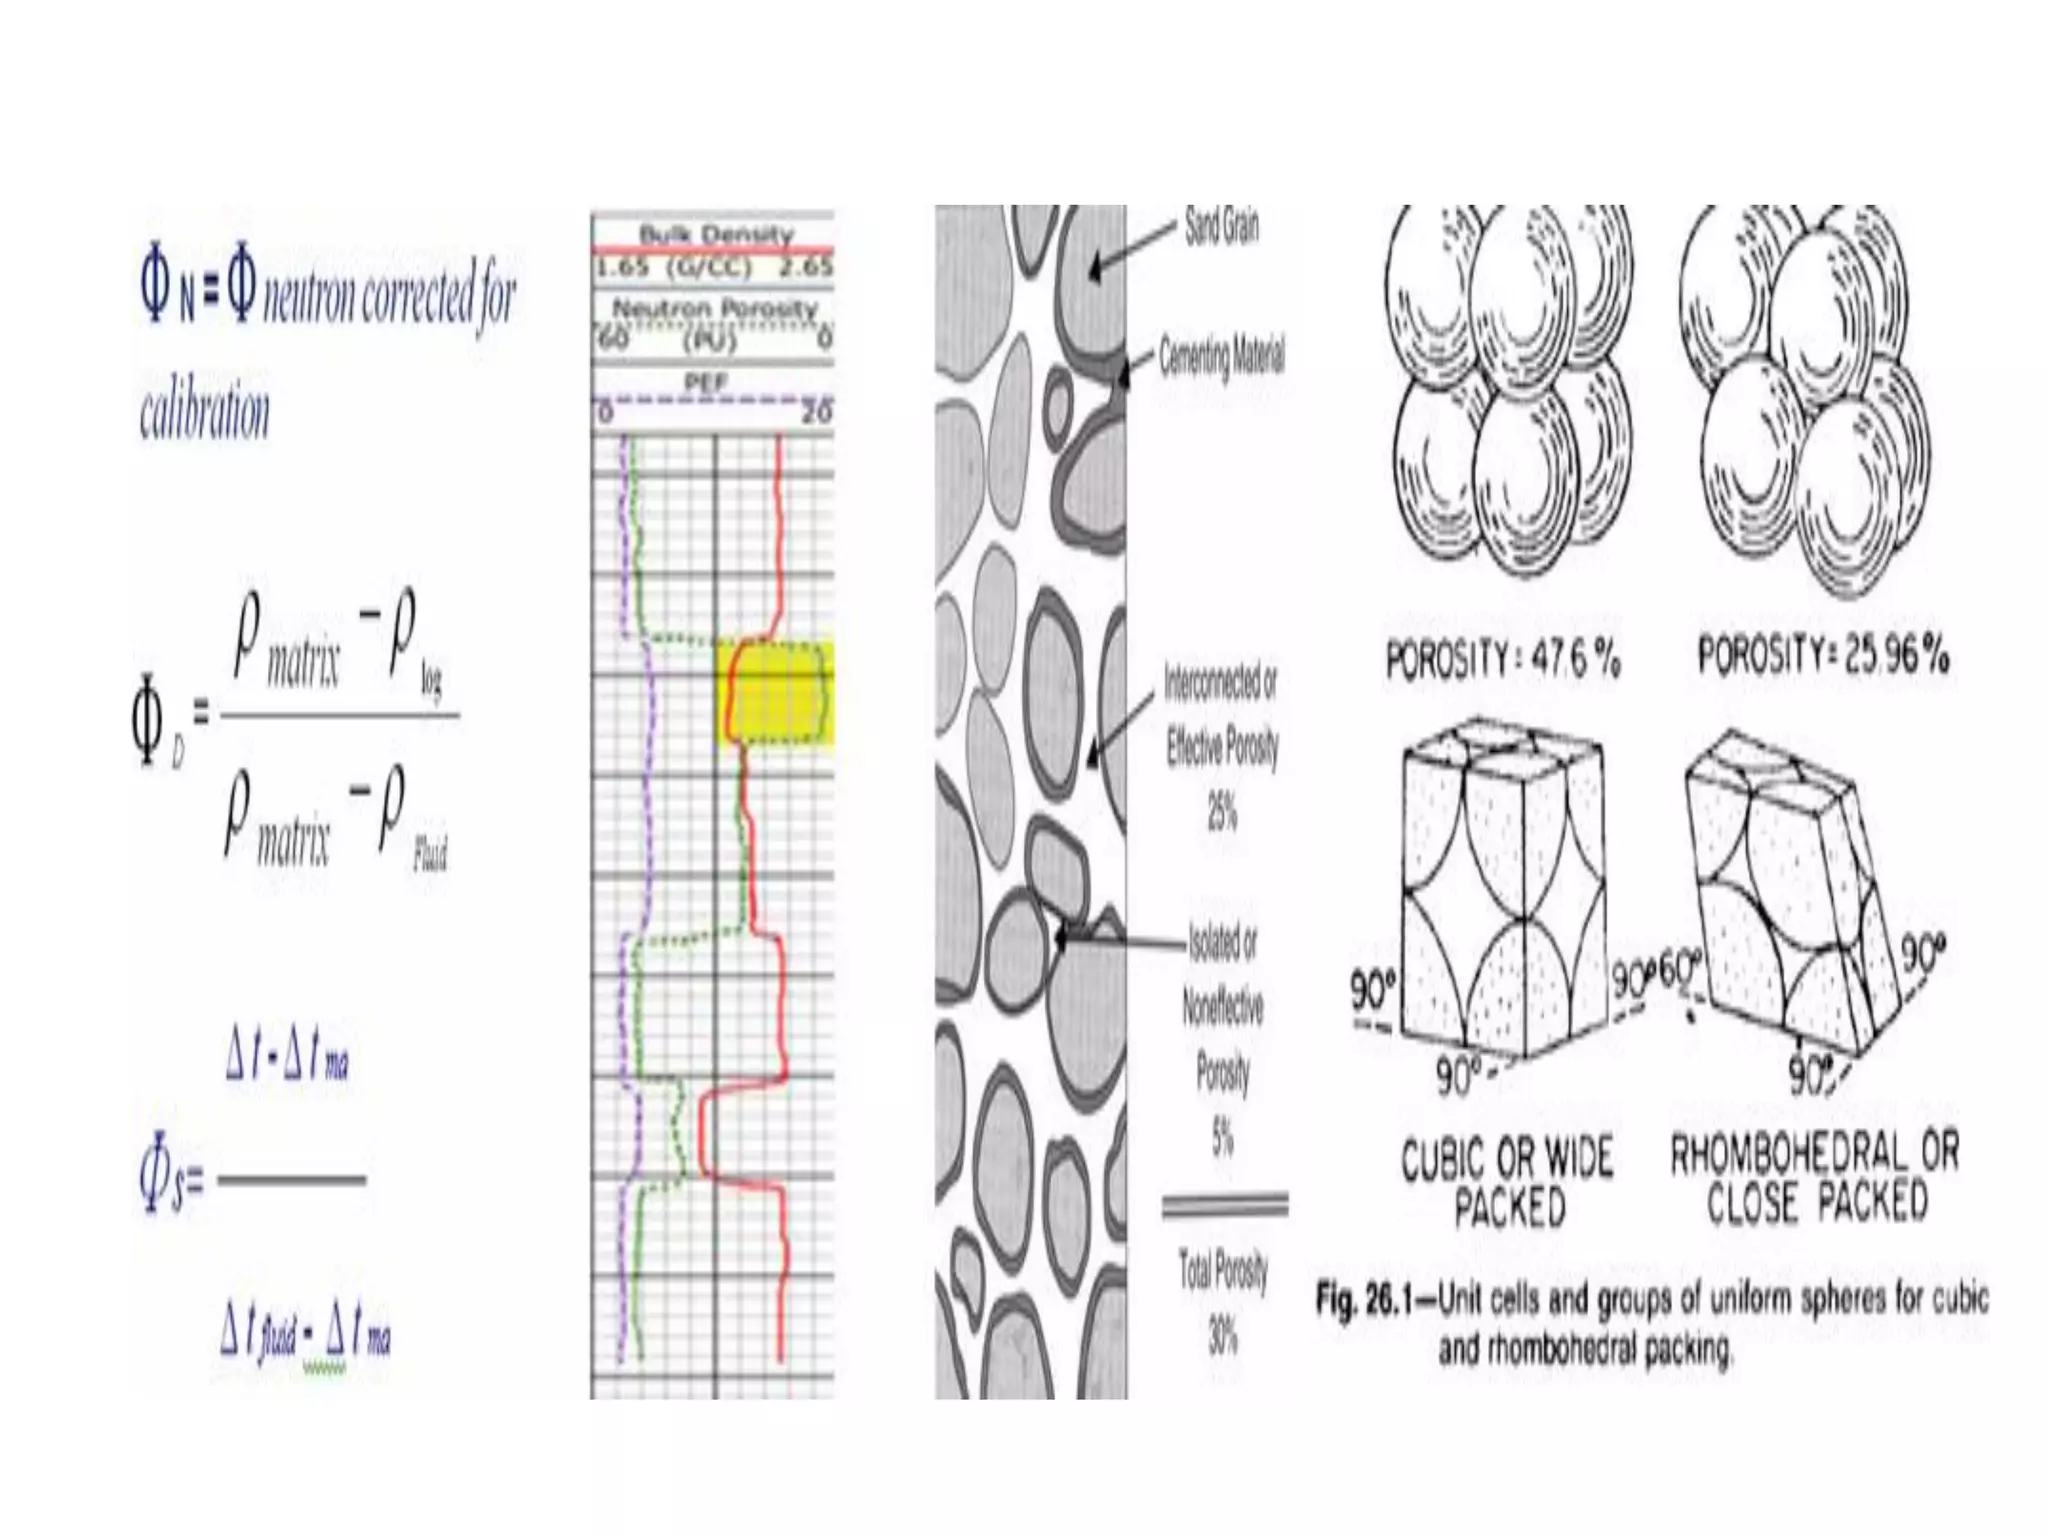
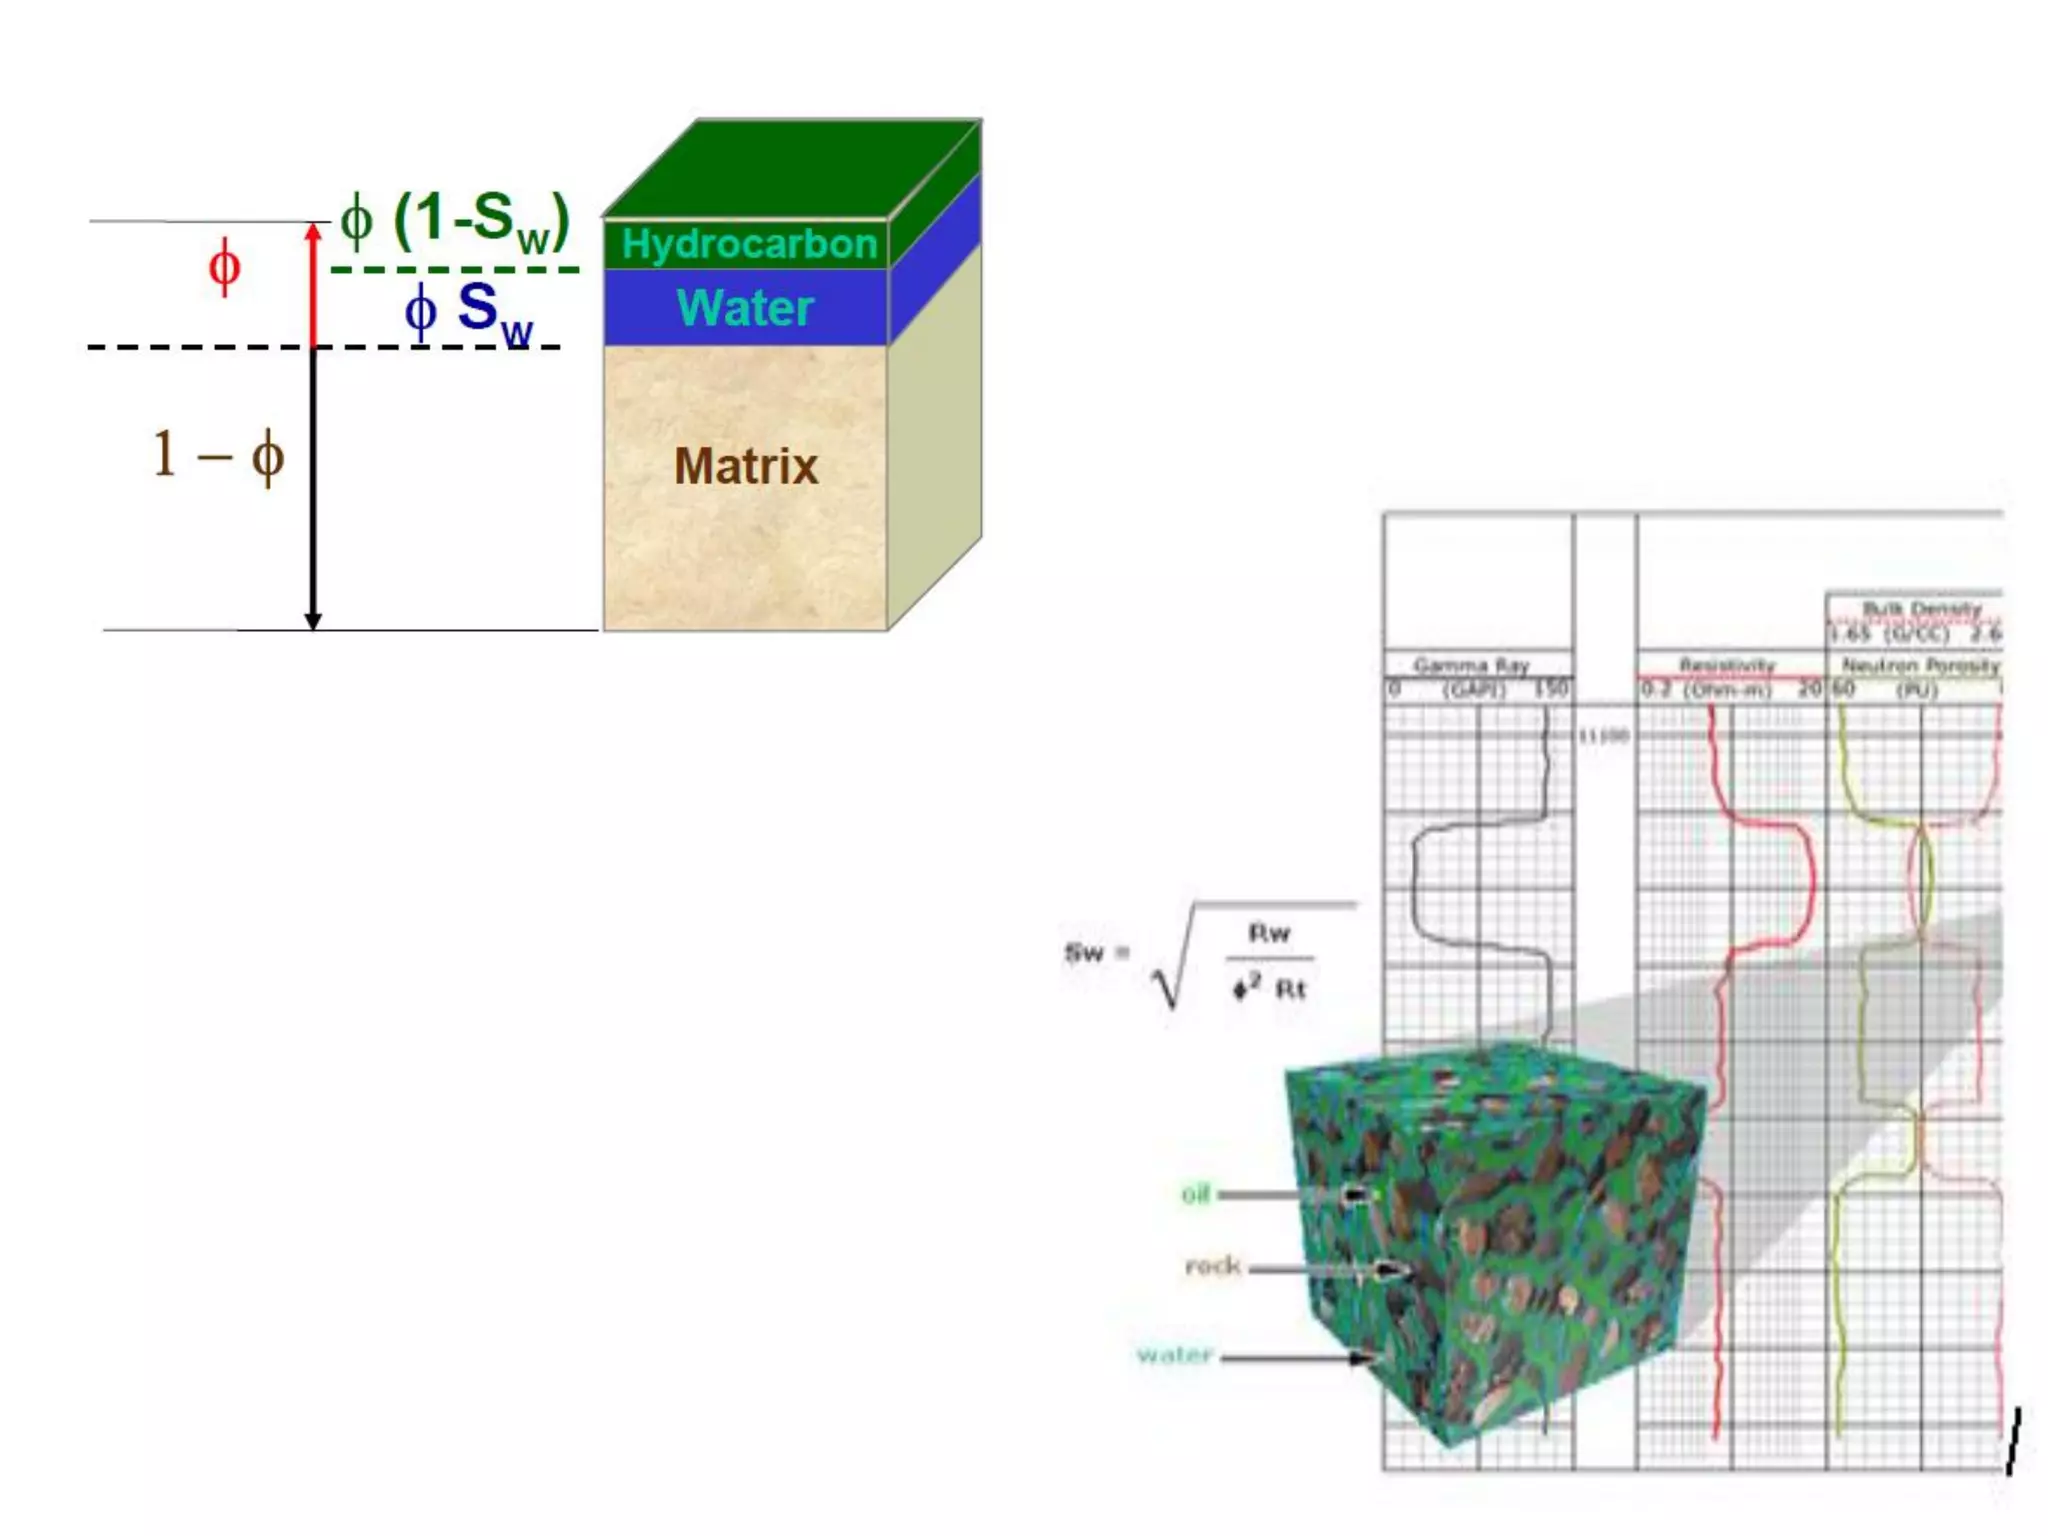
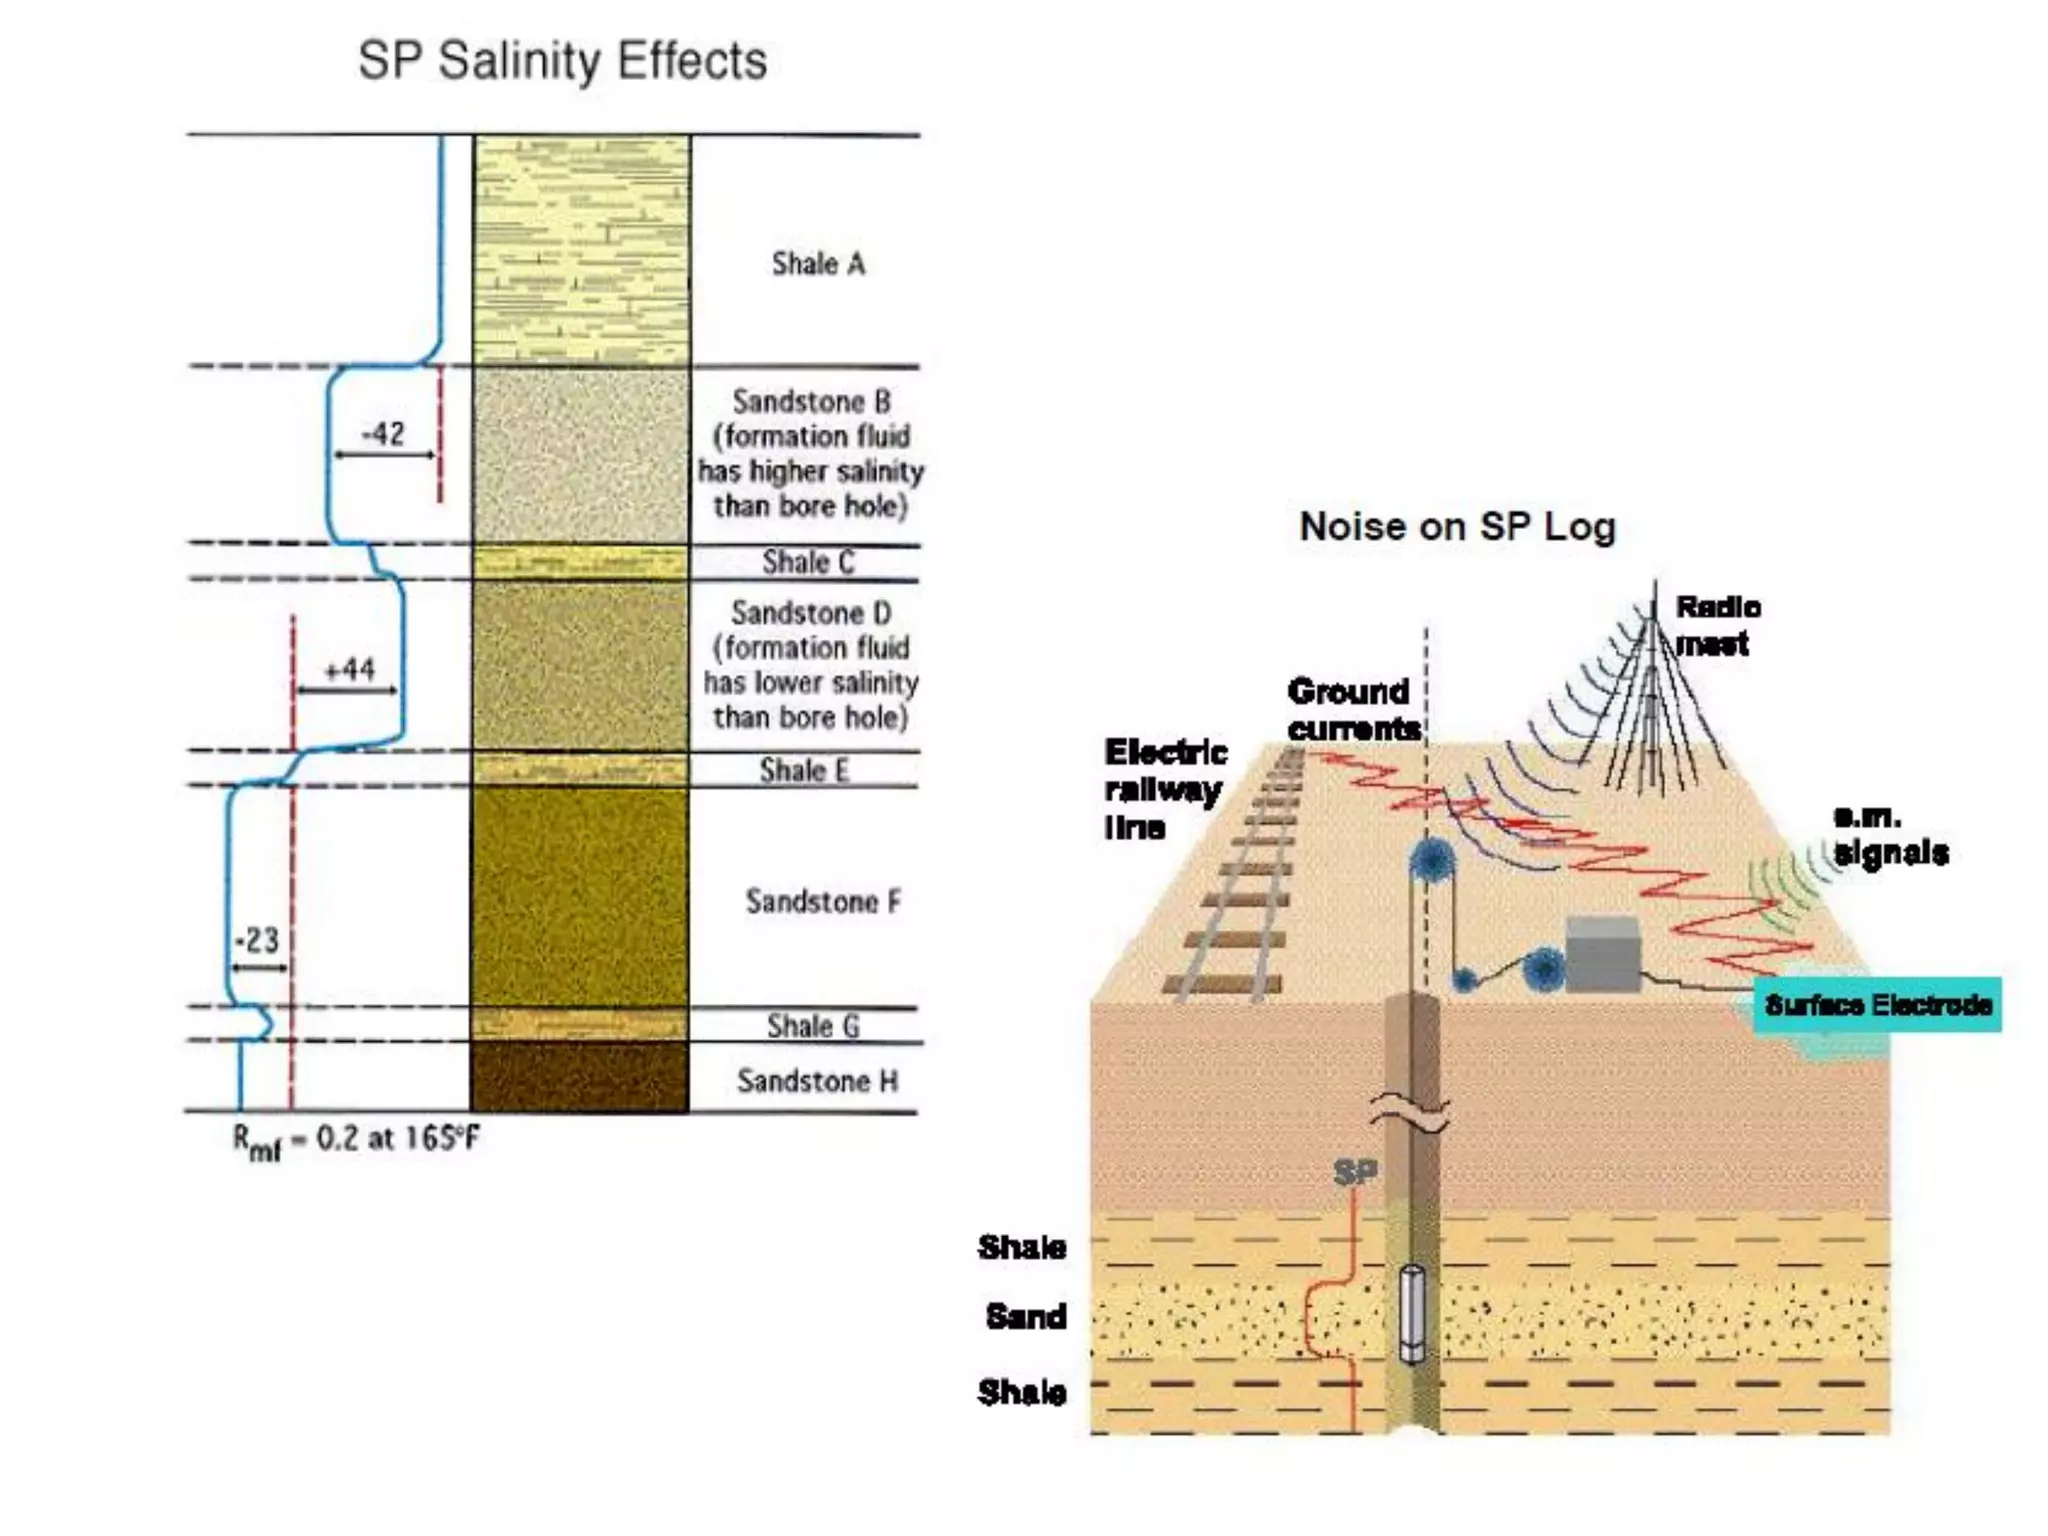
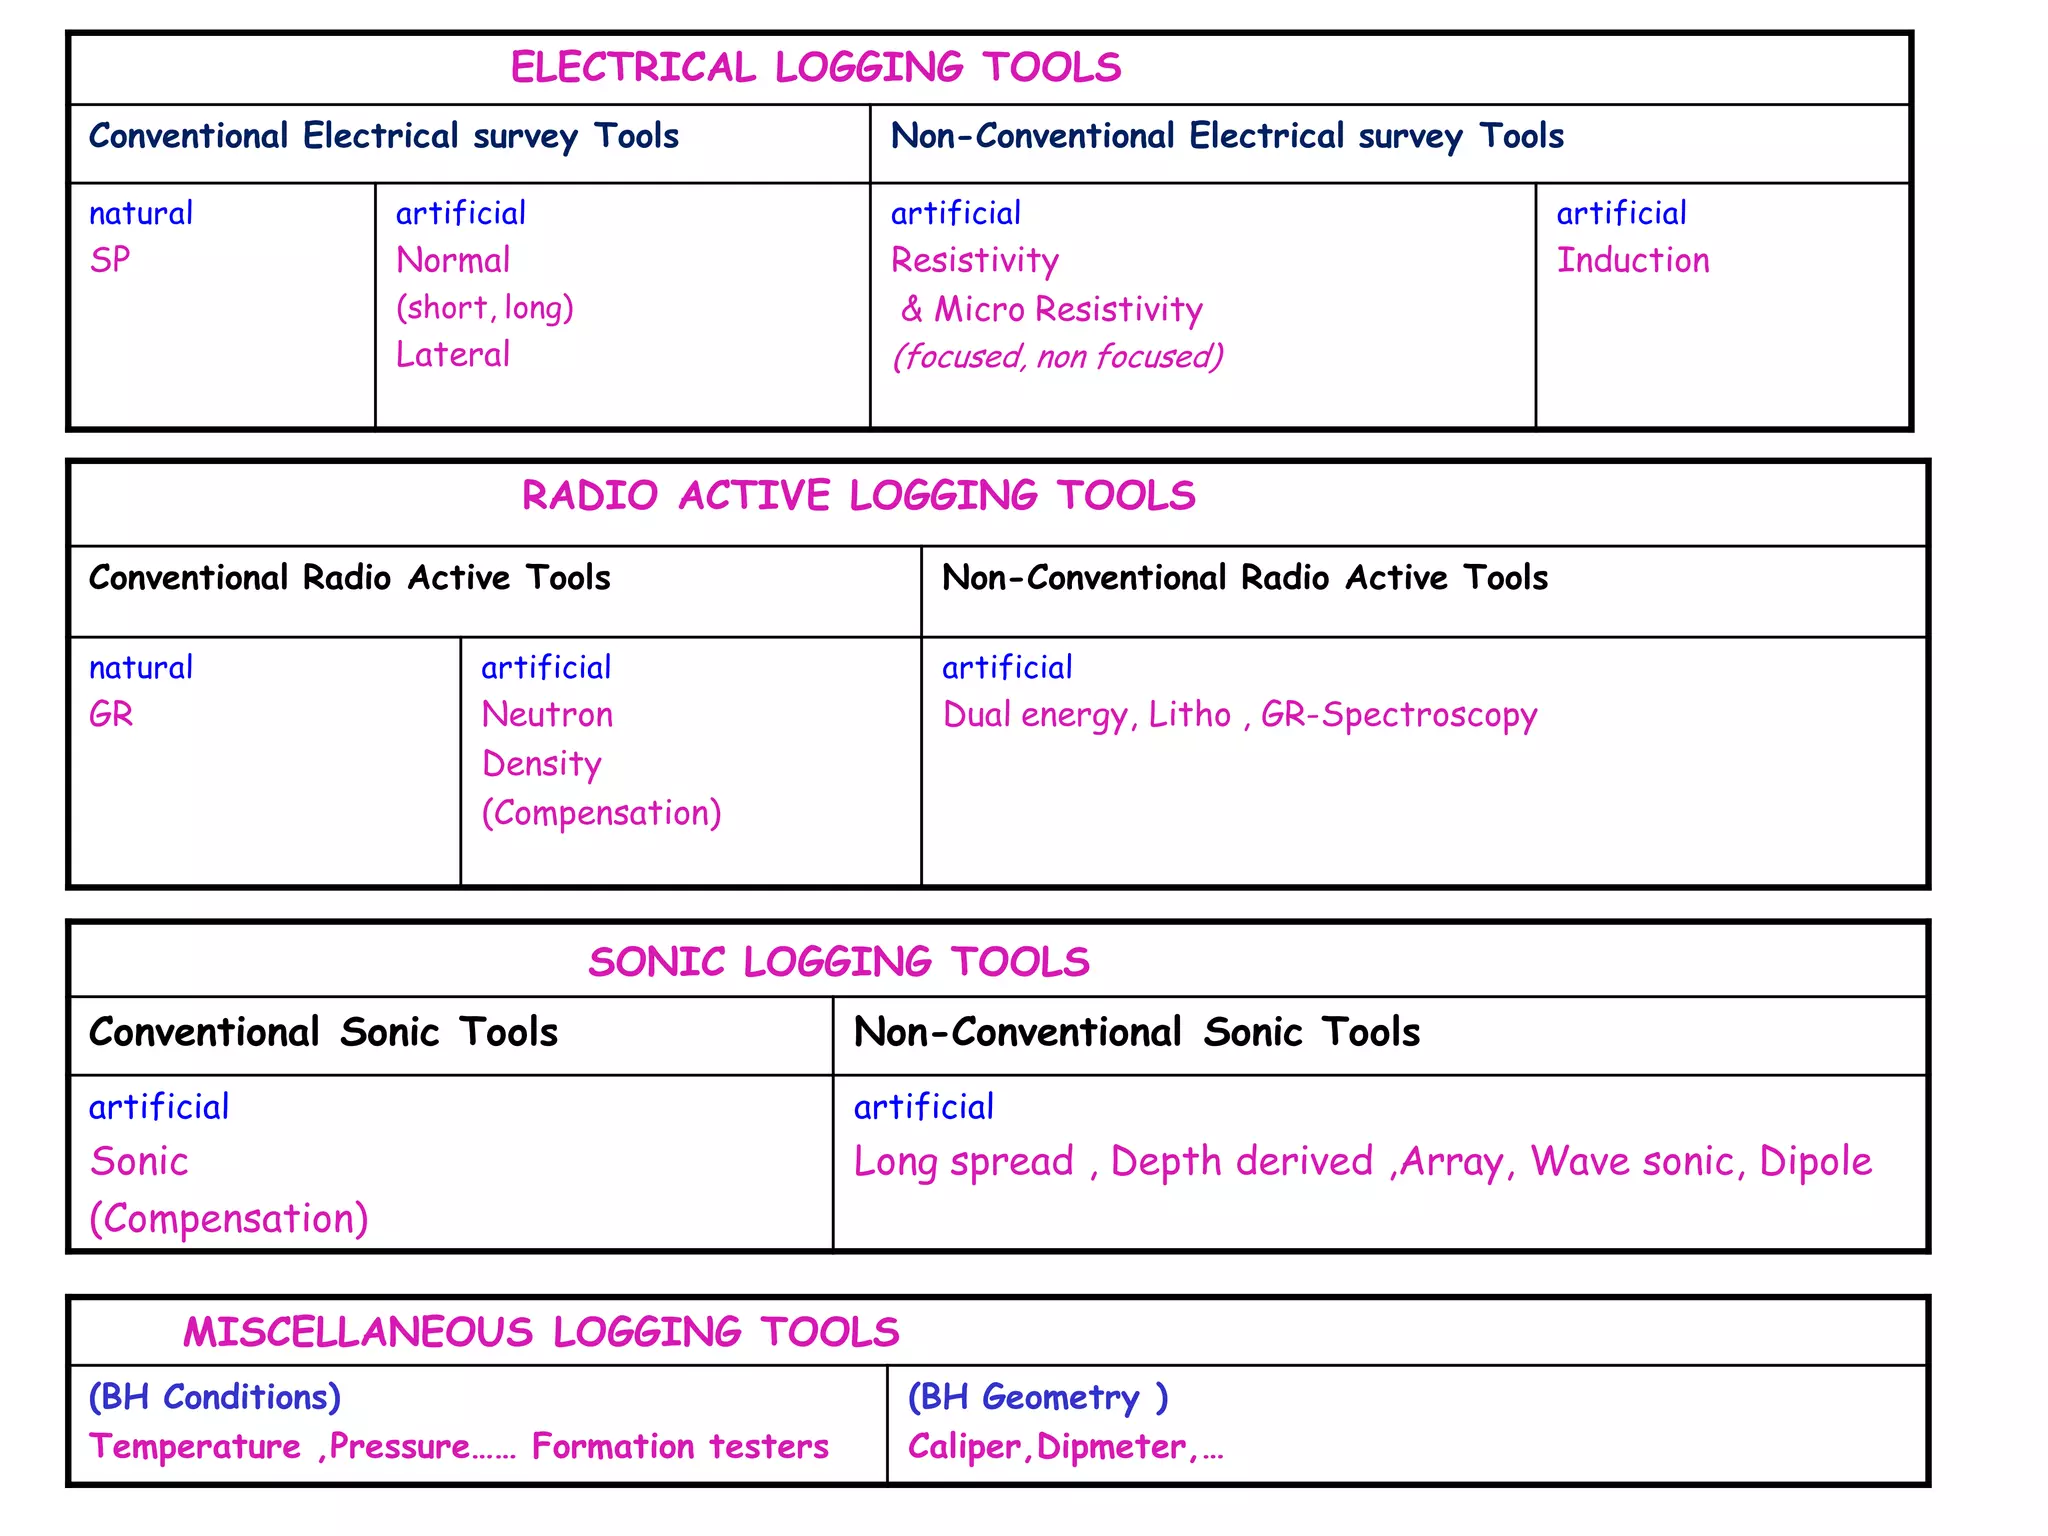
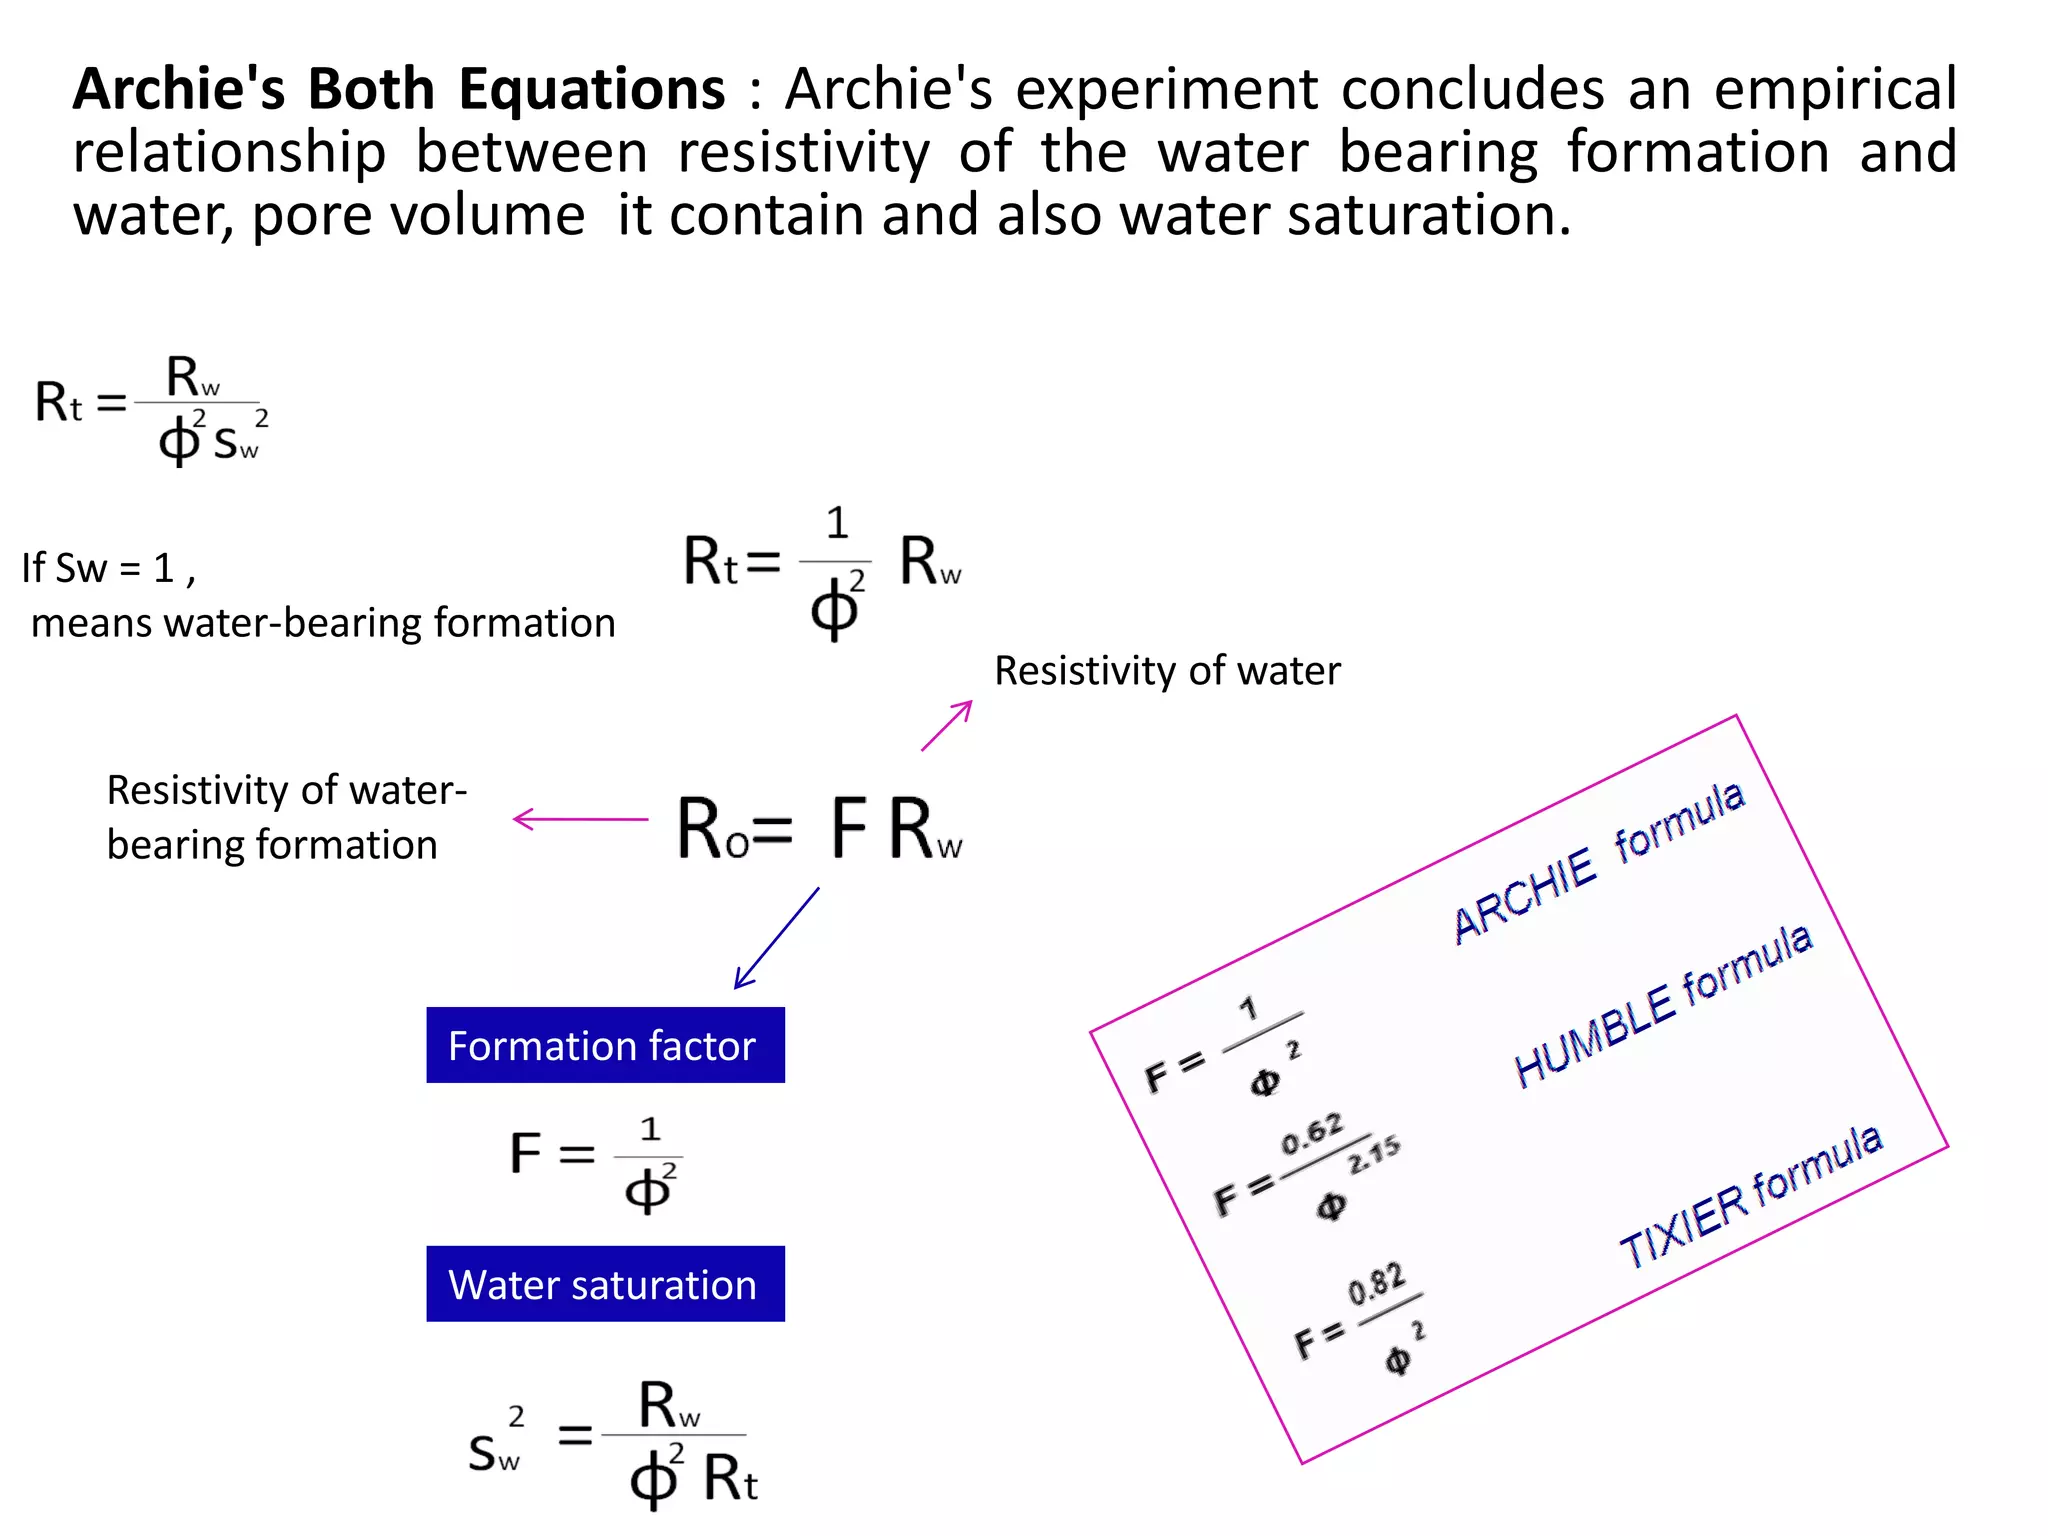
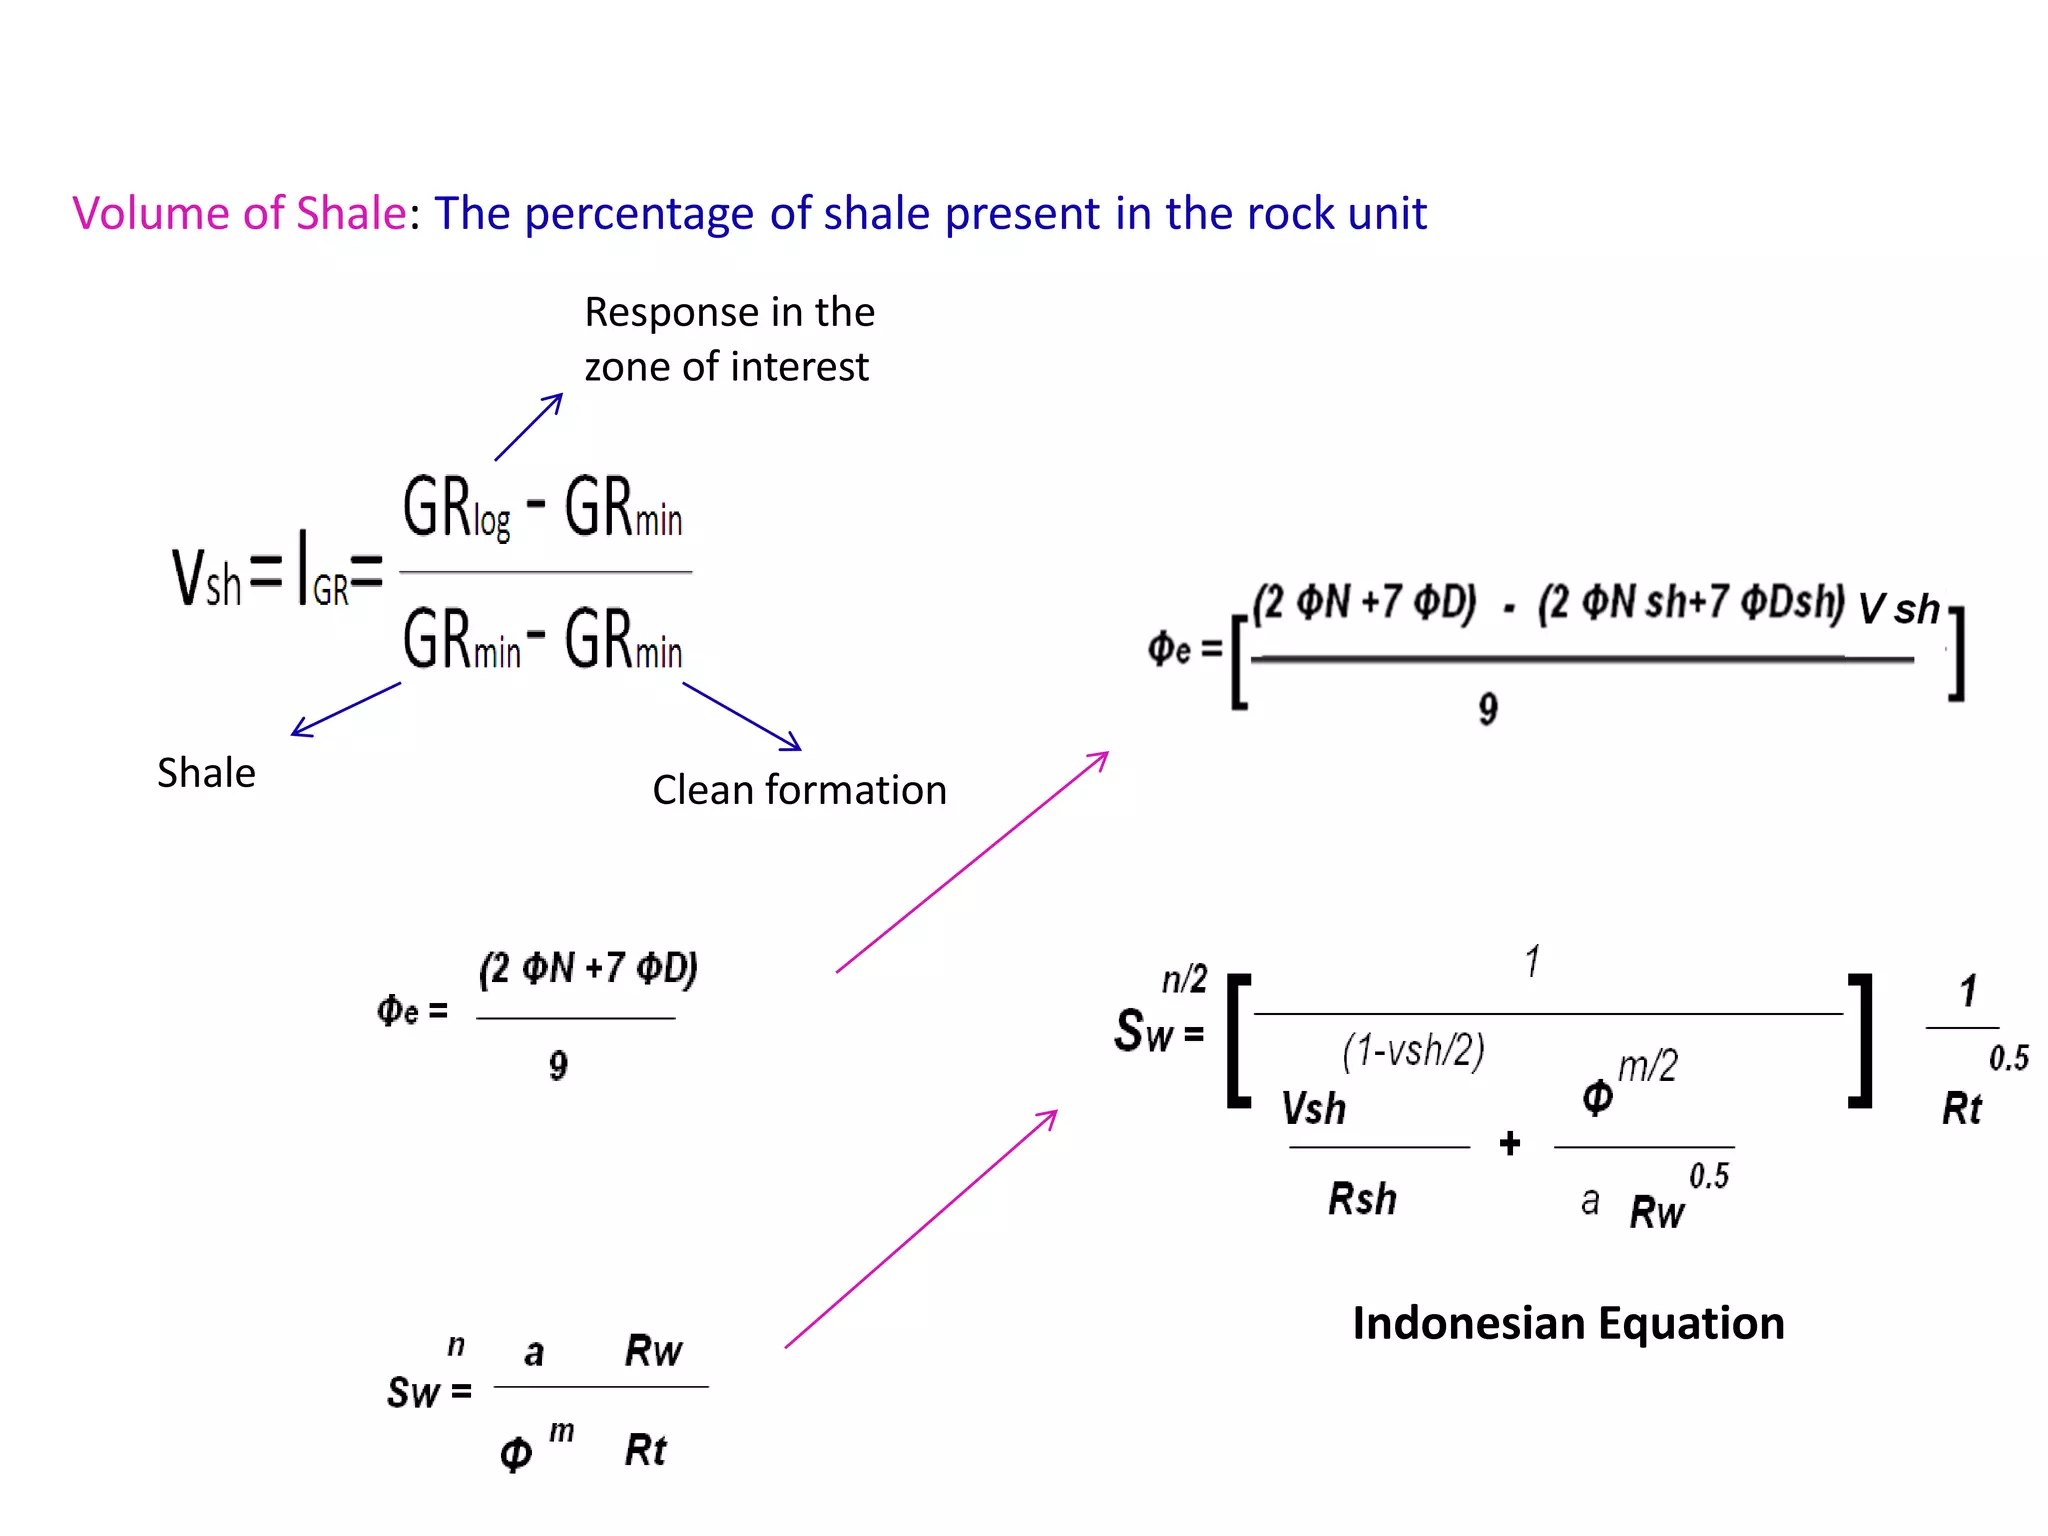
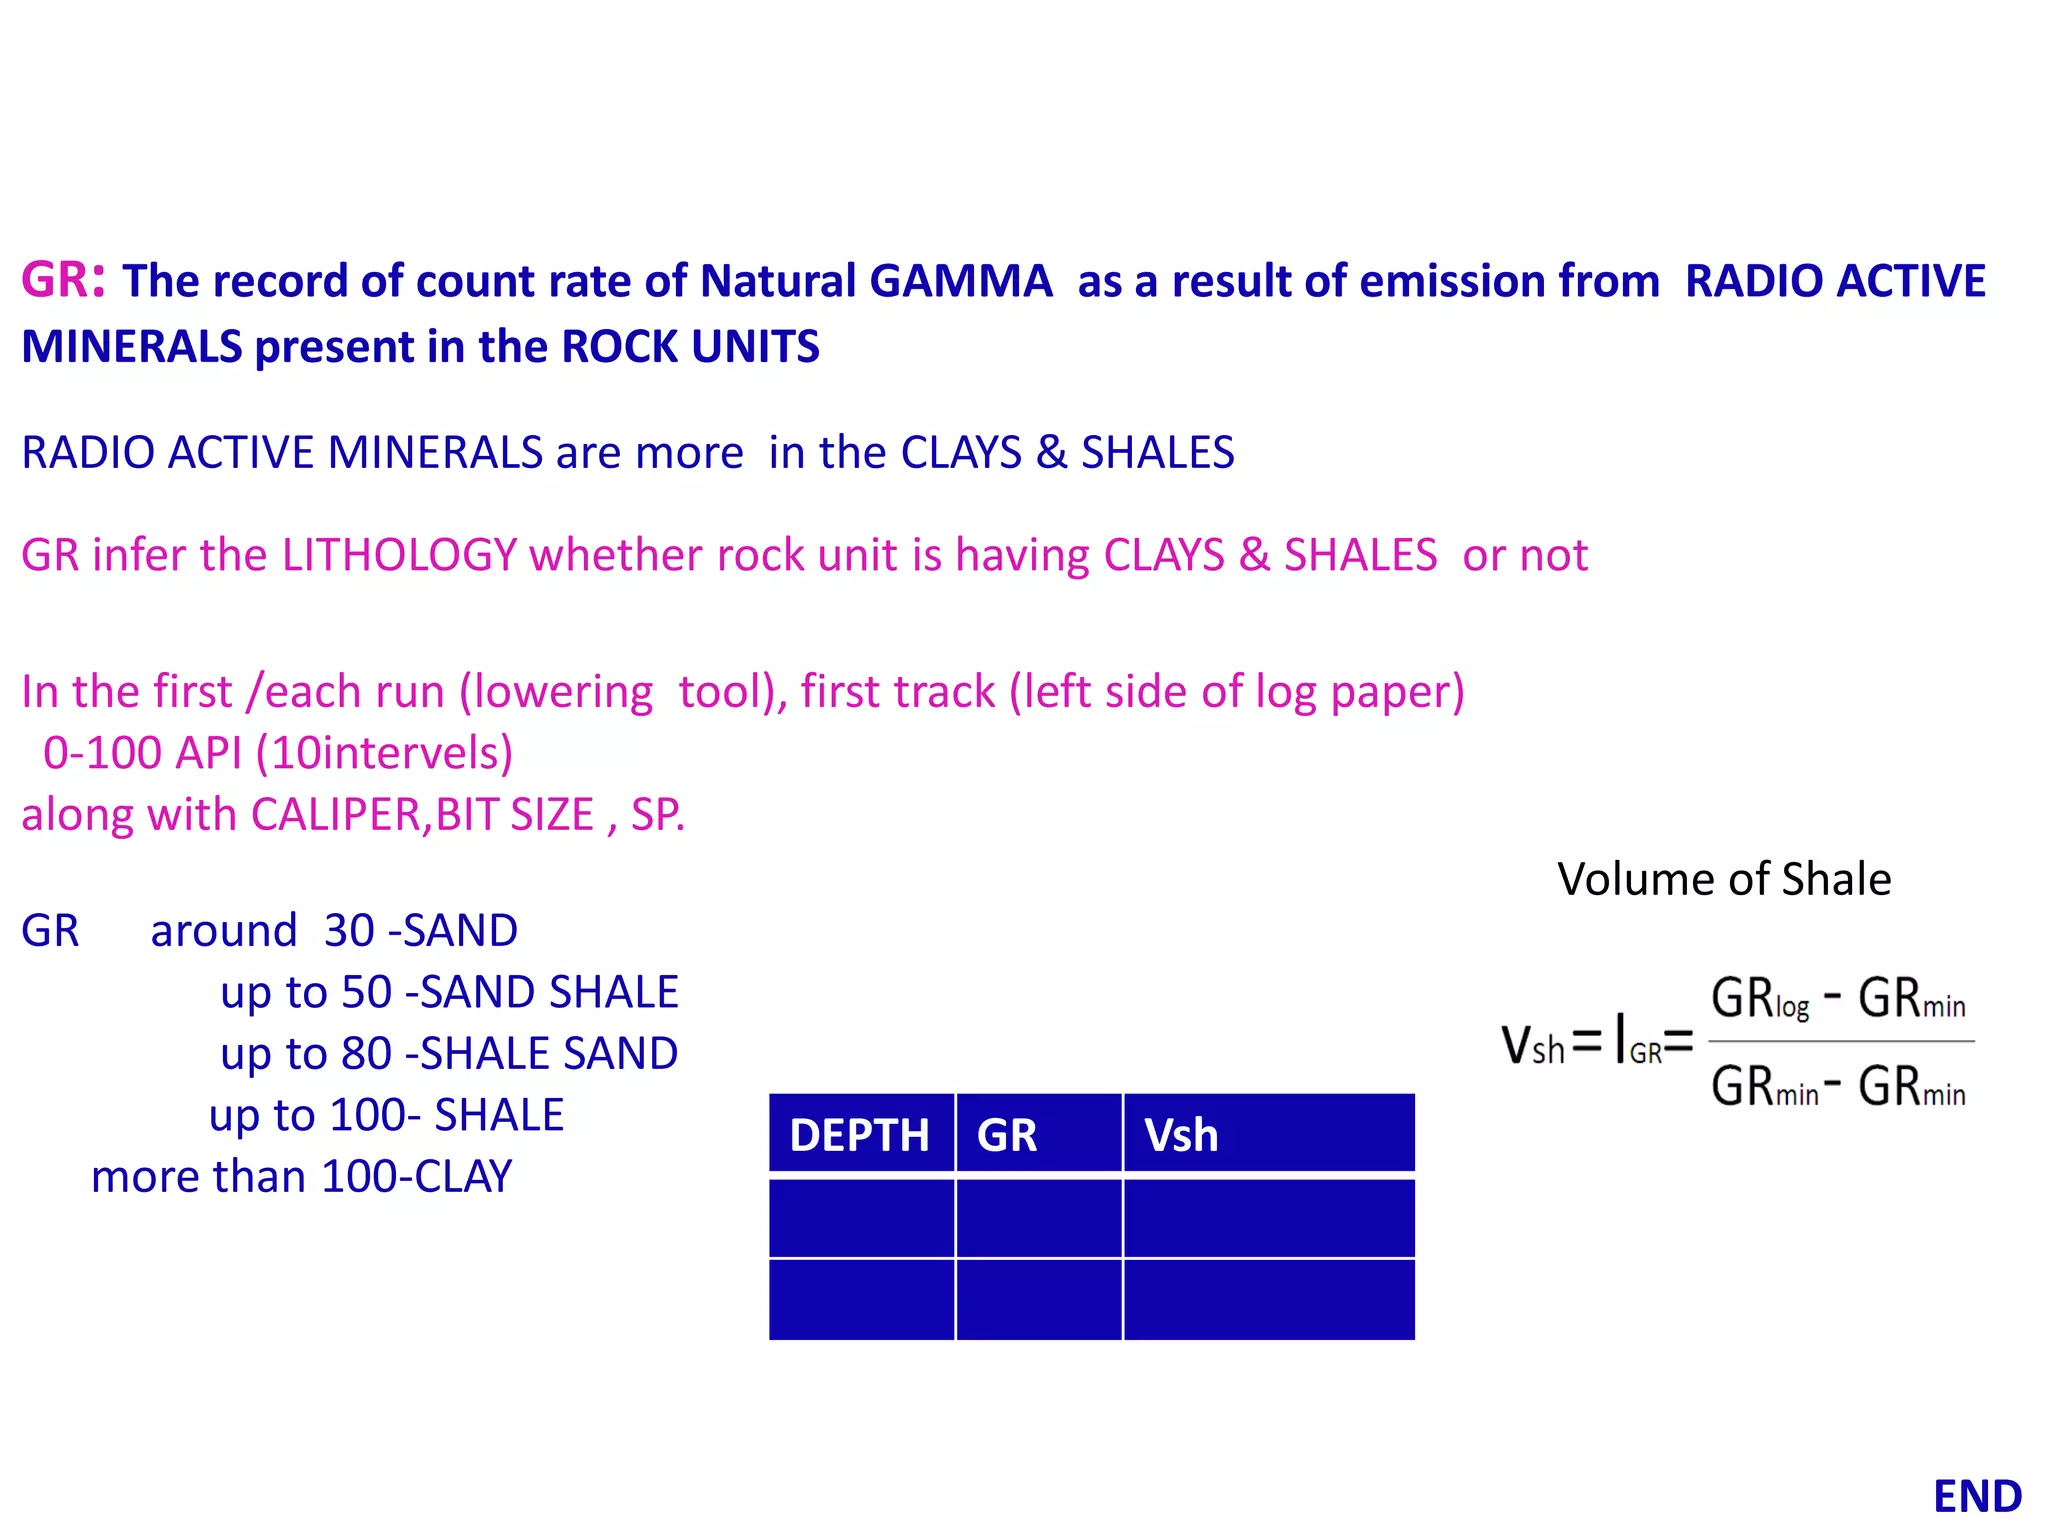
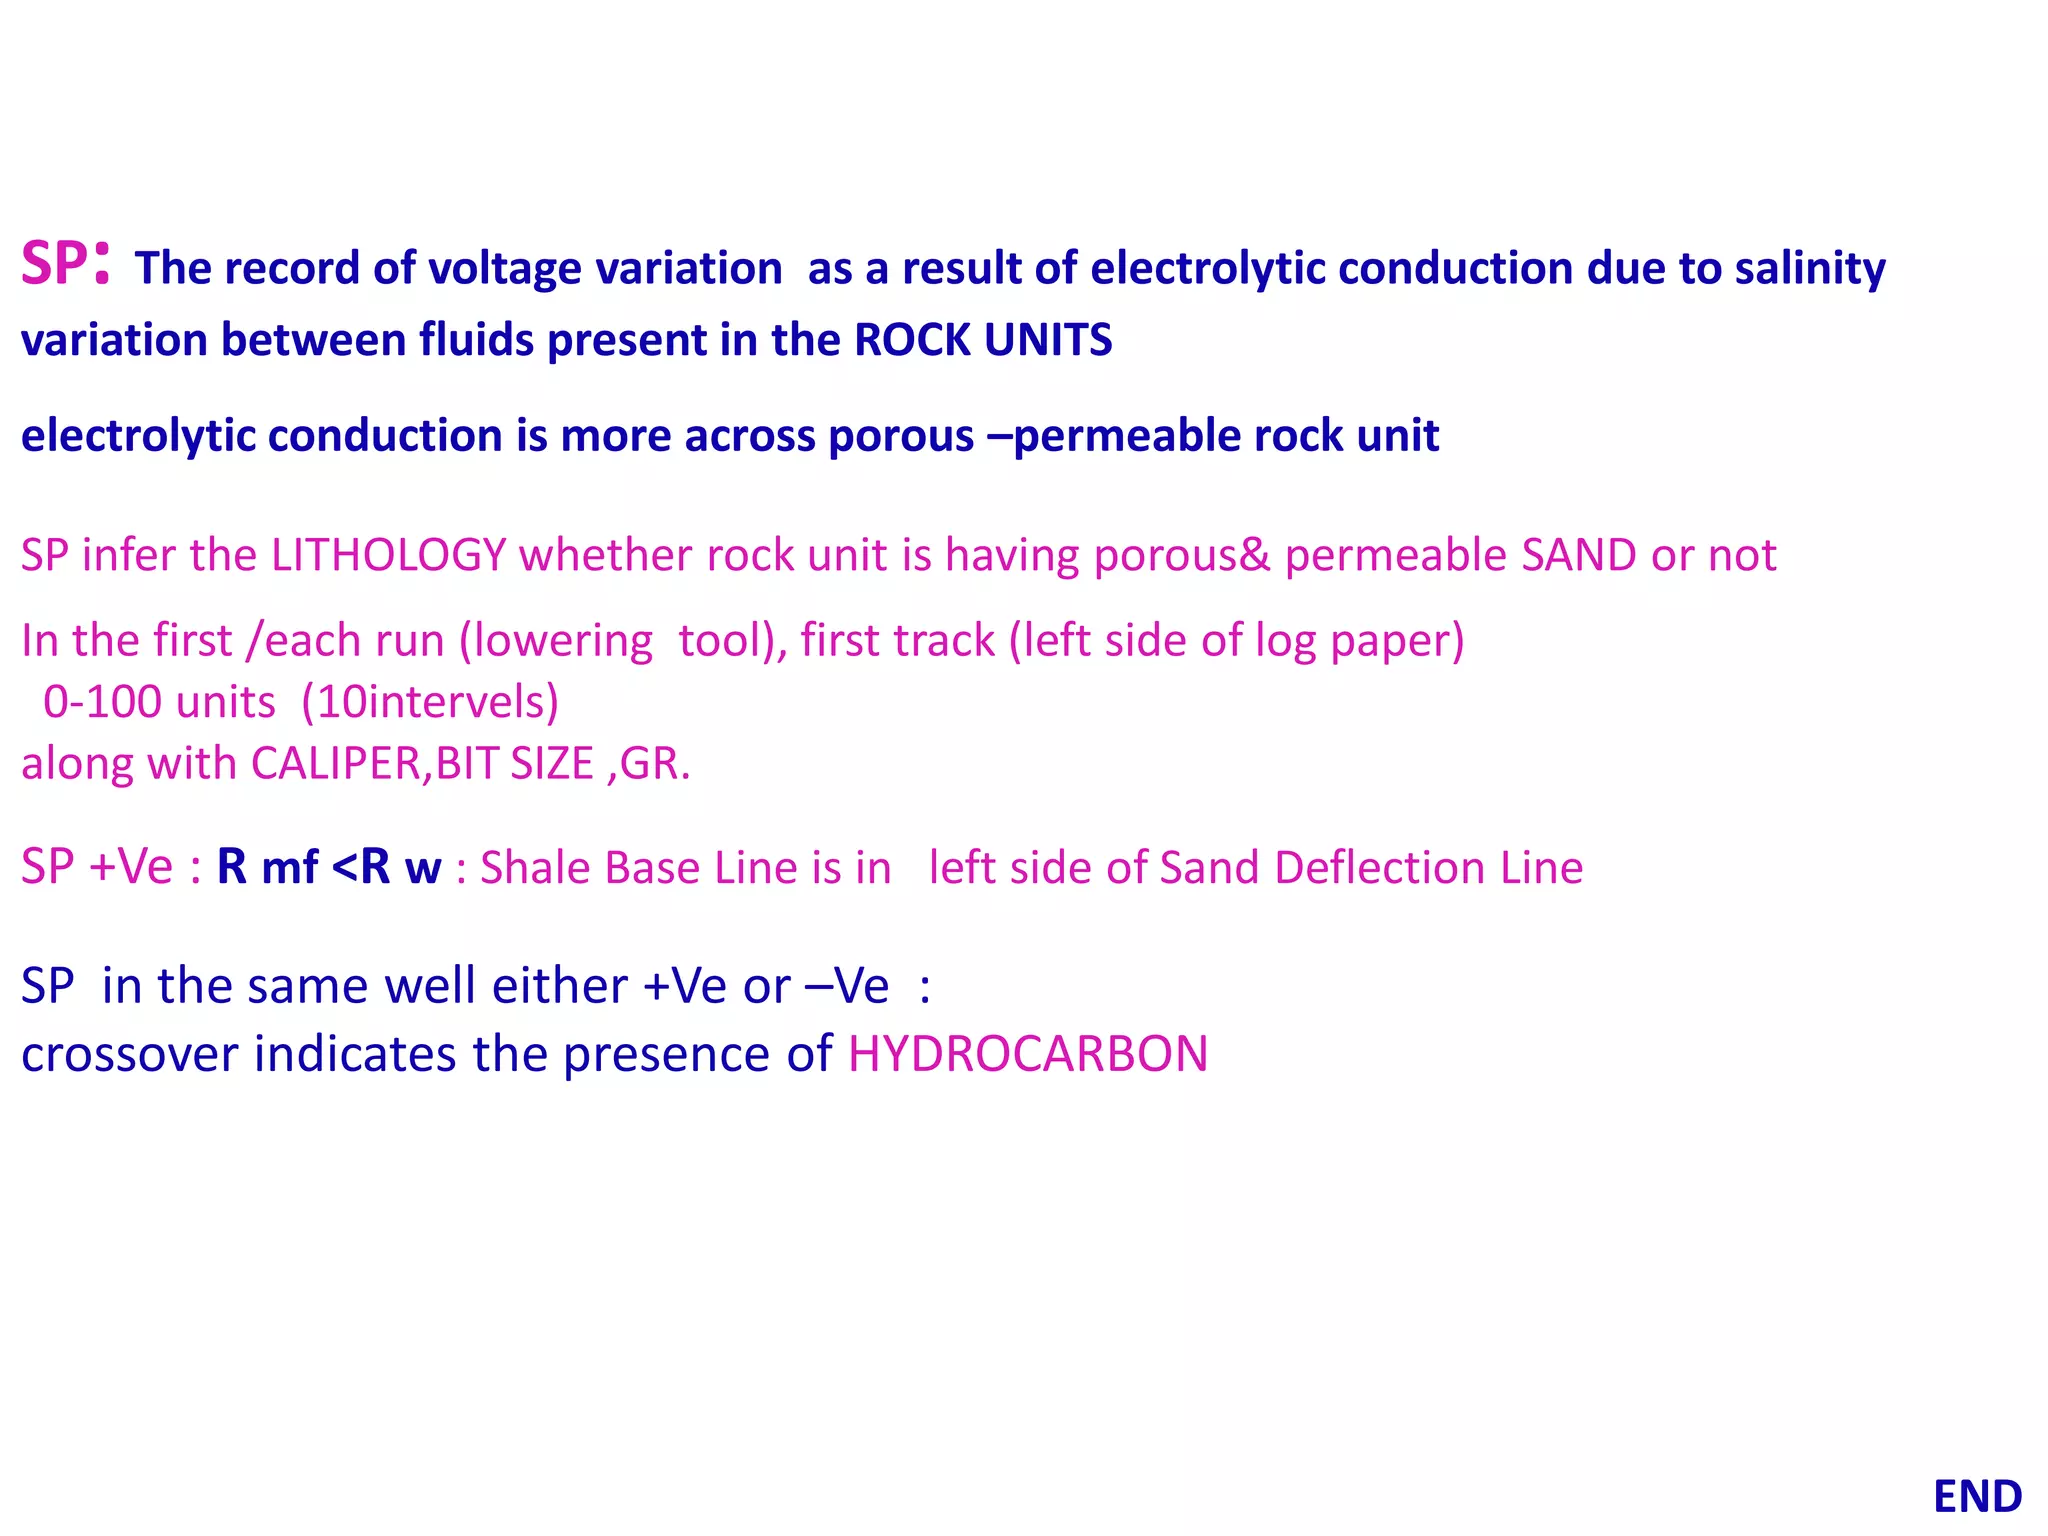
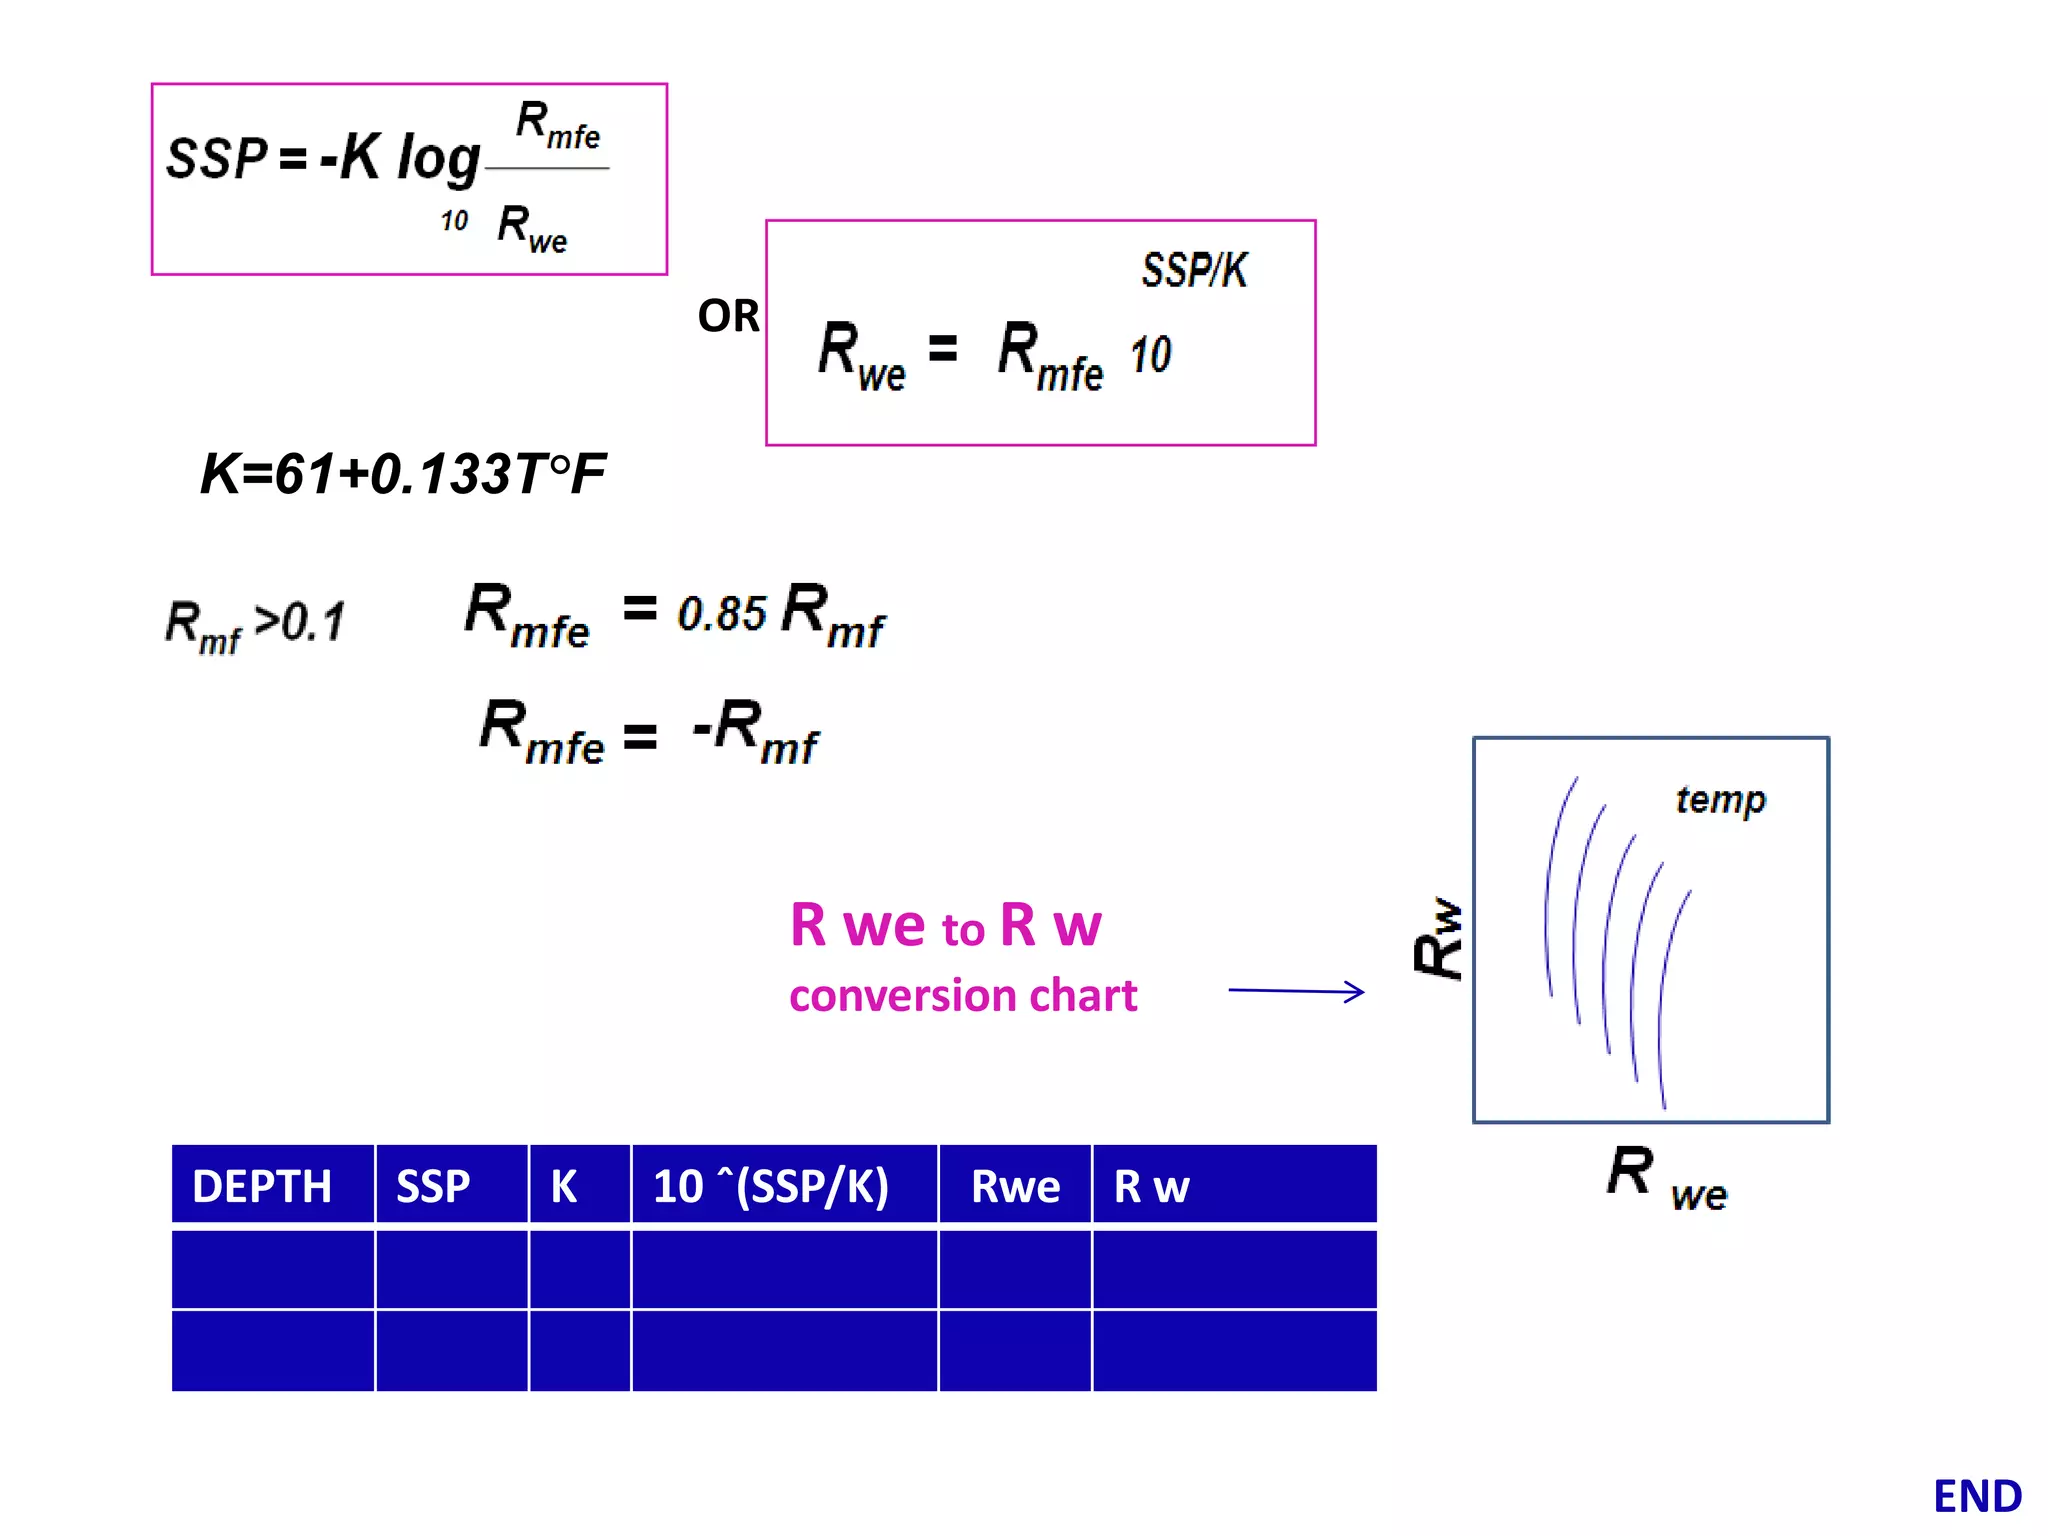
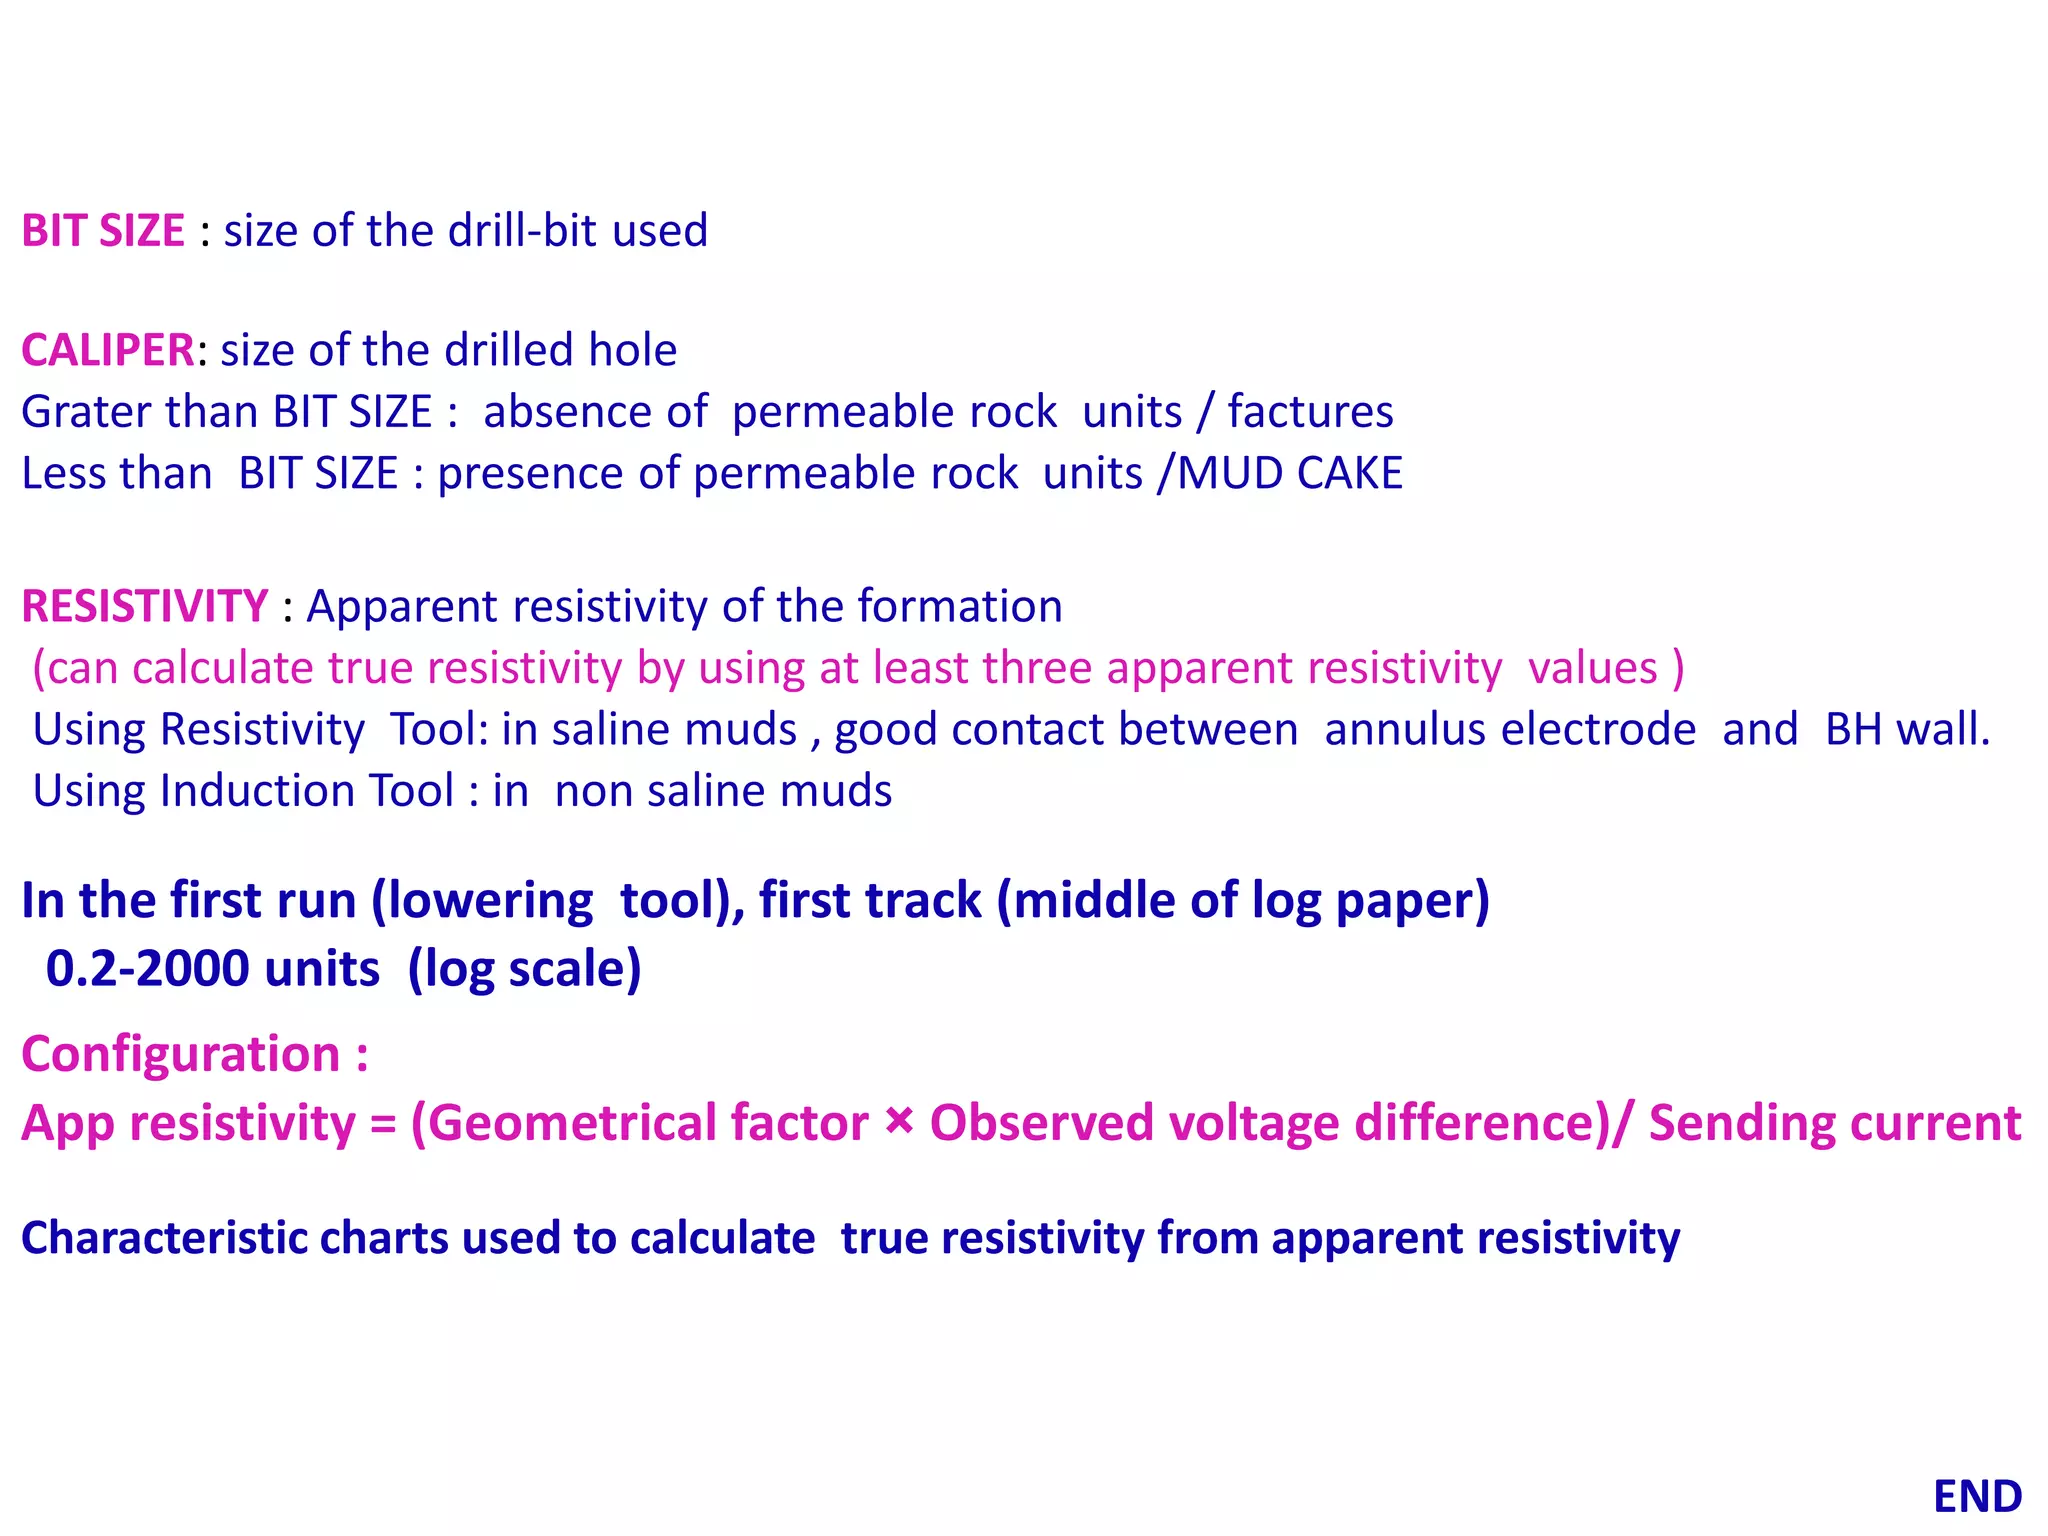
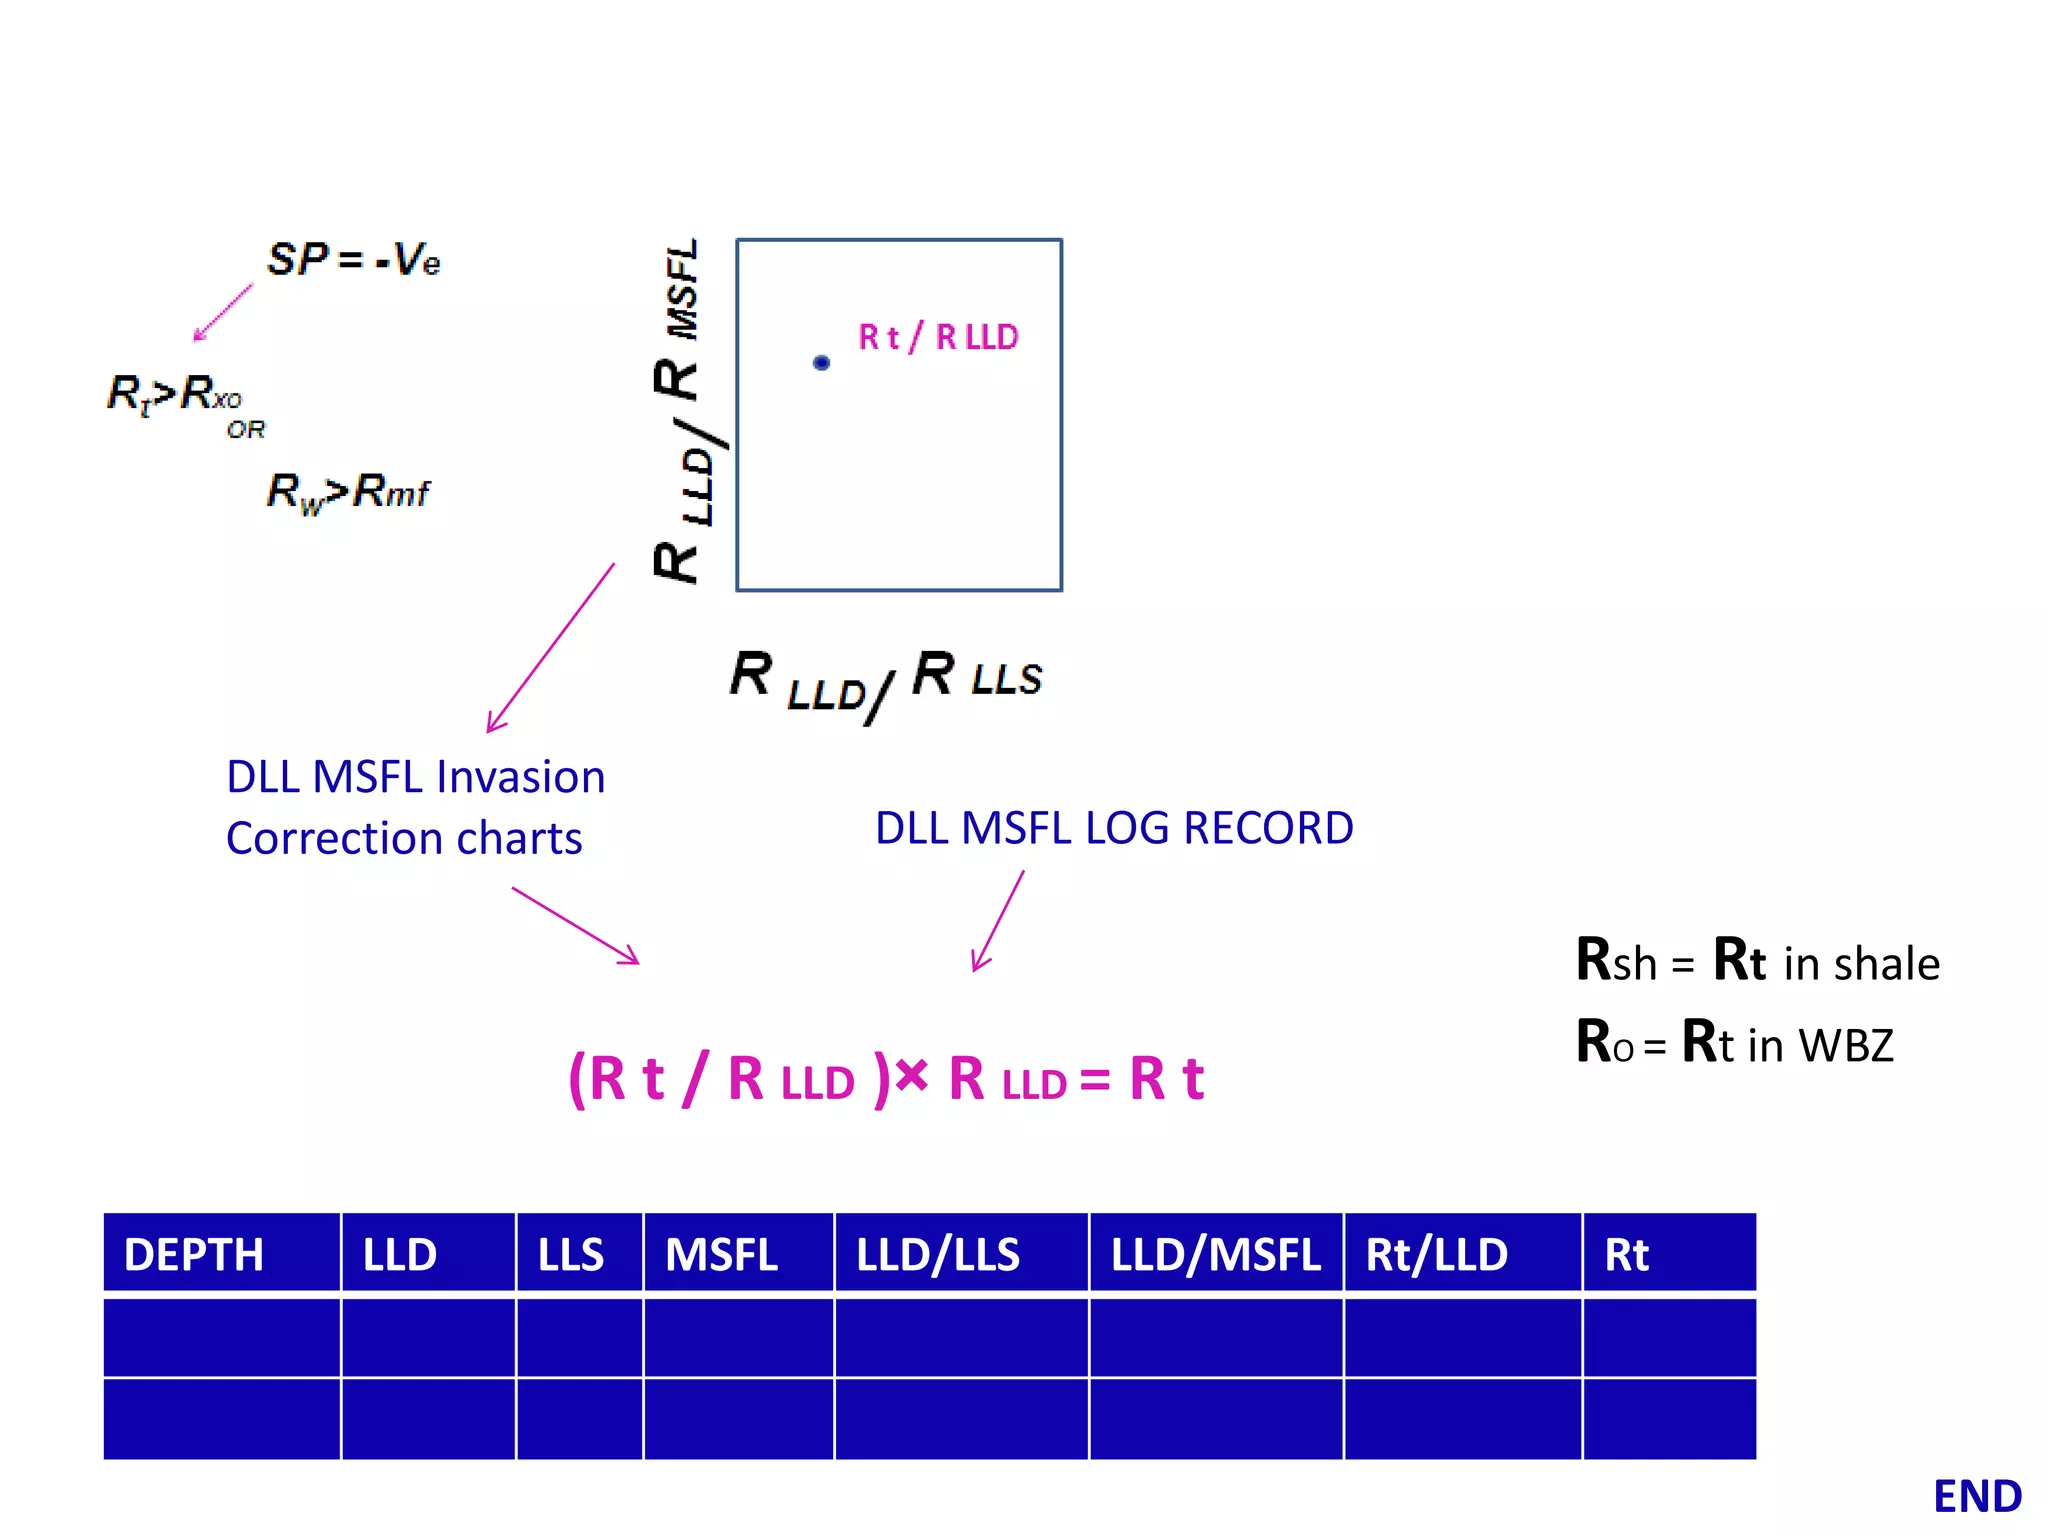
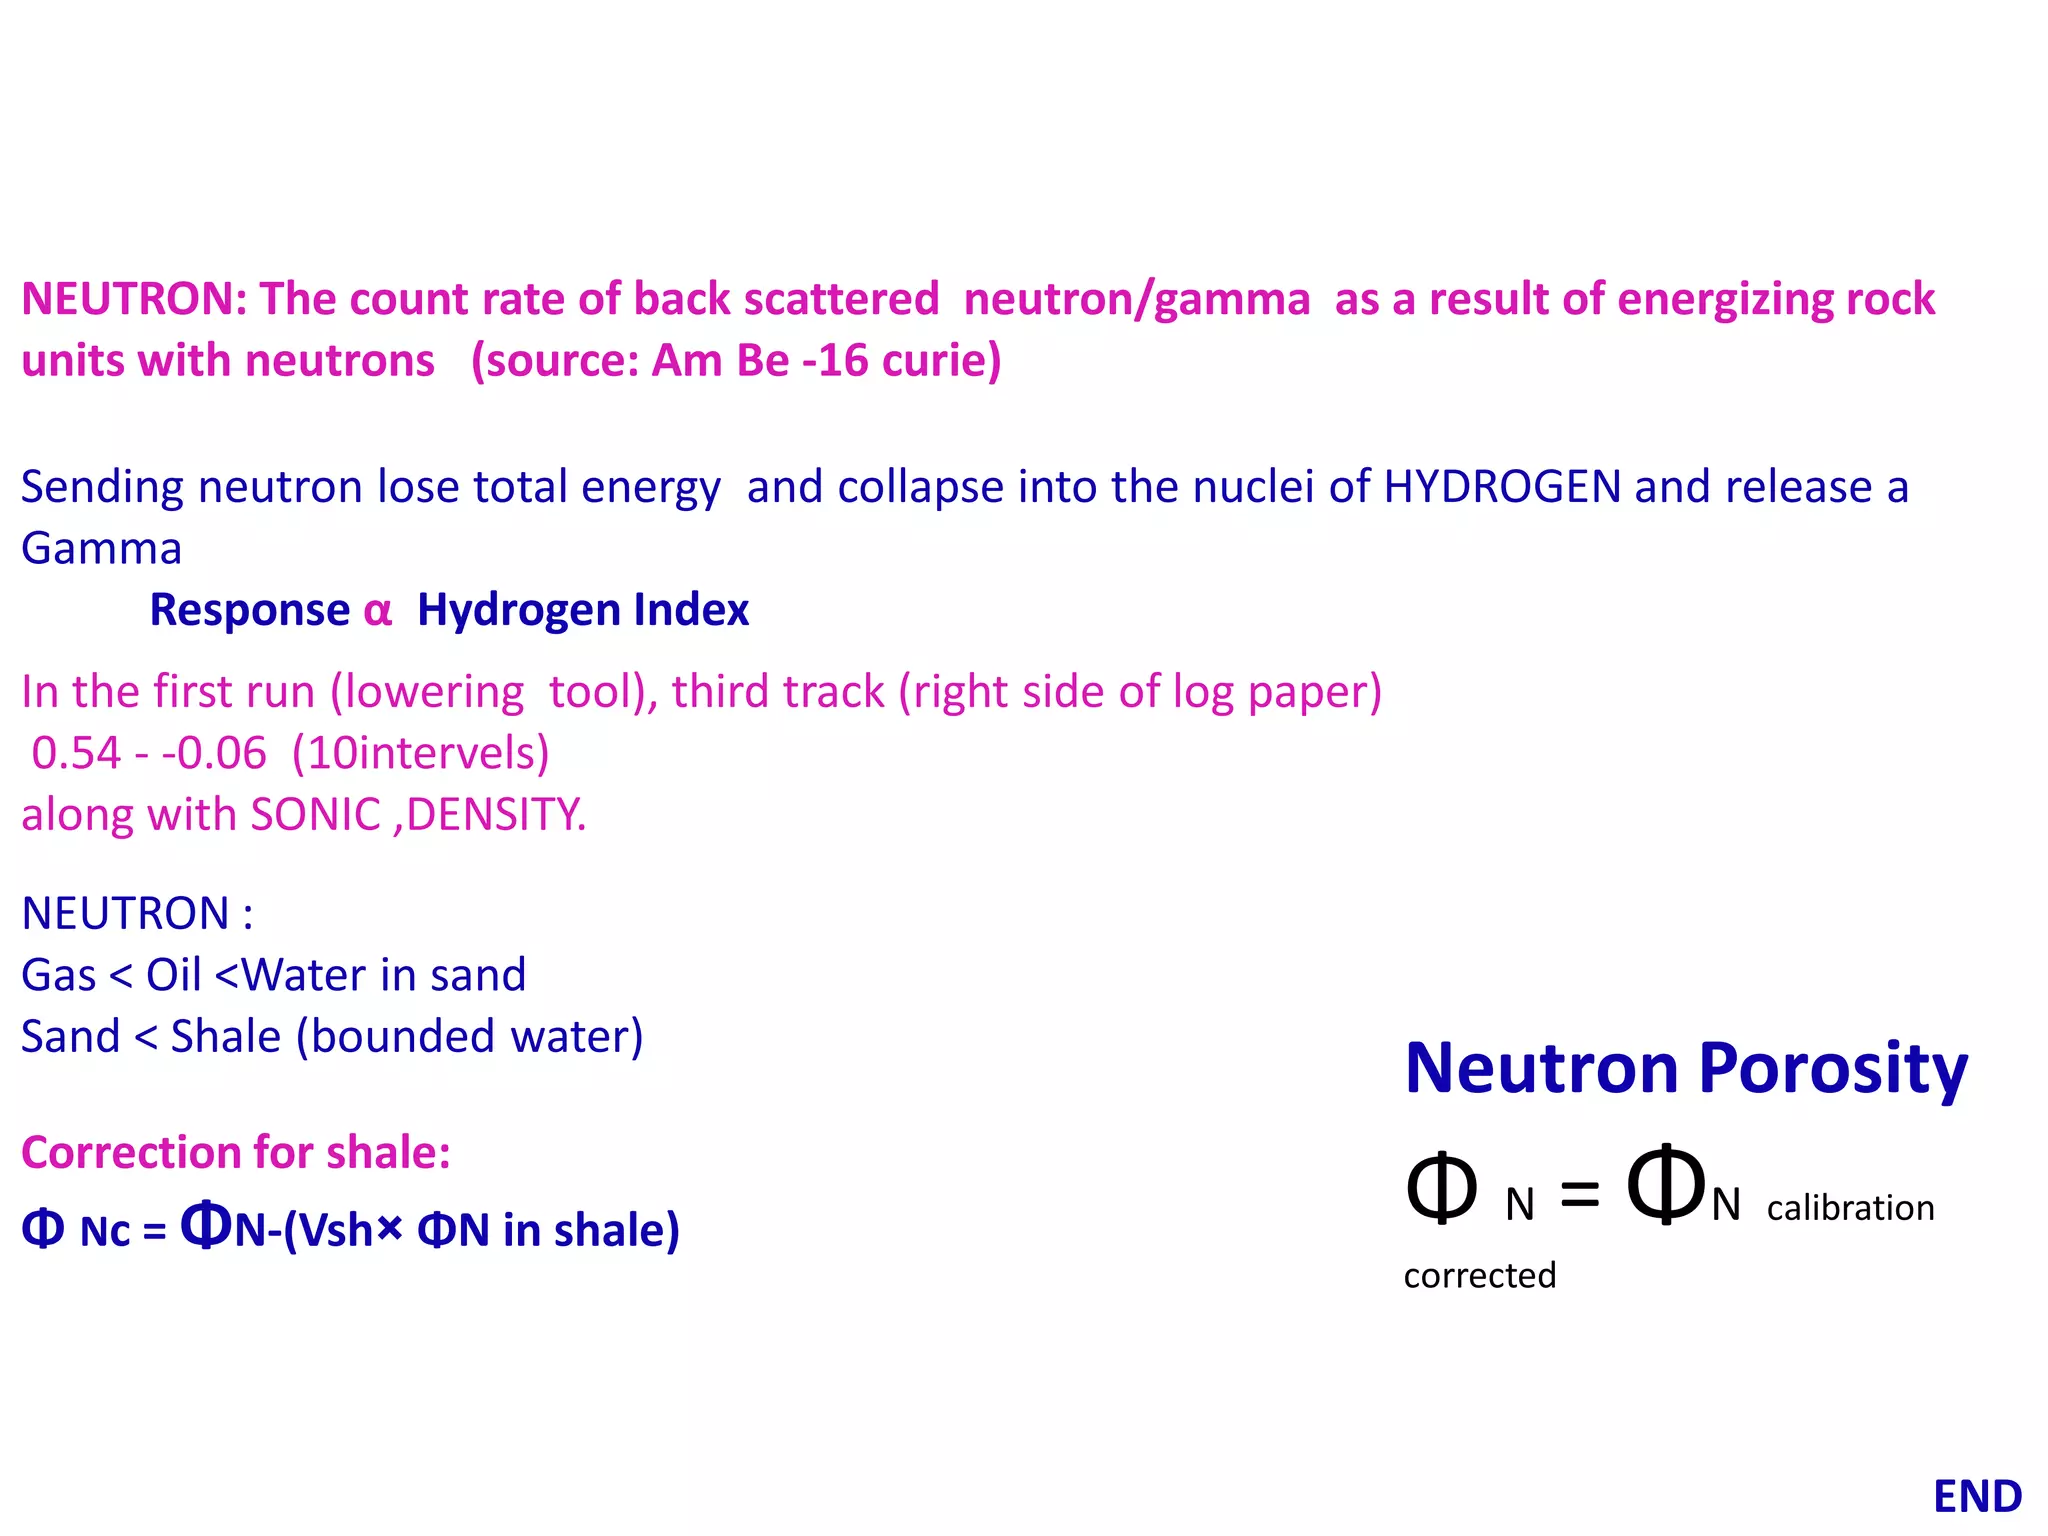
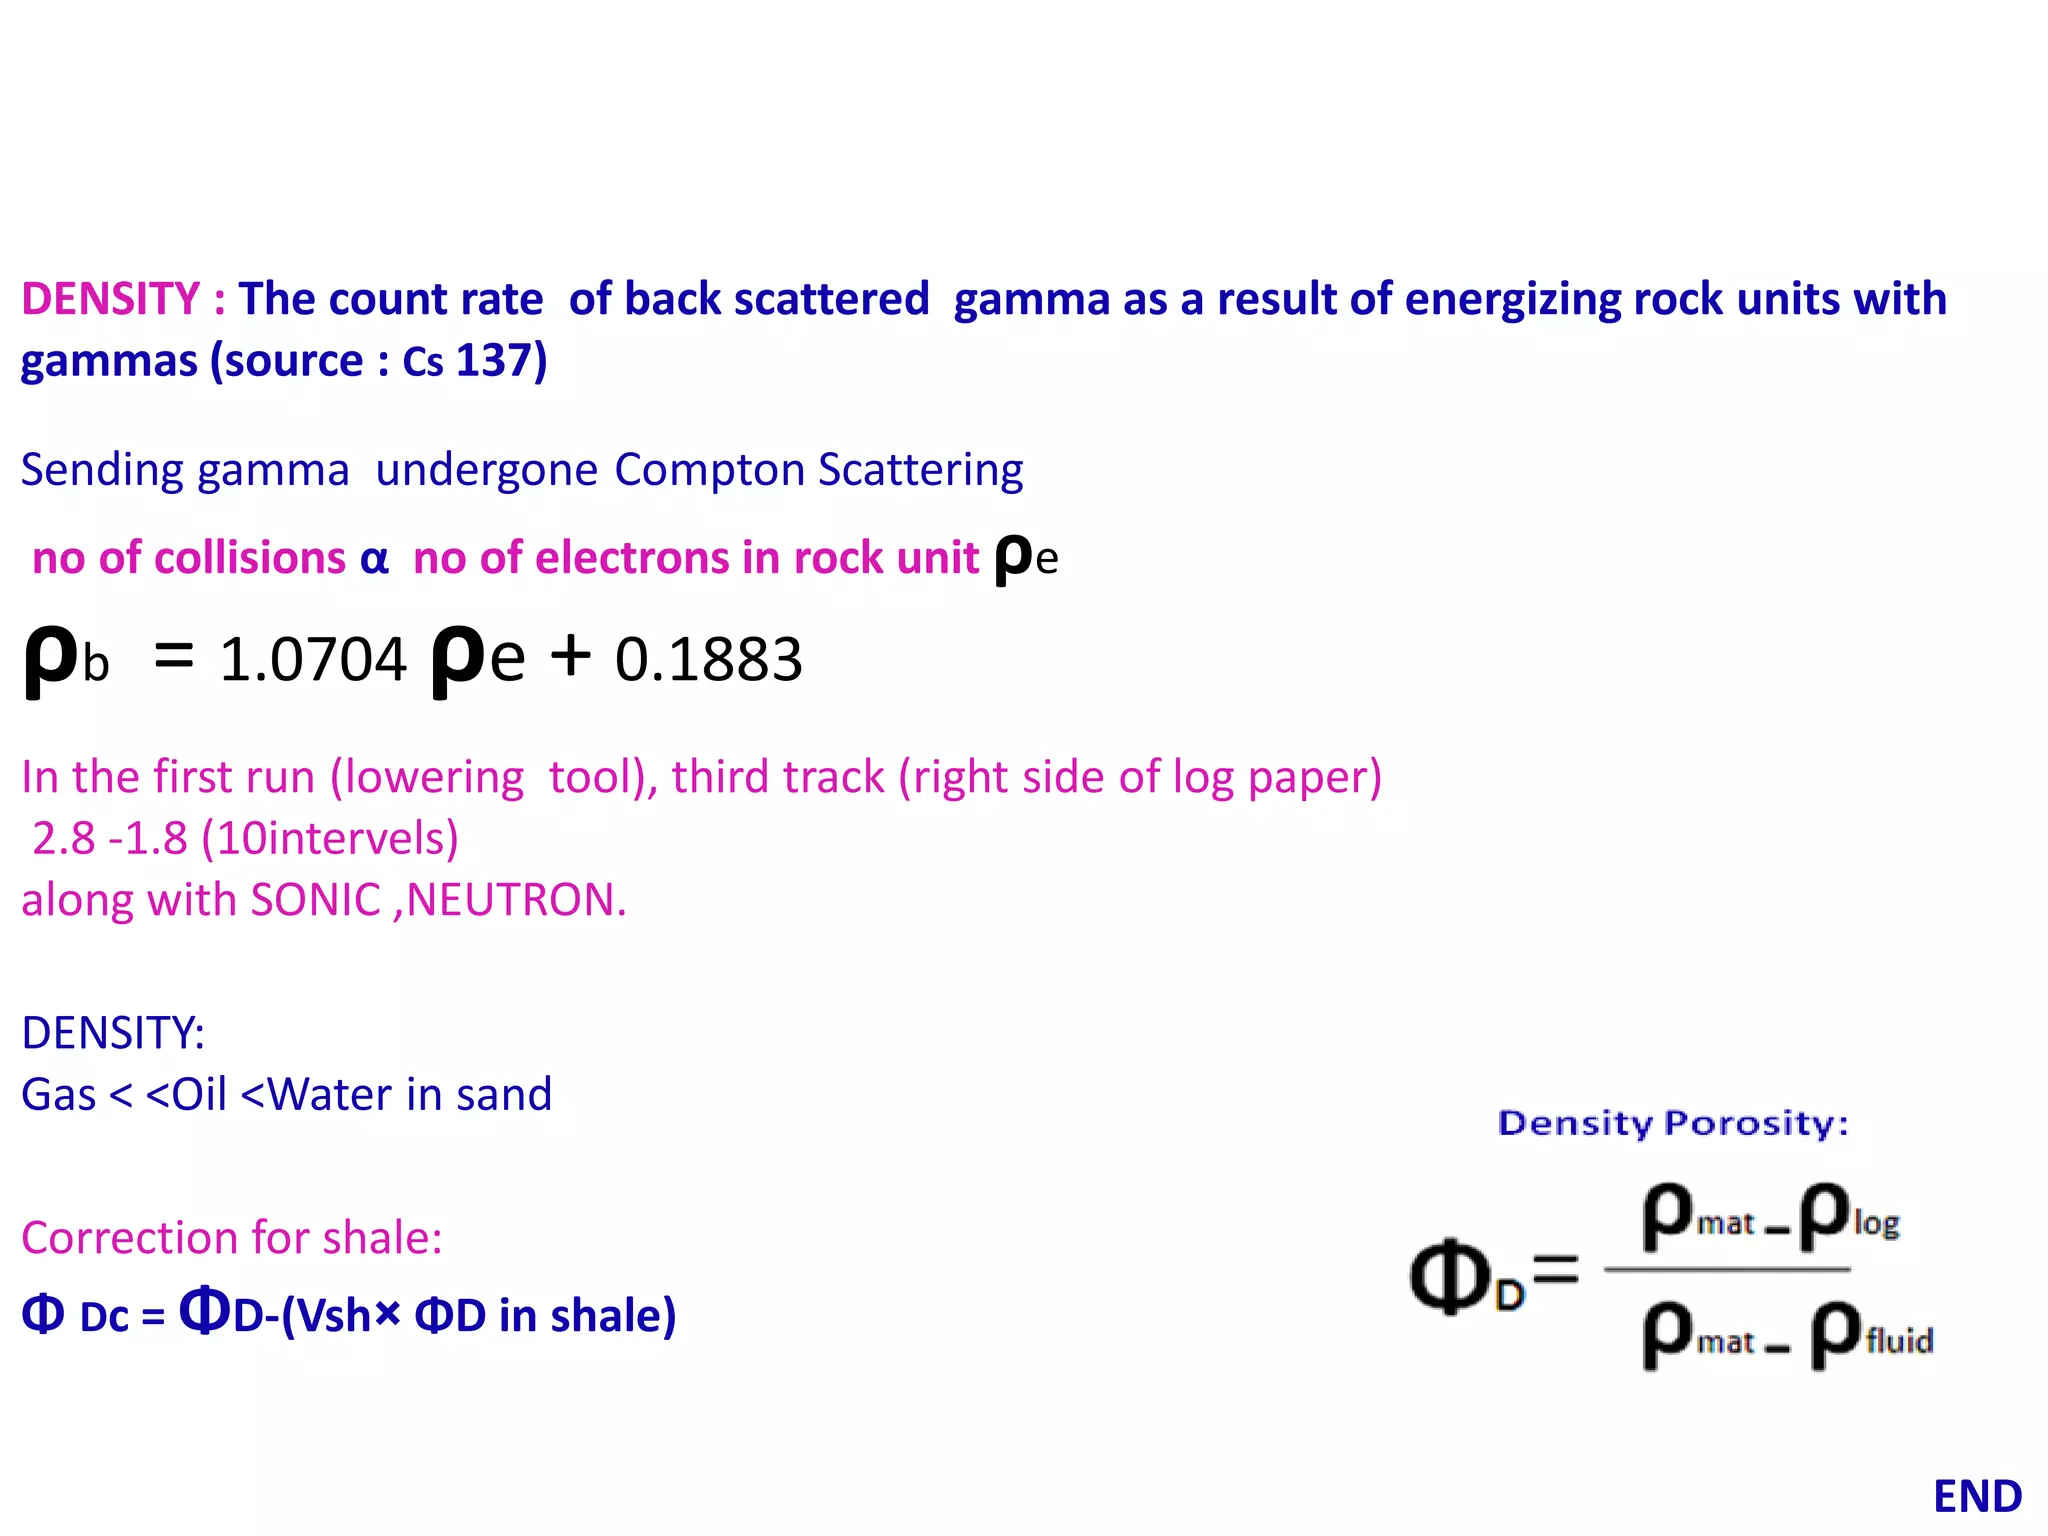
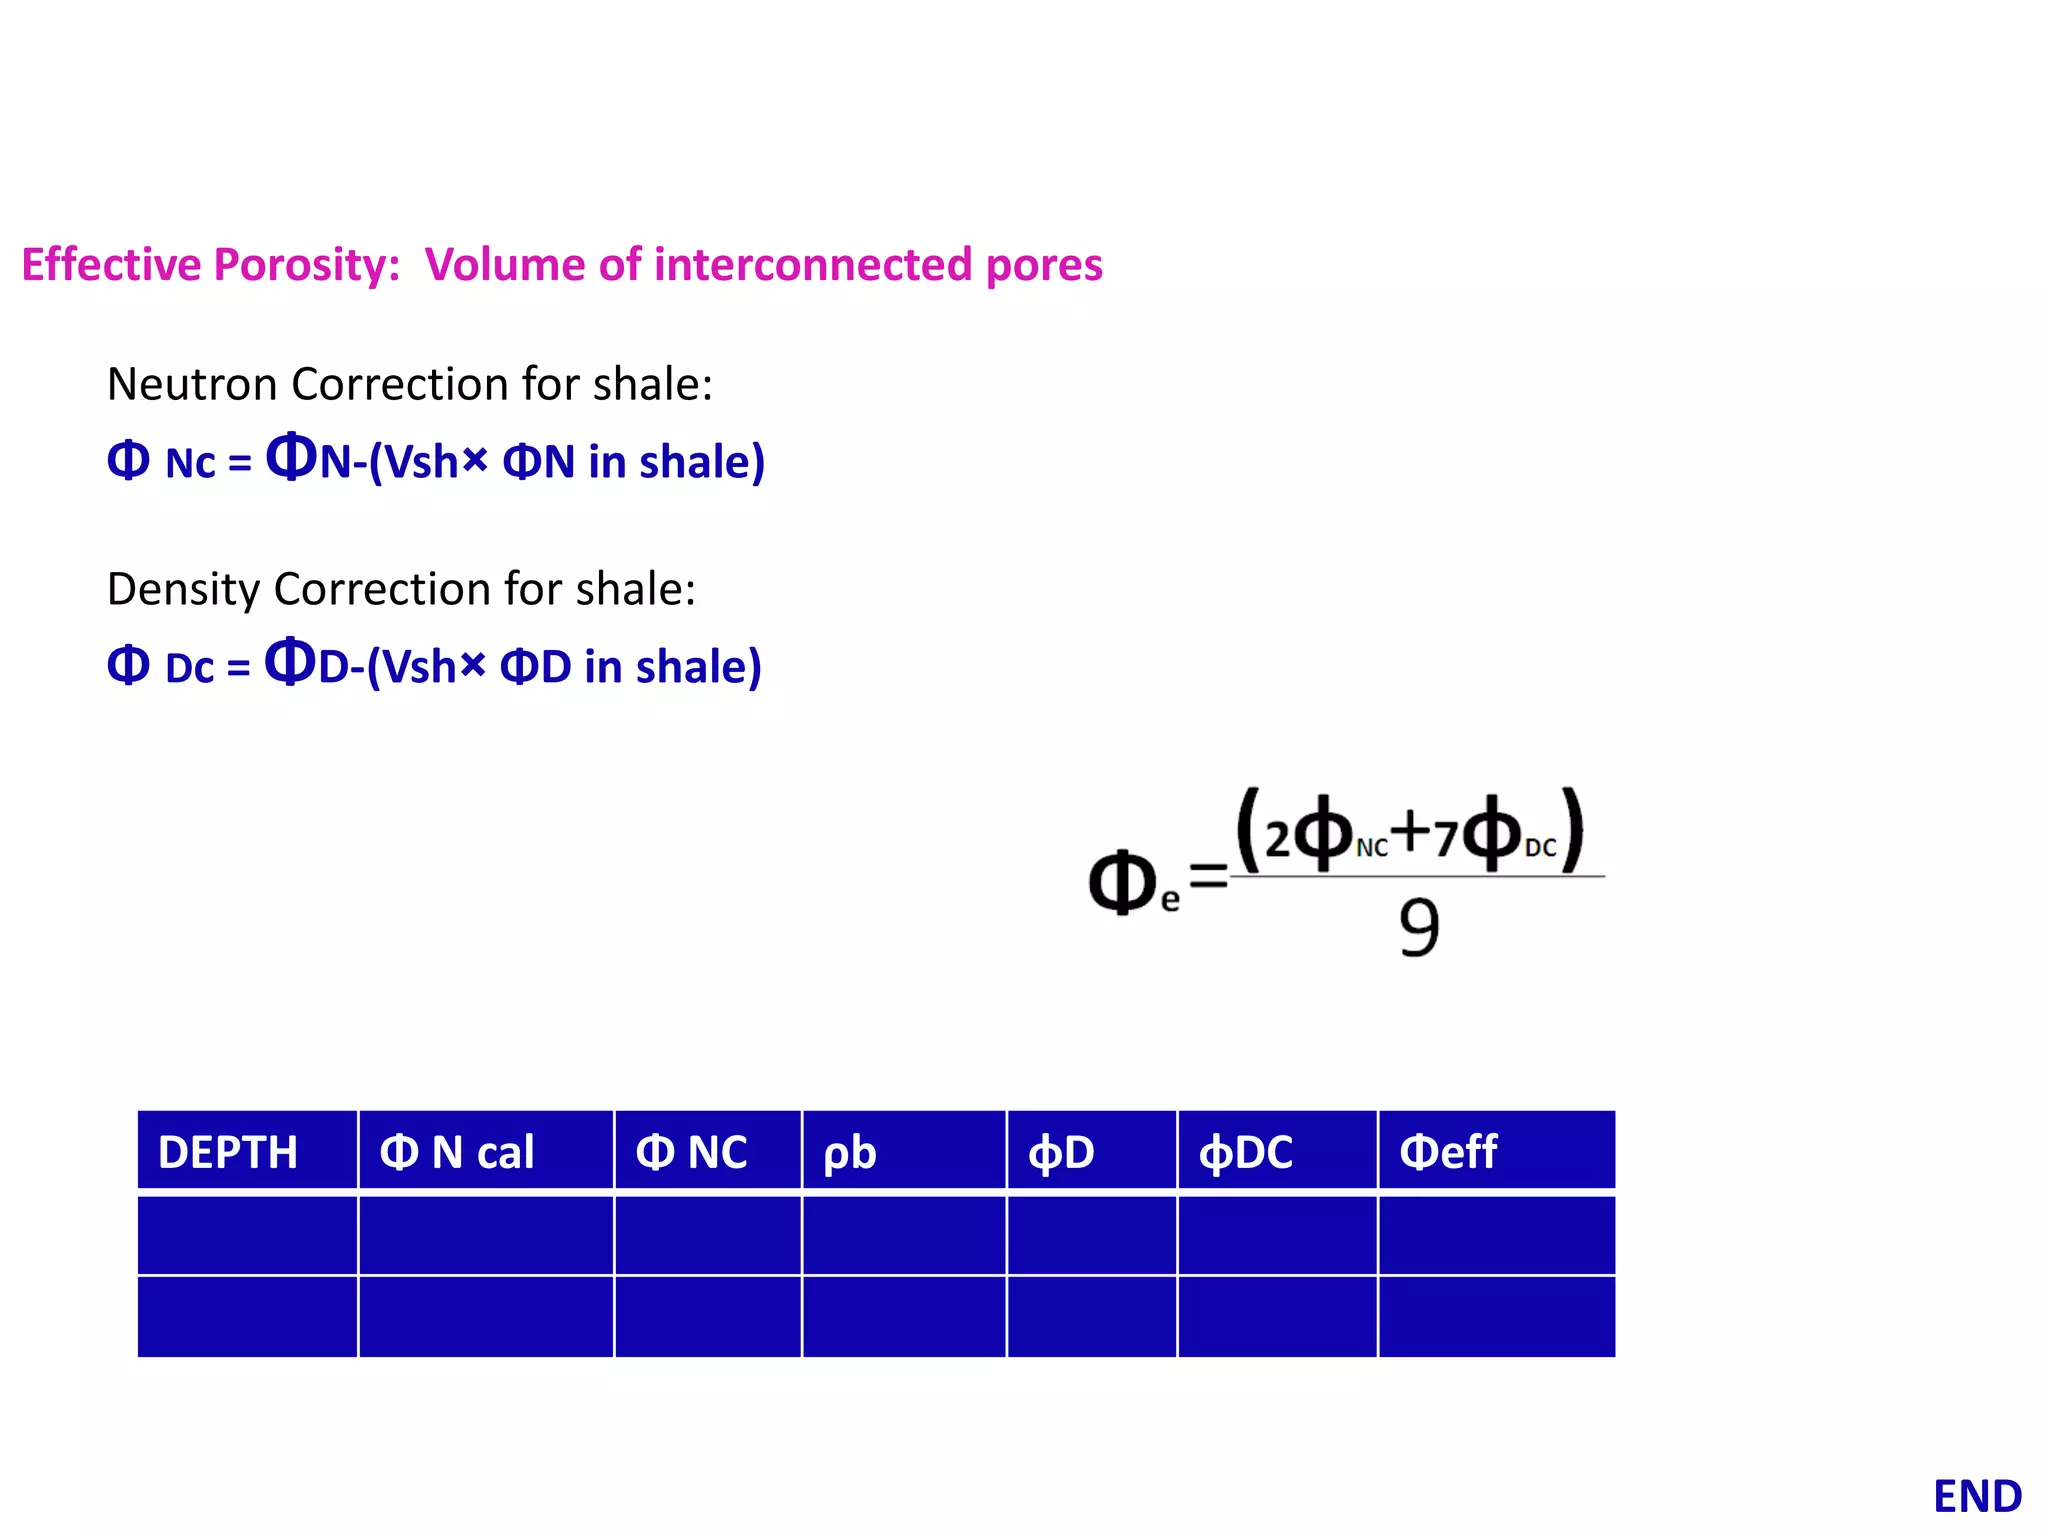
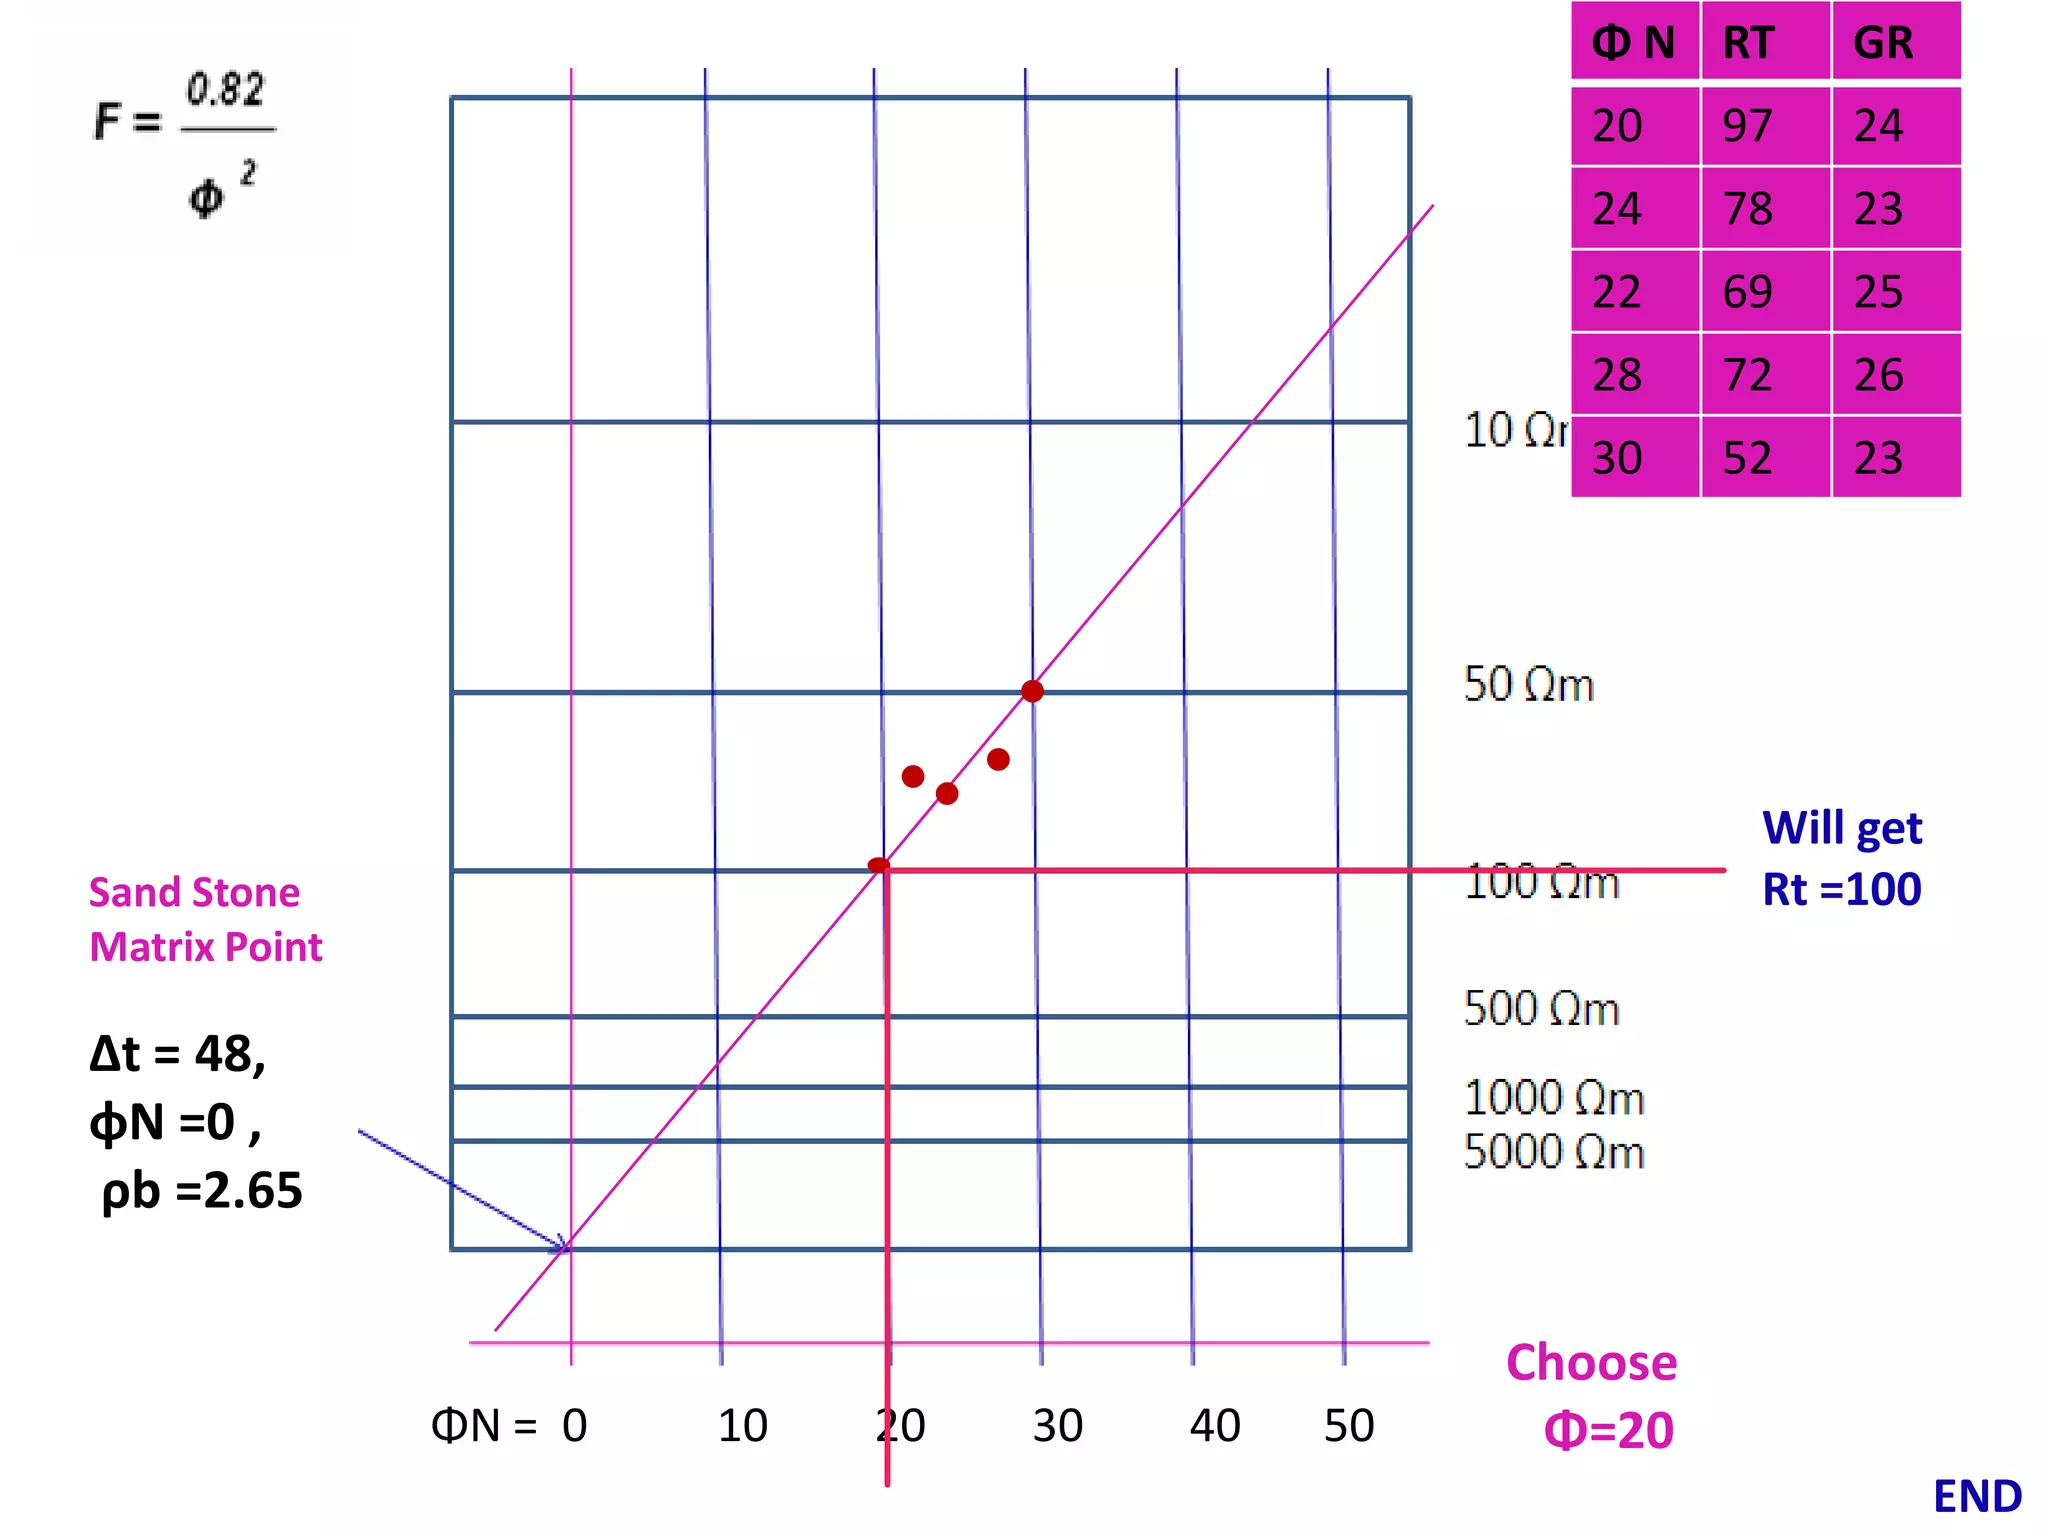
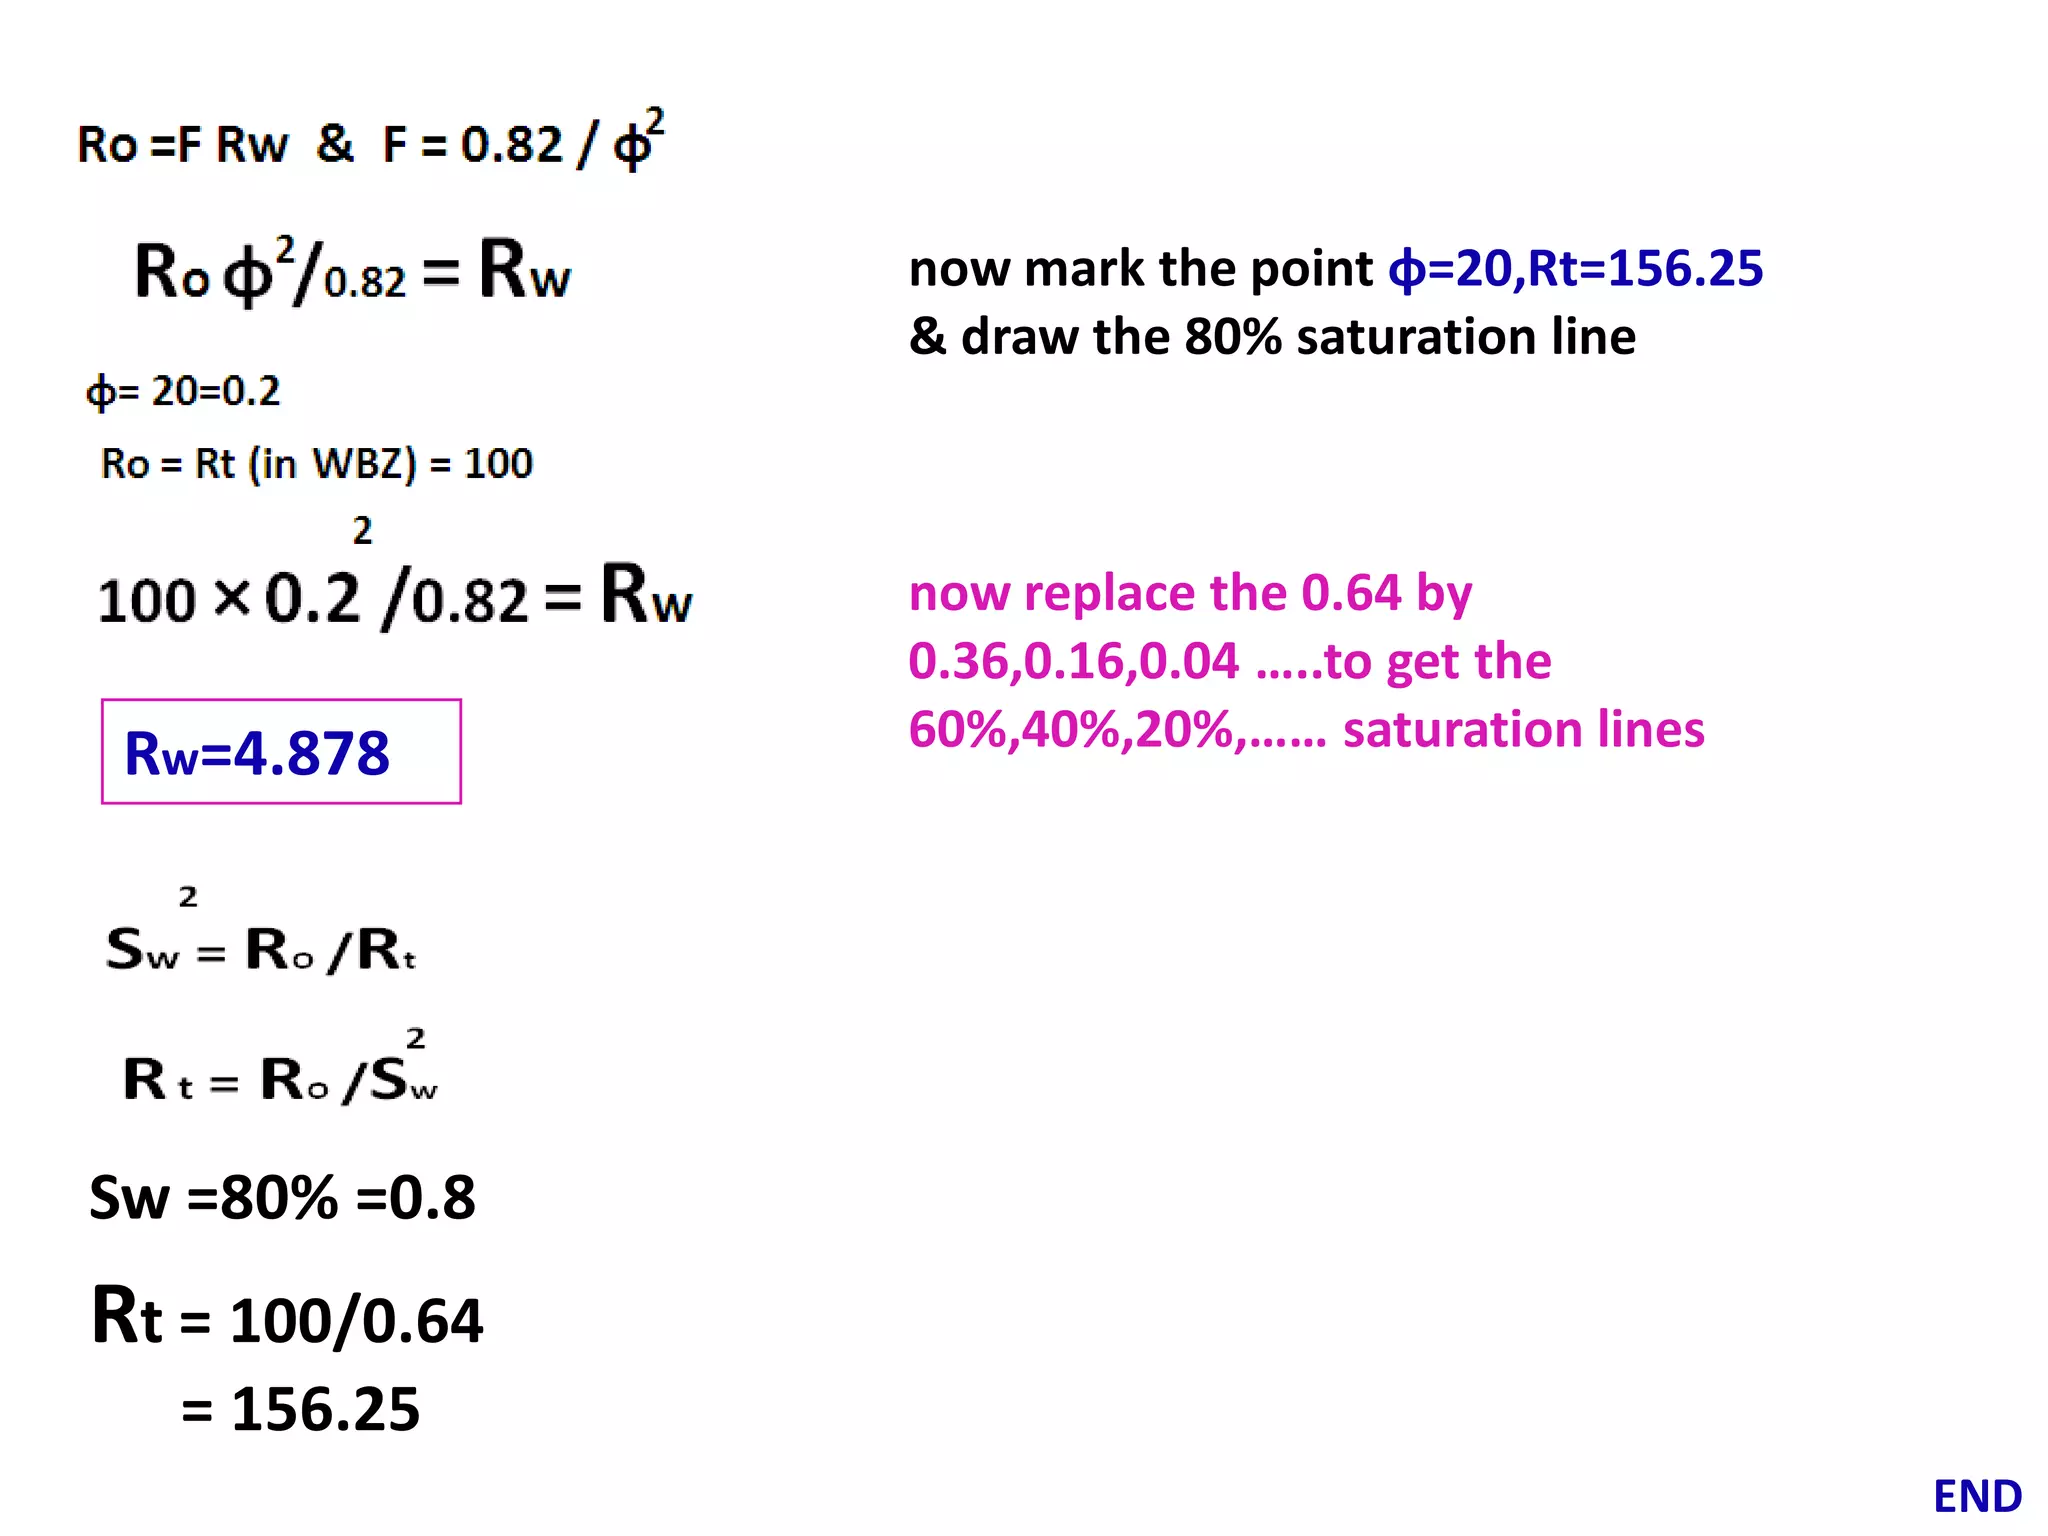
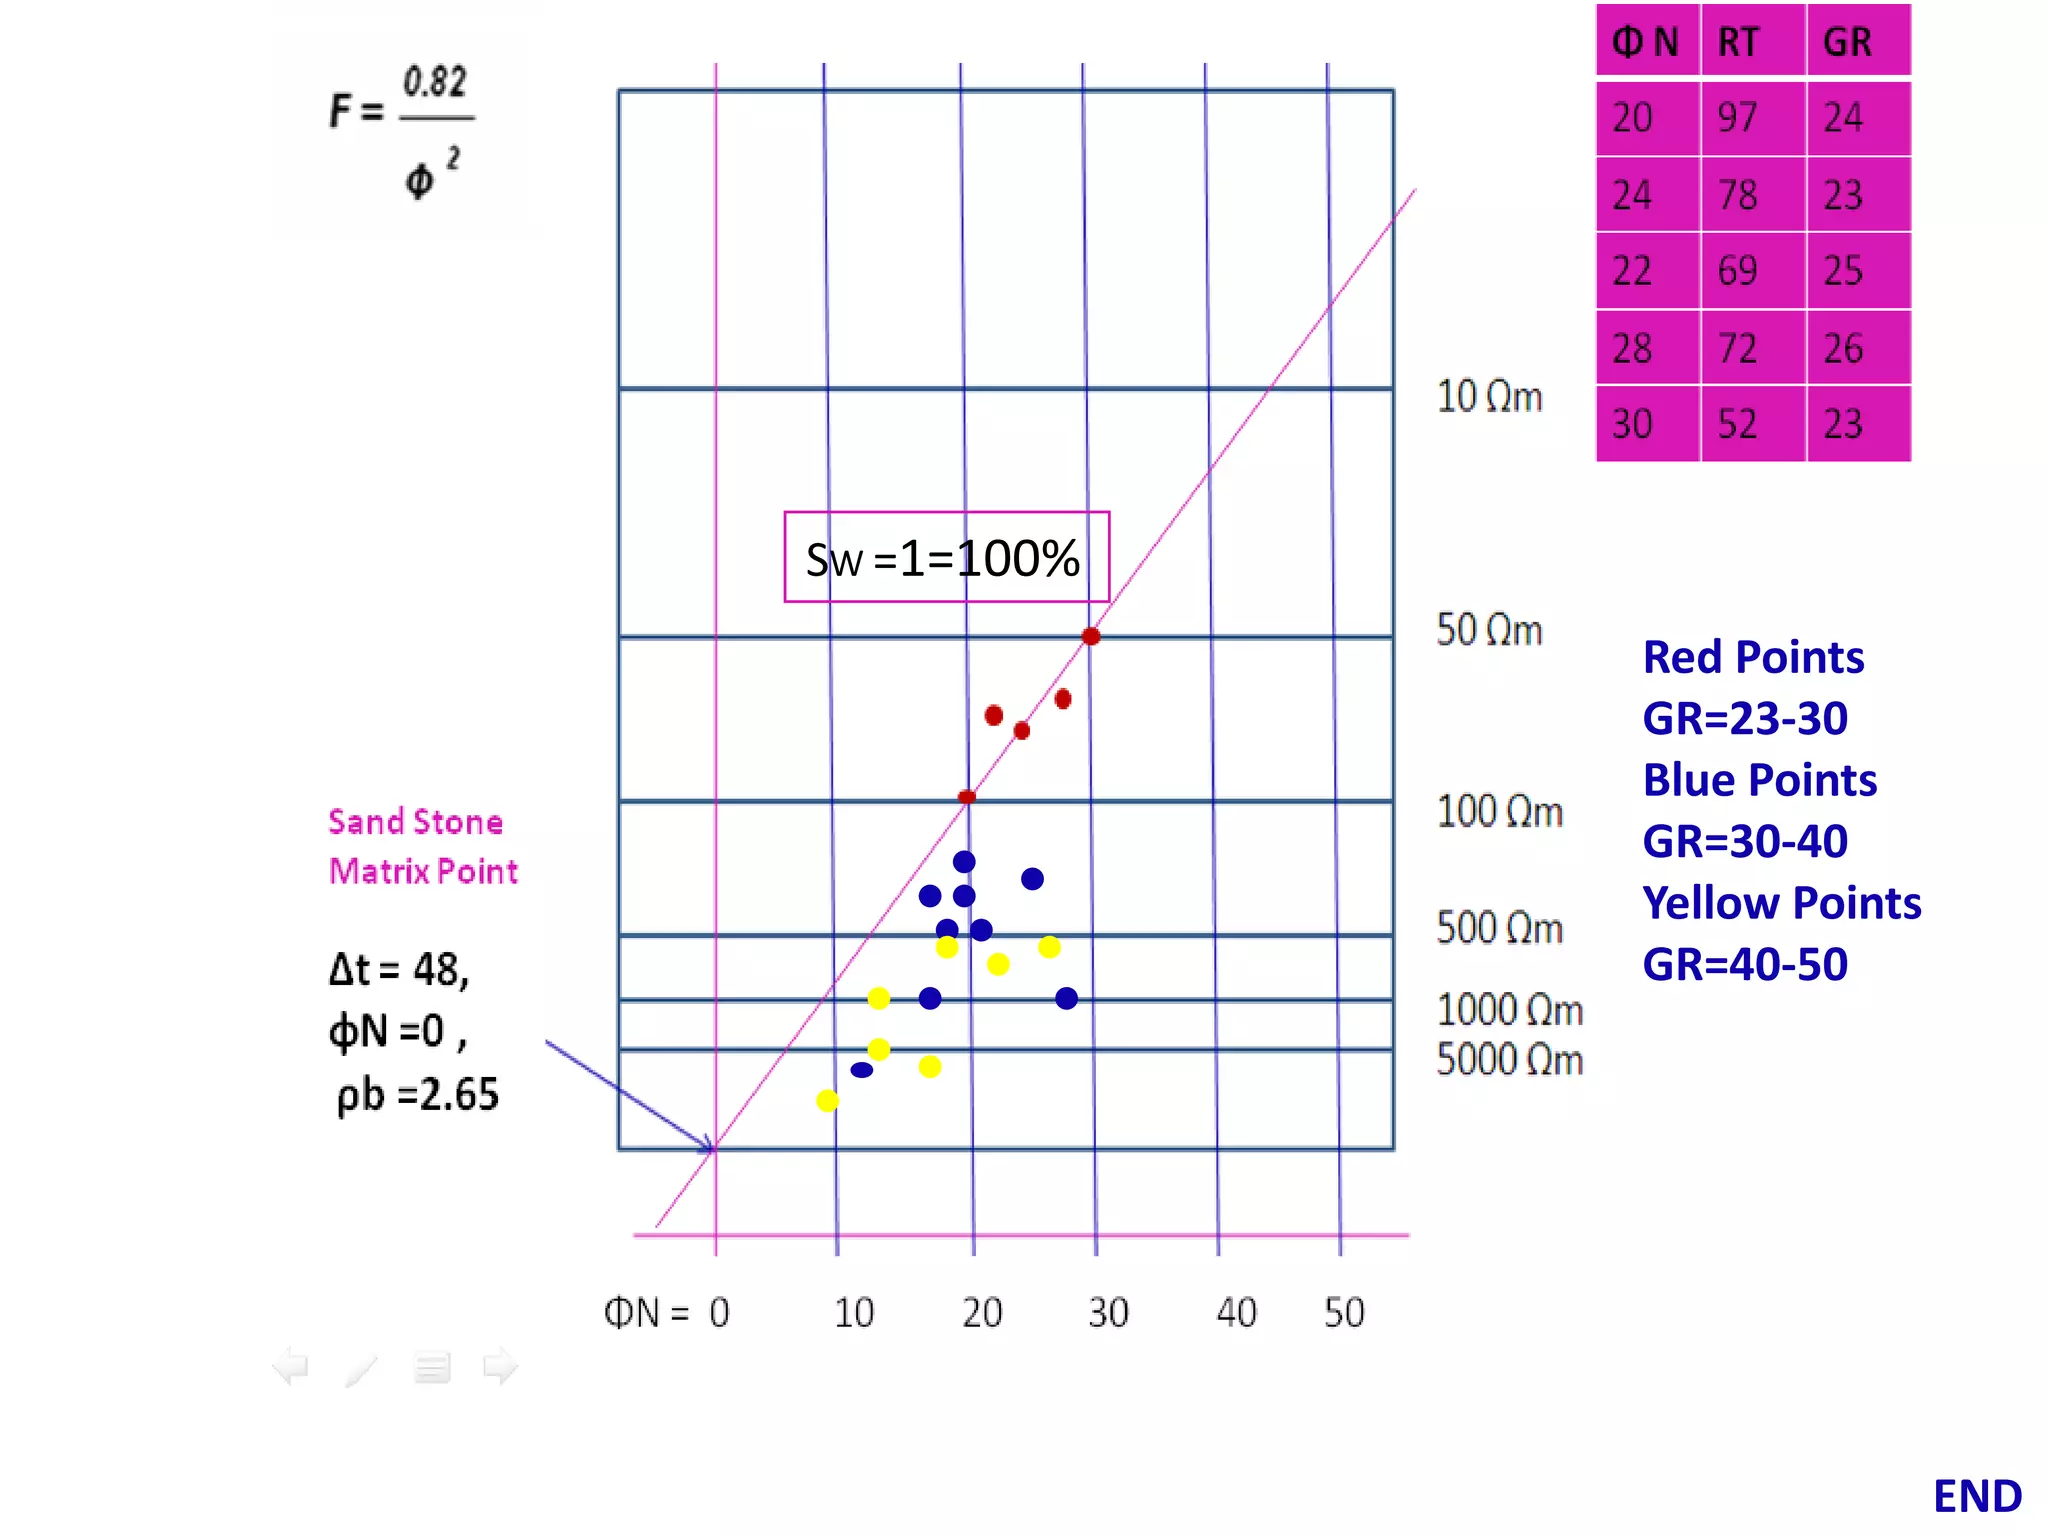
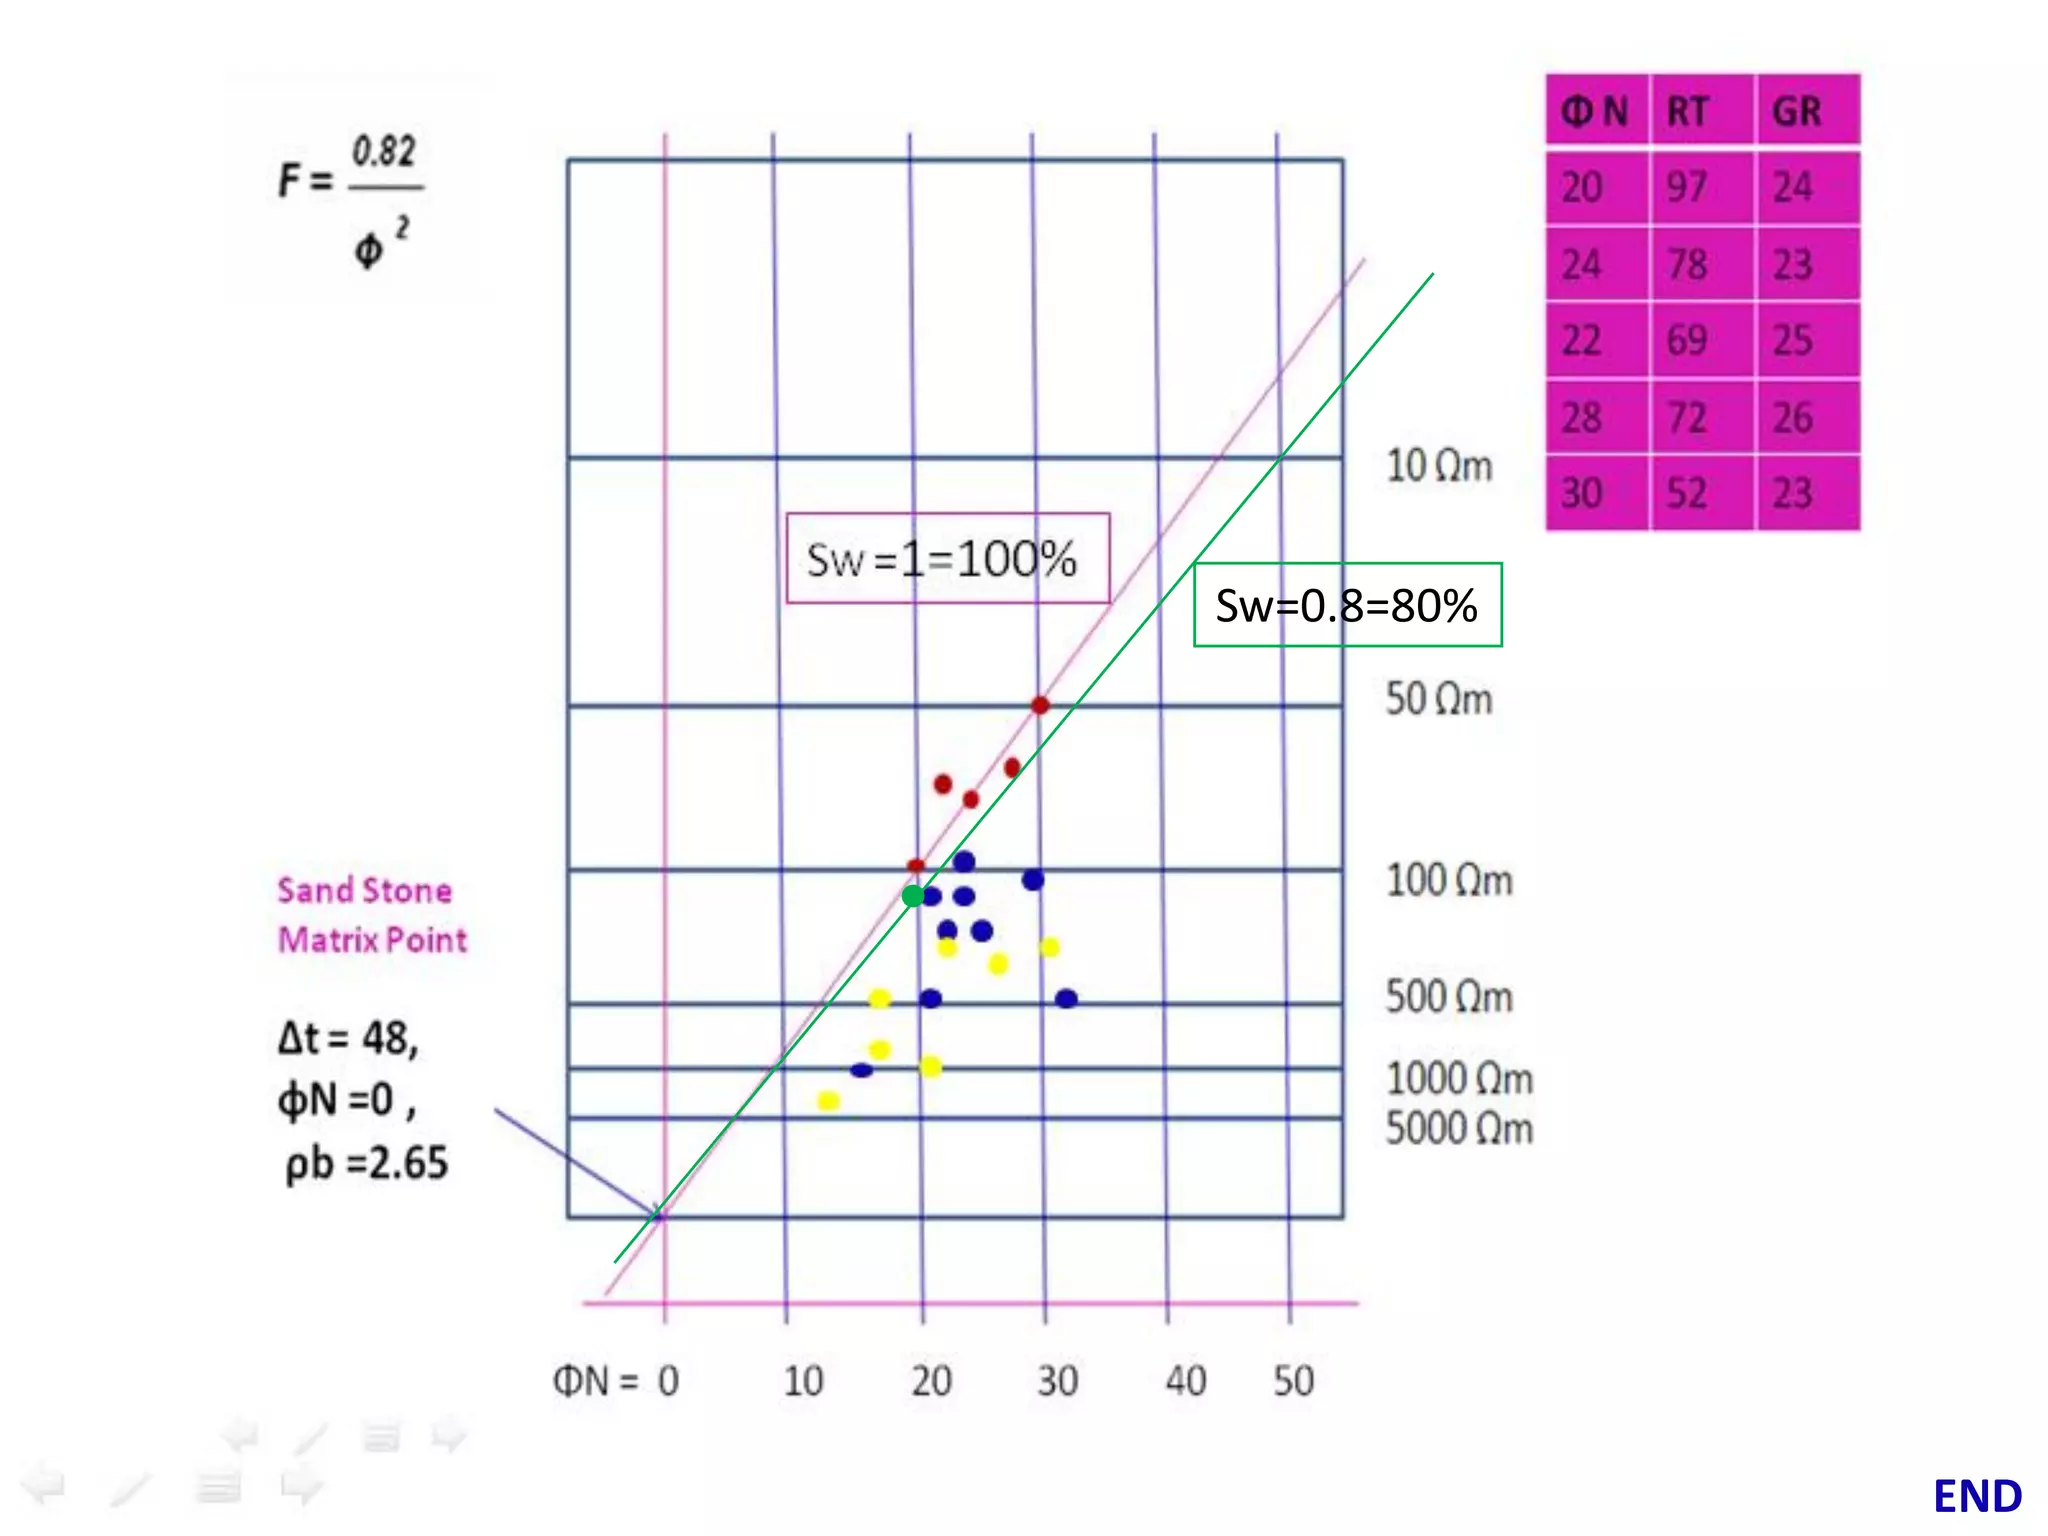
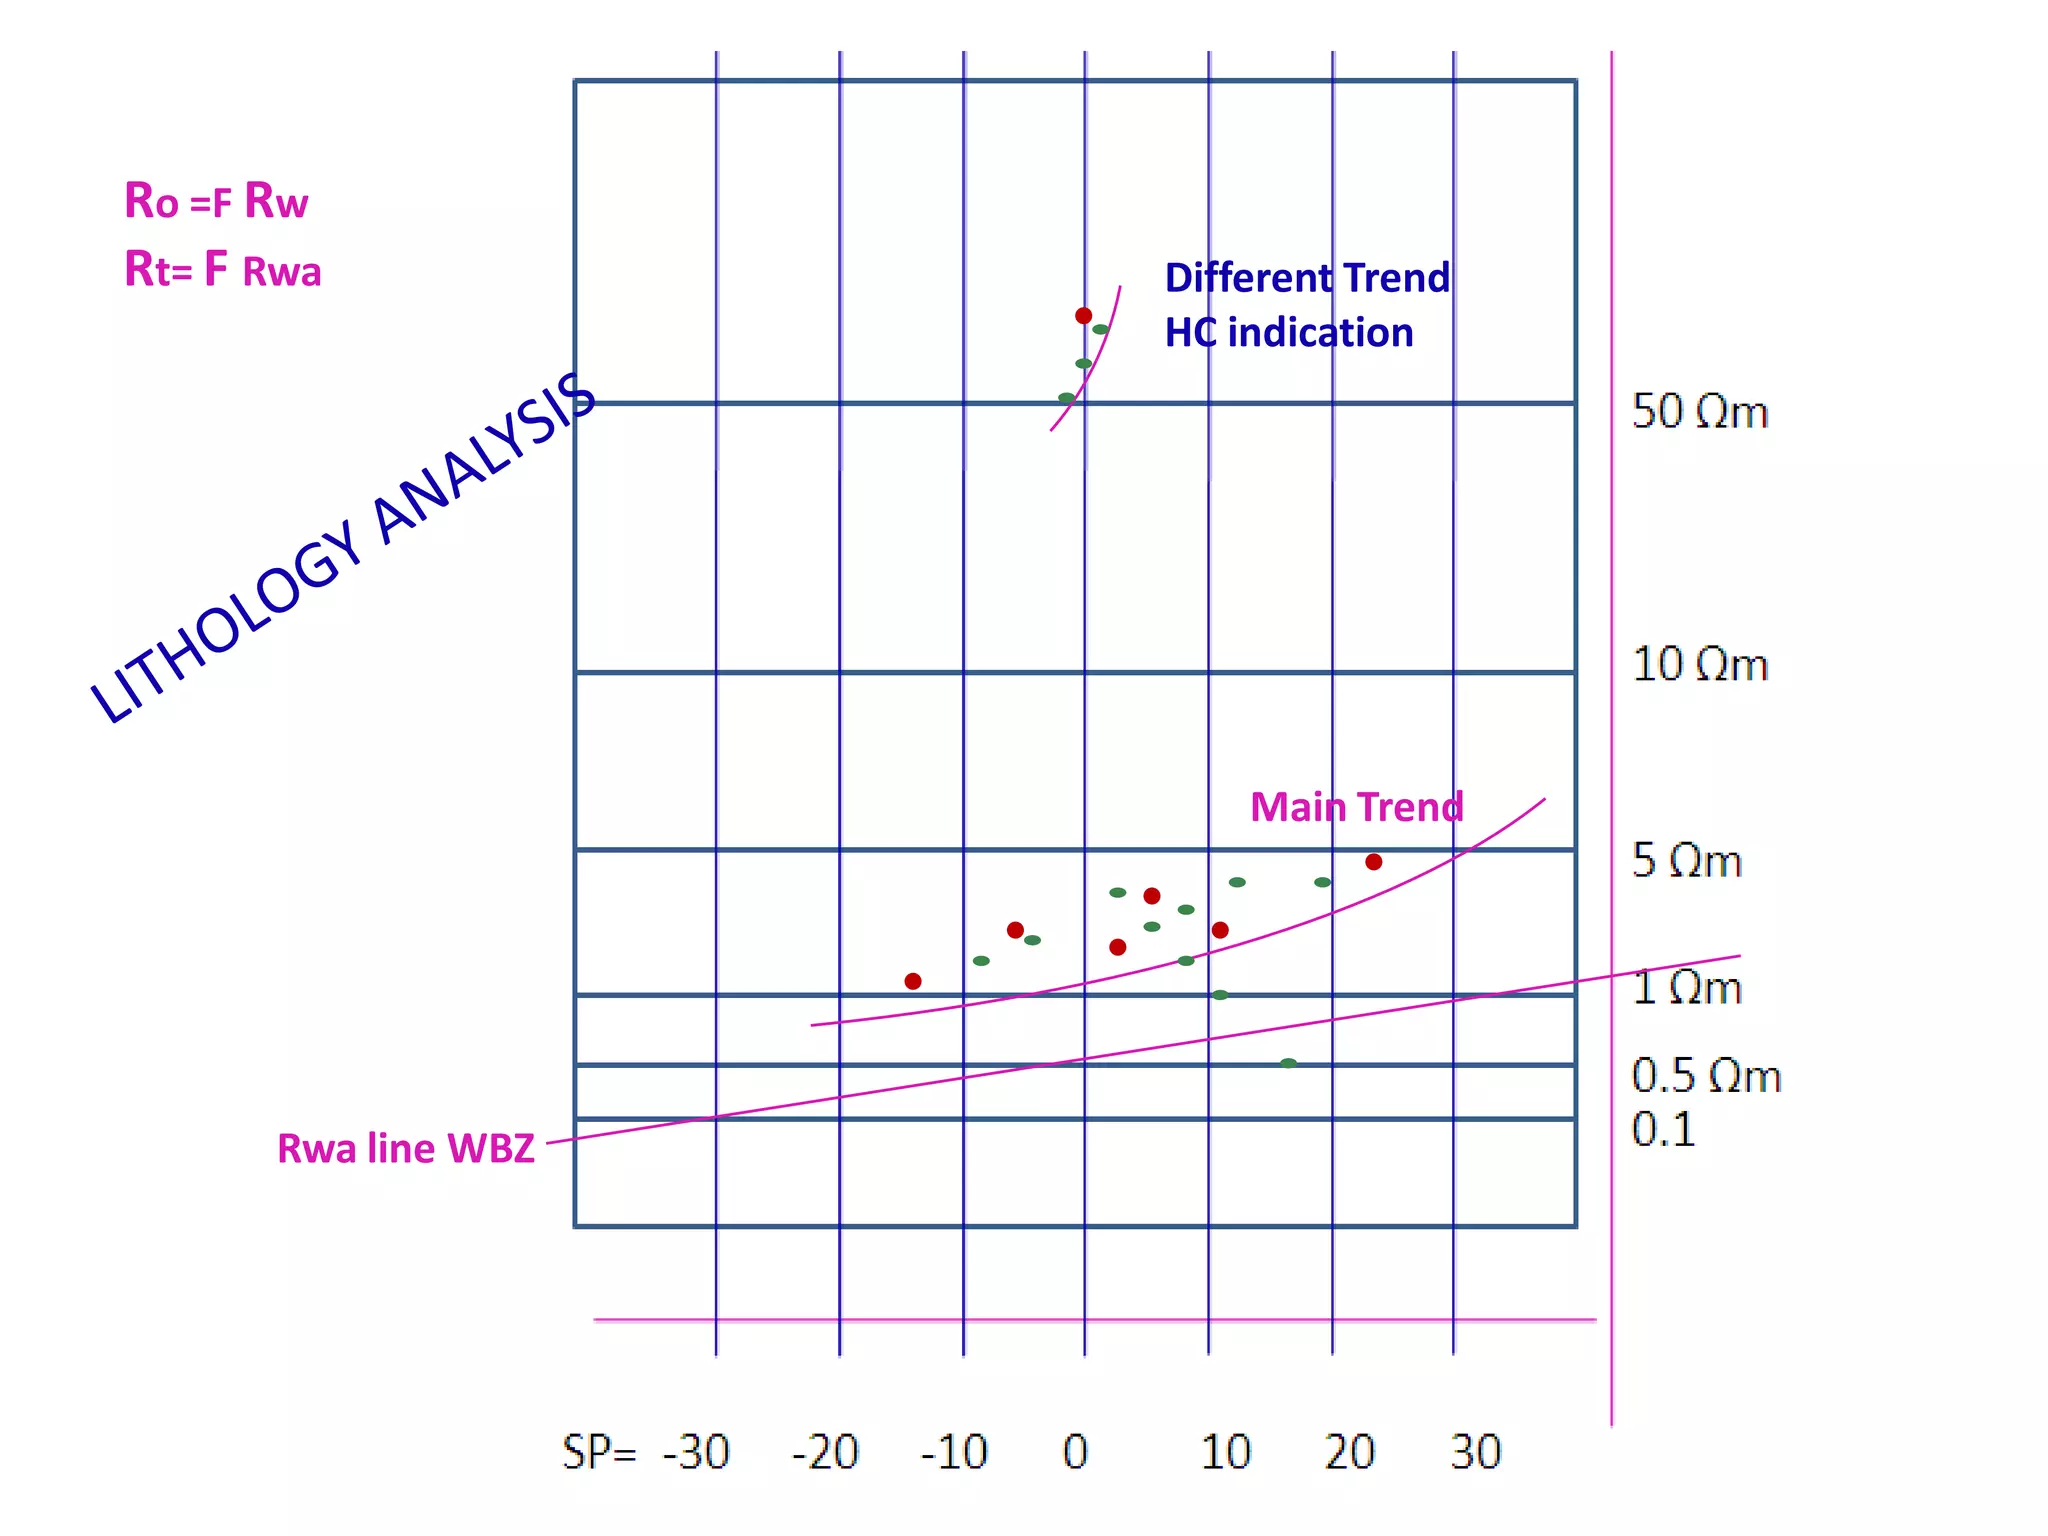
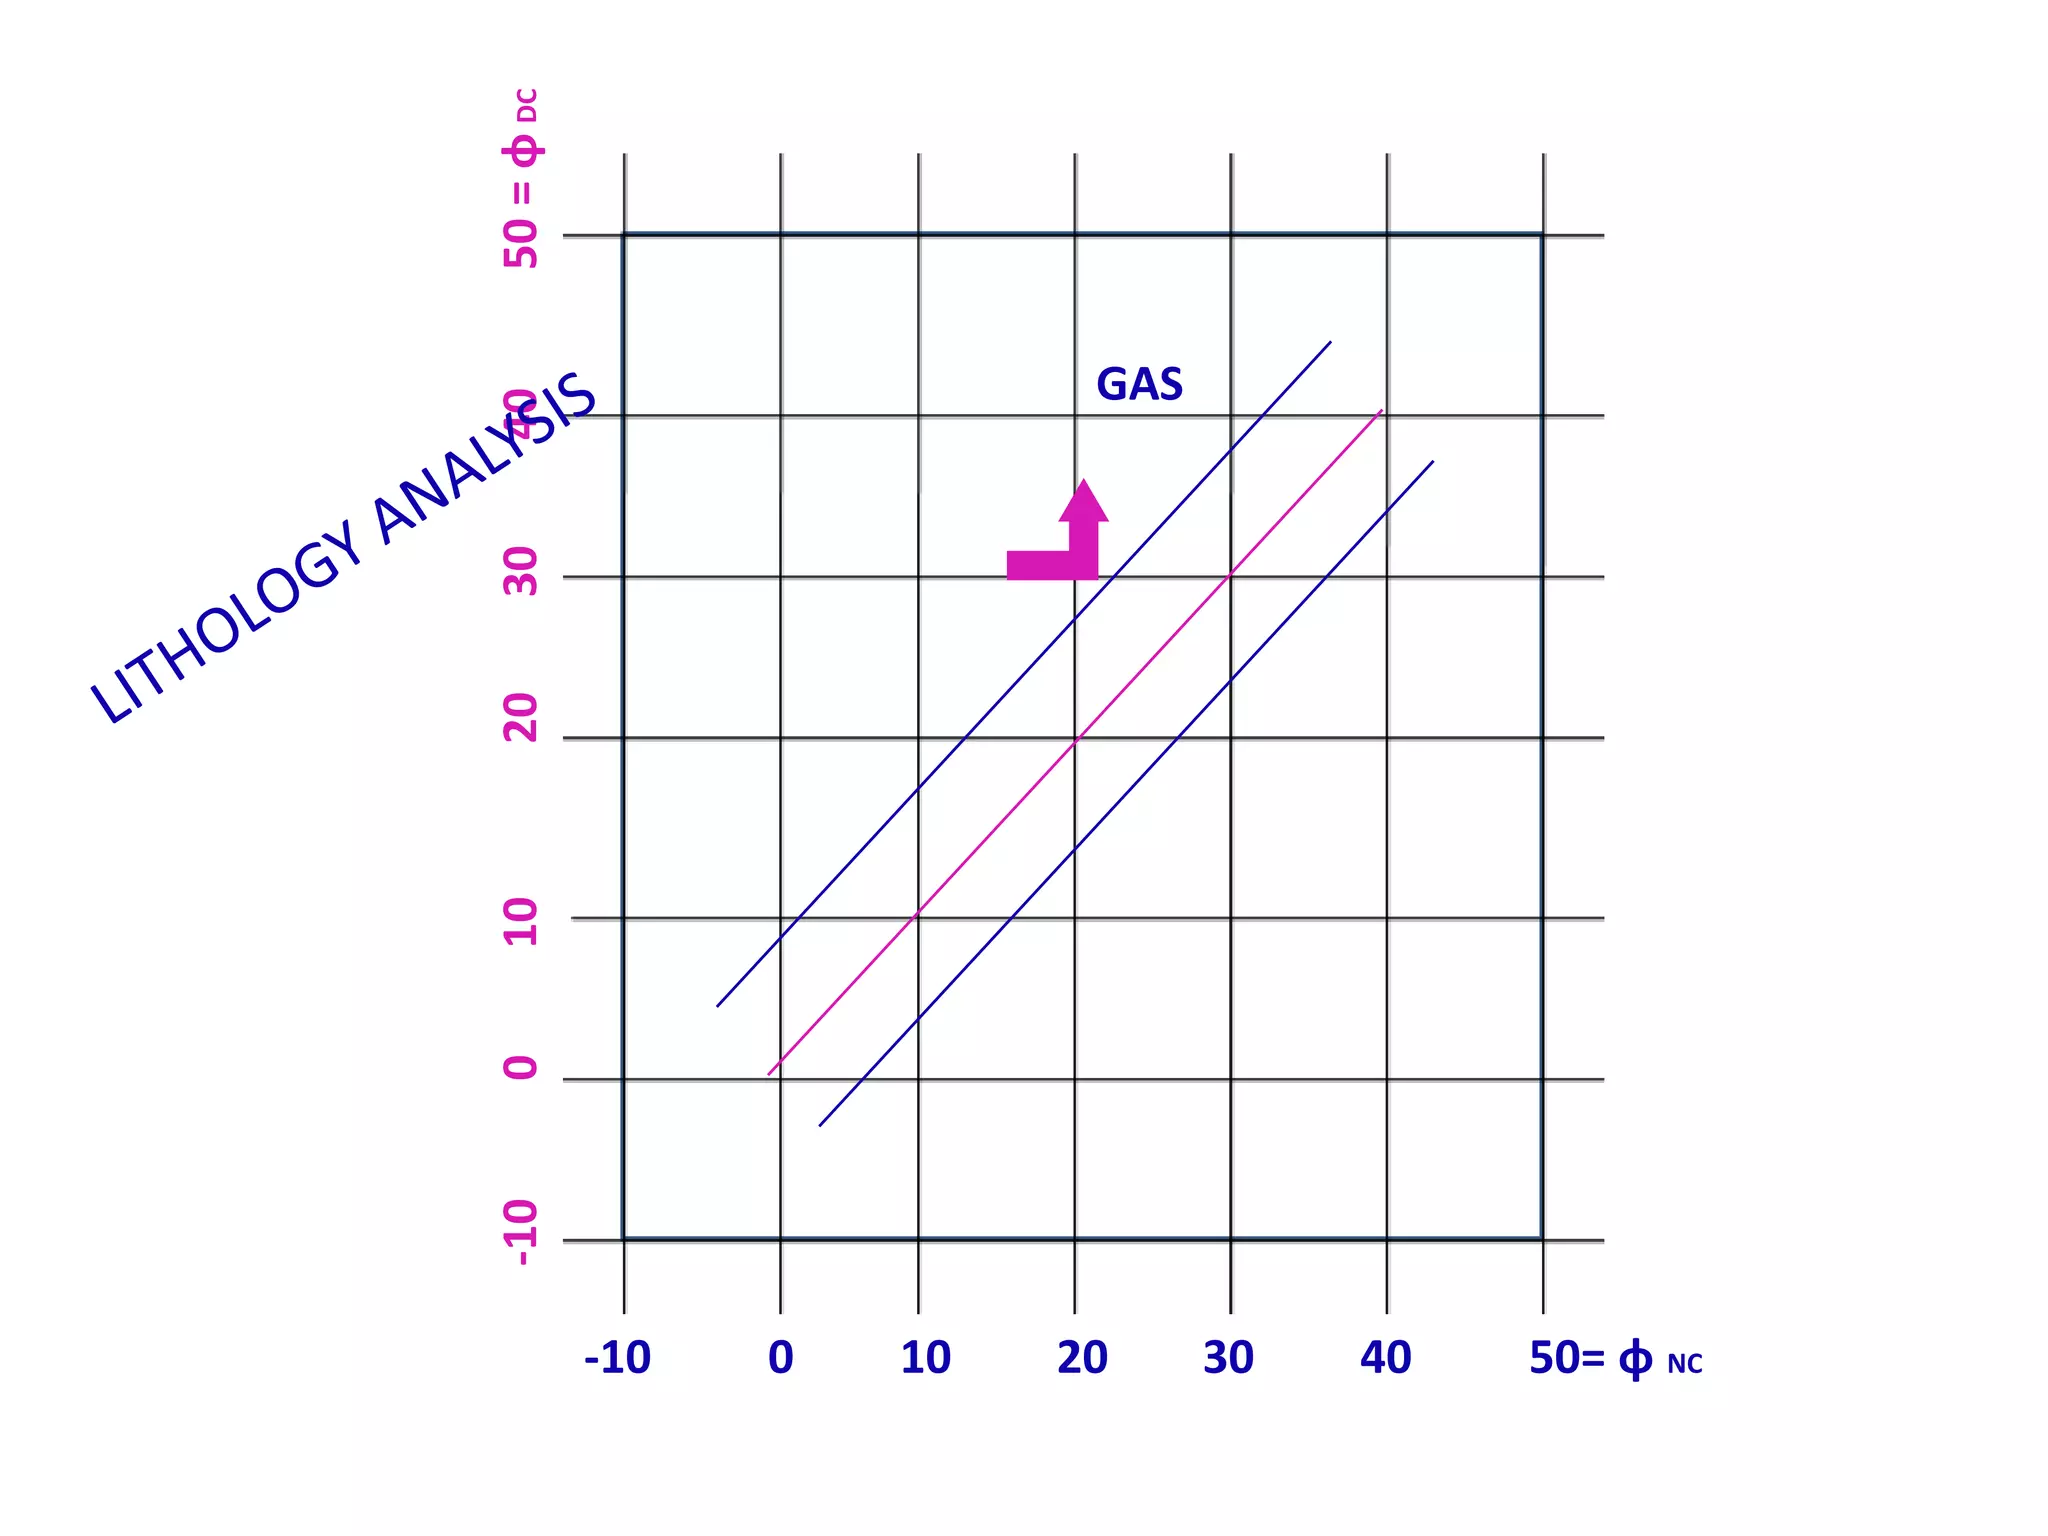
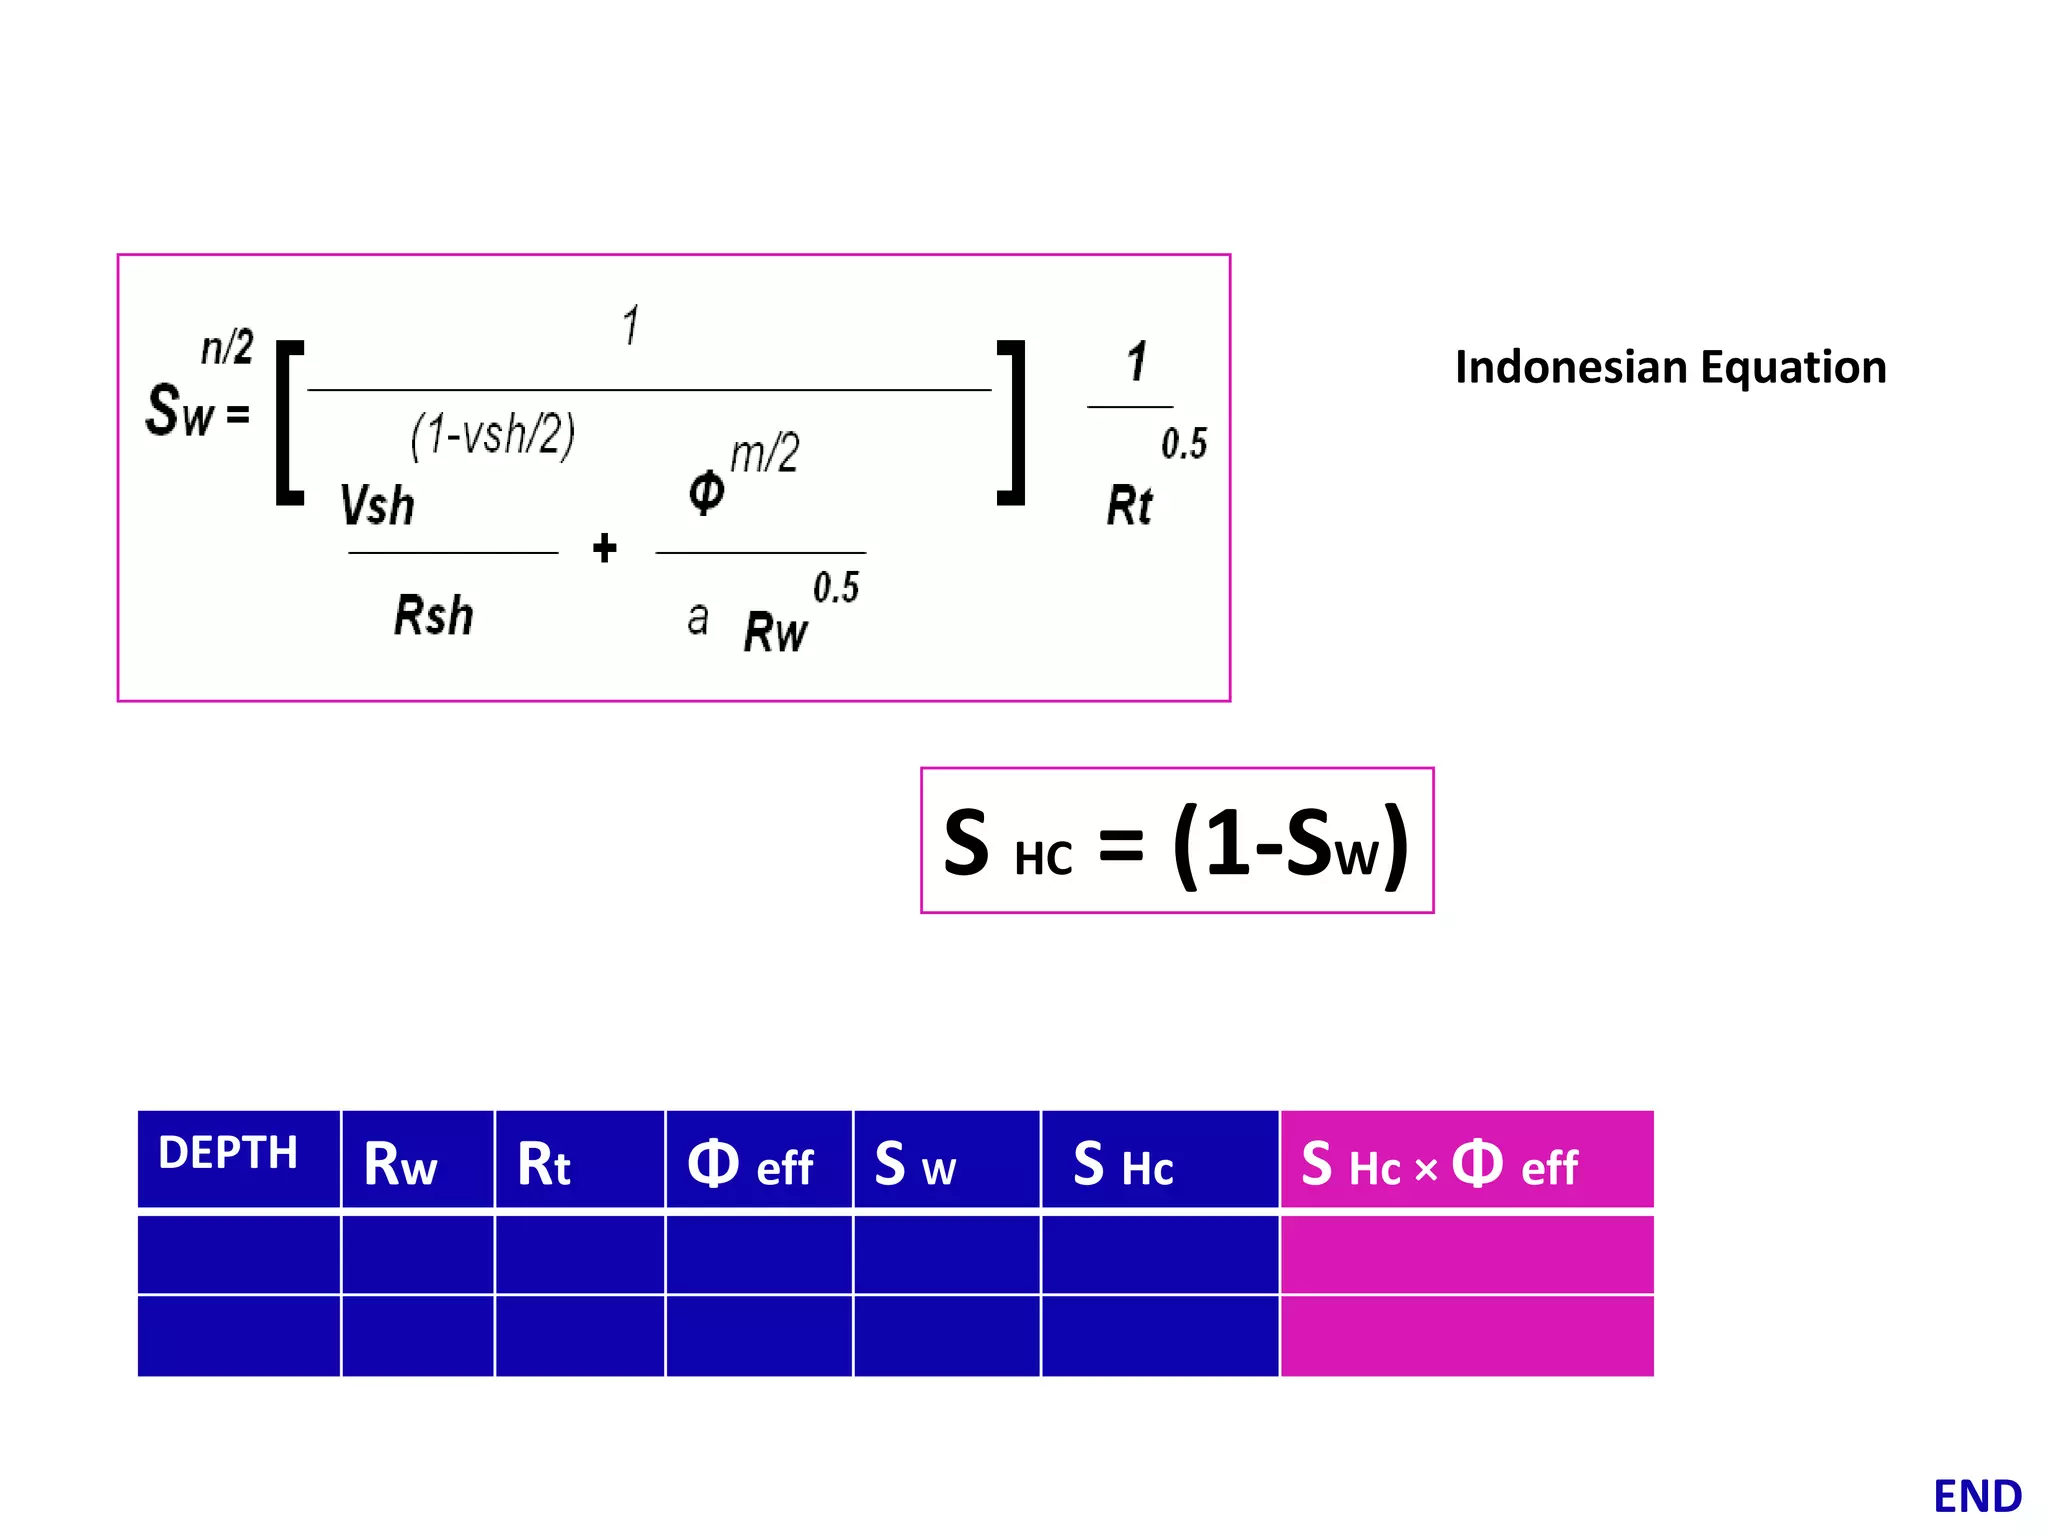
Well-Logging Exercise for Students

Dileep.P.Allavarapu
dpa.taeching@gmail.com /or
motherindia.energy@gmail.com
9703070878
EACH DISCIPLINE HAS ITS OWN IMPORTANCE & ROLE in E&P
RESERVOIR MODELING

OPEN HOLE LOGGING
(RES, POR, LITH LOGS)
-LWD/WL
MUD LOGGING
CORE ANALYSIS

DRILLING
&LOGGING

STATIC MODEL

INTERPRETATION MODEL
& UNCERTAINITY
CERTAINITY

CORE ANALYSIS
3D & VSP

GEOLOGY
& SEISMIC

CASED HOLE /PL LOGGING
(cement eval,flow rate ,fluid
Tests)
-WL
INJUCTION DATA
FLUID STUDIES

DYNAMIC MODEL

FLUID STUDIES
4D
THE ULTIMATE GOAL OF

conventional log INTERPRETATION

Calculation of

S

Hc

*

φe

in each reservoir rock unit
Preparation of a PARA LOG
Important Points
Sand Stones:
Log Analyst:
Composition (Sand Stone)
Framework of Quartz and Feldspar
Grains(Majority)/
Other Fragments (Non Majority)/
Cement (Quit Limited))

Processing Engineer:
Matrix (Sand Stone)

K-Na, Ca Al Si3 O8
Si O2
Shales: Frame work ,Matrix, Cement are Clay Minerals
( Kaolinite,Montmorilllonite,Illite)
Minute percentage of Non Clay Minerals.
90% Clay Minerals
K Feldspar derived Radio Active K rich clays

Rain water derived U,Th Br salts
K (12%),U Th (<500ppm)

Laminar ,Dispersed, Structural

Lime Stone: CaCO3 chemically precipitated calcium

Dolomite: Mg CO3(upto 12%)+CaCO3 chemically precipitated
Traps : Structural (tectonics), Stratigraphical (depositional environment), Combinational

What is Local Gravity High(LGH) ?

Anhydrate /Denser minerals in hydrothermal fluids closed to intrusive salt dome remains as top
.
Gravity is low over dome , central part have comparatively high gravity
In past ,North Brazilian sea have potassium rich salts.
STUDY THE LOG RECORD
(to take proper action in any stage of interpretation )

UNDERSTANDING LOG

HEADer- MAINfo- TAILer,…. DISPLAY INFORMATION .
TOOL SKETCH ,
CALIBRATION ,
PERFORMANCE & REMARKS ………

MARK THE INTERESTED ZONES
QUICK LOOK
INTERPRETATION

(to take the readings )
POROUS –PERMEABLE ZONES :
WATER /HC BEARING ,OTHER RESERVOIR ROCK UNITS

TAKE READINGS & LIST OUT THE INERPRETATION FORMULA
(to calculate the interpretation parameters)
GR , SP , CALIPER, RESTIVITY ,MICRO RESISTIVITY,
NEUTRON ,BULK DENSITY ,SONIC TRANSIT TIME

DETAILED
INTERPRETATION
GR FOR IGR
SP/RESISTIVITY &NEUTRON FOR Rw
RESISTIVITY FOR Rt
NEUTRON , BULK DENSITY ,SONIC TRANSIT TIME FOR φe
CALIPER, MICRO RESISTIVITY FOR k indication

FOR

S w, S hc, S movable , PAY
Archie's Equation : Archie's experiment concludes an empirical relationship
between resistivity of the water bearing formation and water, pore volume it
contain and also water saturation.
If Sw = 1 ,
means water-bearing formation
Resistivity of water
Resistivity of waterbearing formation

Formation factor
Volume of Shale: The percentage of shale present in the rock unit
Response in the
zone of interest

Shale

Clean formation

Indonesian Equation
GR: The record of count rate of Natural GAMMA as a result of emission from RADIO ACTIVE
MINERALS present in the ROCK UNITS
RADIO ACTIVE MINERALS are more in the CLAYS & SHALES
GR infer the LITHOLOGY whether rock unit is having CLAYS & SHALES or not
In the first /each run (lowering tool), first track (left side of log paper)
0-100 API (10intervels)
along with CALIPER,BIT SIZE , SP.
GR

around 30 -SAND
up to 50 -SAND SHALE
up to 80 -SHALE SAND
up to 100- SHALE
more than 100-CLAY

Volume of Shale

DEPTH GR

Vsh
SP: The record of voltage variation

as a result of electrolytic conduction due to salinity
variation between fluids present in the ROCK UNITS
electrolytic conduction is more across porous –permeable rock unit
SP infer the LITHOLOGY whether rock unit is having porous& permeable SAND or not
In the first /each run (lowering tool), first track (left side of log paper)
0-100 units (10intervels)
along with CALIPER,BIT SIZE ,GR.

SP +Ve : R mf <R w : Shale Base Line is in left side of Sand Deflection Line
SP in the same well either +Ve or –Ve :
crossover indicates the presence of HYDROCARBON
OR

K=61+0.133T°F

R we to R w
conversion chart

DEPTH

SSP

K

10 ˆ(SSP/K)

Rwe R w
BIT SIZE : size of the drill-bit used
CALIPER: size of the drilled hole
Grater than BIT SIZE : absence of permeable rock units / factures
Less than BIT SIZE : presence of permeable rock units /MUD CAKE
RESISTIVITY : Apparent resistivity of the formation
(can calculate true resistivity by using at least three apparent resistivity values )
Using Resistivity Tool: in saline muds , good contact between annulus electrode and BH wall.
Using Induction Tool : in non saline muds

In the first run (lowering tool), first track (middle of log paper)
0.2-2000 units (log scale)
Configuration :
App resistivity = (Geometrical factor × Observed voltage difference)/ Sending current
Characteristic charts used to calculate true resistivity from apparent resistivity
DLL MSFL Invasion
Correction charts

DLL MSFL LOG RECORD

(R t / R LLD )× R LLD = R t
DEPTH

LLD

LLS

MSFL

LLD/LLS

LLD/MSFL Rt/LLD

Rsh = Rt in shale
RO = Rt in WBZ
Rt
NEUTRON: The count rate of back scattered neutron/gamma as a result of energizing rock
units with neutrons (source: Am Be -16 curie)
Sending neutron lose total energy and collapse into the nuclei of HYDROGEN and release a
Gamma
Response α Hydrogen Index
In the first run (lowering tool), third track (right side of log paper)
0.54 - -0.06 (10intervels)
along with SONIC ,DENSITY.
NEUTRON :
Gas < Oil <Water in sand
Sand < Shale (bounded water)
Correction for shale:

Φ Nc = ΦN-(Vsh× ΦN in shale)

Neutron Porosity

Φ N = ΦN
corrected

calibration
Chemical Sources:
Neutron sources
o Am241-Be9 : emits neutrons with mean energy of 4.2 MeV.
oz Californium(Cf252) : emits neutrons with mean energy of 2.35 MeV.

Gamma sourceso Cesium(Cs137) produce a steady flux of gamma rays at 662 KeV

Electrical Generators:
This device produces 14 MeV neutrons by accelerating deuterium ions into a tritium target
(up to 125,000 V DC).
NEUTRON
SOURCE

ENERGY
LEAVING
SOURCE

NEUTRON ENERGY (e V)

106

104

102
10 eV

APPROX.
EPITHERMAL
ENERGY
REGION

1

.4 eV
AVERAGE
THERMAL
ENERGY .
025 EV

CAPTURE

01
1

10

TIM E ( µ s )

100
Φ N RT

GR

20

97

24

24

78

23

22

69

25

28

72

26

30

52

23

Will get
Rt =100

Sand Stone
Matrix Point

∆t = 48,
φN =0 ,
ρb =2.65

ΦN = 0

10

20

30

40

50

Choose
Φ=20
now mark the point φ=20,Rt=156.25
& draw the 80% saturation line

Rw=4.878

Sw =80% =0.8

Rt = 100/0.64
= 156.25

now replace the 0.64 by
0.36,0.16,0.04 …..to get the
60%,40%,20%,…… saturation lines
SW =1=100%
Red Points
GR=23-30
Blue Points
GR=30-40
Yellow Points
GR=40-50
Sw=0.8=80%
Ro =F Rw
Rt= F Rwa

Different Trend
HC indication

Main Trend

Rwa line WBZ
50 = φ DC
-10

0

10

20

30

40

GAS

-10

0

10

20

30

40

50= φ NC
DENSITY : The count rate of back scattered gamma as a result of energizing rock units with
gammas (source : Cs 137)
Sending gamma undergone Compton Scattering

no of collisions α no of electrons in rock unit ρe

ρb = 1.0704 ρe + 0.1883
In the first run (lowering tool), third track (right side of log paper)
2.8 -1.8 (10intervels)
along with SONIC ,NEUTRON.
DENSITY:
Gas < <Oil <Water in sand

Correction for shale:

Φ Dc = ΦD-(Vsh× ΦD in shale)
Effective Porosity: Volume of interconnected pores
Neutron Correction for shale:

Φ Nc = ΦN-(Vsh× ΦN in shale)
Density Correction for shale:

Φ Dc = ΦD-(Vsh× ΦD in shale)

DEPTH

Φ N cal

Φ NC

ρb

φD

φDC

Φeff
Indonesian Equation

S HC = (1-SW)
DEPTH

Rw

Rt

Φ eff S W

S Hc

S Hc × Φ eff
Here our goal need more data from
ROCK PHYSICS LABORATORY,
so it limited to

S hc × φ e
Conventional Open hole logs

Lithology logs
(SP,GR with CALIPER)

Porosity logs
(NEUTRON, DENSITY ,SONIC)

Resistivity logs
(RESISTIVITY,
MICRORESISTIVITY)

Lithology
(shale ,sand ,…)
Porous –permeable beds
(no of ,thickness)
Shale volume

Effective porosity
Type of fluid
Contacts
(GSC,GOC,OWC,GWC)
Uncompacted

Formation water
& True resistivity
Saturation
MHI
Permeability indication
GSC
GOC
WOC
General Information
Lithology

GR

Rt

φN

Sand Stone ( more
compacted & dry )

Less=25
Less clay
minerals

More=1000
SiO2 insulator / no
electrolytic
conduction

Less<10
More=2.6
No fluid / no H2 Closed grain
packing

Sand Stone ( less
compacted & wet)

Less=25
Less clay
minerals

Less<100
Saltwater
conductor /
electrolytic
conduction

More=10-30
Having H2

Moderate=2.1
(30% H2O=1
/70% SiO2
=2.6)

Having oil

Less=25
Less clay
minerals

Moderate >100-700
Oil insulator
(at least 5times of
R0 )

More=10-30
Having H2
(less than
water zone)

Moderate=1.9
(less than
water zone)

Having gas

Less=25
Less clay
minerals

More >700
Gas insulator
(at least 5times of

More=10-30
Having H2
(less than oil

Less =1.8

Having water

ρb
Lithology

GR

Rt

φN

ρb

Sand-Shale ( more
compacted & dry )

Less=30-50
More or
less clay
minerals

More<100
Dry clay insulator
,bounded water in
composition / not
much electrolytic
conduction

Less=20
No fluid /
bounded water
H2

More=2.5
Closed grain
packing
(30%shale
=2.3,70%sio2=2
.6)

Sand-Shale ( less
compacted & wet)

Less=30-50
More or
less clay
minerals

Less<50
Wet clay
conductor / more
electrolytic
conduction

More=20-40
Having H2

Moderate=2.2
(20% H2O=1
,50% SiO2 =2.6
30%Shale 1.82.6)

Having oil

Less=30-50
More or
less clay
minerals

Moderate >100-700
Oil insulator
(at least 5times of
R0 )

More=20-40
Having H2
(less than
water zone)

Moderate=1.8
(less than
water zone)

Having gas

Less=30-50
More or
less clay
minerals

More >700
Gas insulator
(at least 5times of
oil zone )

More=20-40
Having H2
(less than oil
zone)

Less =1.7

Having water
Lithology

GR

Rt

φN

ρb

Shale ( more
compacted & dry )

More =80-100
More clay
minerals (80%)

More<50
Dry clay insulator
/ not much
electrolytic
conduction

Less=30-40
No fluid /
bounded water
H2

More=2.3
Closed grain
packing

Shale ( less
compacted & wet)

More =80-100
More clay
minerals

Less<10
Wet clay
conductor
/ more electrolytic
conduction

More=40-50
Having H2

Moderate=1.9
(30%
H2O=1,70%
shale=2.3)
,

More >100(120)
More clay
minerals

More<50
Dry clay insulator
/Less<10
Wet clay
conductor

Less=30-40

More 2.4

Having water

Clay
Dileep.P.Allavarapu
dpa.taeching@gmail.com /or
motherindia.energy@gmail.com
9703070878
Contact any Institution
Dept. of Mathematics, MGR Junior College
Dept. of Chemistry, LAMP Degree College
Dept. of Geophysics , Andhra University
Logging Base ,ONGC –Rajahmundry Asset
Oil and Gas Deliveries, Infotech Enterprises Limited
Gravity Observatory , Gravity Group-NGRI
Seismological Observatory, Warna Canal Division-MERI
UV Physics Academy
Analog IAS Academy

THANK

U

science behind well logging_dileep p allavarapu

  • 1.
    Well-Logging Exercise forStudents Dileep.P.Allavarapu dpa.taeching@gmail.com /or motherindia.energy@gmail.com 9703070878
  • 2.
    EACH DISCIPLINE HASITS OWN IMPORTANCE & ROLE in E&P RESERVOIR MODELING OPEN HOLE LOGGING (RES, POR, LITH LOGS) -LWD/WL MUD LOGGING CORE ANALYSIS DRILLING &LOGGING STATIC MODEL INTERPRETATION MODEL & UNCERTAINITY CERTAINITY CORE ANALYSIS 3D & VSP GEOLOGY & SEISMIC CASED HOLE /PL LOGGING (cement eval,flow rate ,fluid Tests) -WL INJUCTION DATA FLUID STUDIES DYNAMIC MODEL FLUID STUDIES 4D
  • 3.
    THE ULTIMATE GOALOF conventional log INTERPRETATION Calculation of S Hc * φe in each reservoir rock unit Preparation of a PARA LOG
  • 4.
  • 5.
    Sand Stones: Log Analyst: Composition(Sand Stone) Framework of Quartz and Feldspar Grains(Majority)/ Other Fragments (Non Majority)/ Cement (Quit Limited)) Processing Engineer: Matrix (Sand Stone) K-Na, Ca Al Si3 O8 Si O2
  • 6.
    Shales: Frame work,Matrix, Cement are Clay Minerals ( Kaolinite,Montmorilllonite,Illite) Minute percentage of Non Clay Minerals. 90% Clay Minerals K Feldspar derived Radio Active K rich clays Rain water derived U,Th Br salts K (12%),U Th (<500ppm) Laminar ,Dispersed, Structural Lime Stone: CaCO3 chemically precipitated calcium Dolomite: Mg CO3(upto 12%)+CaCO3 chemically precipitated
  • 7.
    Traps : Structural(tectonics), Stratigraphical (depositional environment), Combinational What is Local Gravity High(LGH) ? Anhydrate /Denser minerals in hydrothermal fluids closed to intrusive salt dome remains as top . Gravity is low over dome , central part have comparatively high gravity In past ,North Brazilian sea have potassium rich salts.
  • 8.
    STUDY THE LOGRECORD (to take proper action in any stage of interpretation ) UNDERSTANDING LOG HEADer- MAINfo- TAILer,…. DISPLAY INFORMATION . TOOL SKETCH , CALIBRATION , PERFORMANCE & REMARKS ……… MARK THE INTERESTED ZONES QUICK LOOK INTERPRETATION (to take the readings ) POROUS –PERMEABLE ZONES : WATER /HC BEARING ,OTHER RESERVOIR ROCK UNITS TAKE READINGS & LIST OUT THE INERPRETATION FORMULA (to calculate the interpretation parameters) GR , SP , CALIPER, RESTIVITY ,MICRO RESISTIVITY, NEUTRON ,BULK DENSITY ,SONIC TRANSIT TIME DETAILED INTERPRETATION
  • 9.
    GR FOR IGR SP/RESISTIVITY&NEUTRON FOR Rw RESISTIVITY FOR Rt NEUTRON , BULK DENSITY ,SONIC TRANSIT TIME FOR φe CALIPER, MICRO RESISTIVITY FOR k indication FOR S w, S hc, S movable , PAY
  • 10.
    Archie's Equation :Archie's experiment concludes an empirical relationship between resistivity of the water bearing formation and water, pore volume it contain and also water saturation.
  • 11.
    If Sw =1 , means water-bearing formation Resistivity of water Resistivity of waterbearing formation Formation factor
  • 12.
    Volume of Shale:The percentage of shale present in the rock unit Response in the zone of interest Shale Clean formation Indonesian Equation
  • 13.
    GR: The recordof count rate of Natural GAMMA as a result of emission from RADIO ACTIVE MINERALS present in the ROCK UNITS RADIO ACTIVE MINERALS are more in the CLAYS & SHALES GR infer the LITHOLOGY whether rock unit is having CLAYS & SHALES or not In the first /each run (lowering tool), first track (left side of log paper) 0-100 API (10intervels) along with CALIPER,BIT SIZE , SP. GR around 30 -SAND up to 50 -SAND SHALE up to 80 -SHALE SAND up to 100- SHALE more than 100-CLAY Volume of Shale DEPTH GR Vsh
  • 14.
    SP: The recordof voltage variation as a result of electrolytic conduction due to salinity variation between fluids present in the ROCK UNITS electrolytic conduction is more across porous –permeable rock unit SP infer the LITHOLOGY whether rock unit is having porous& permeable SAND or not In the first /each run (lowering tool), first track (left side of log paper) 0-100 units (10intervels) along with CALIPER,BIT SIZE ,GR. SP +Ve : R mf <R w : Shale Base Line is in left side of Sand Deflection Line SP in the same well either +Ve or –Ve : crossover indicates the presence of HYDROCARBON
  • 16.
    OR K=61+0.133T°F R we toR w conversion chart DEPTH SSP K 10 ˆ(SSP/K) Rwe R w
  • 17.
    BIT SIZE :size of the drill-bit used CALIPER: size of the drilled hole Grater than BIT SIZE : absence of permeable rock units / factures Less than BIT SIZE : presence of permeable rock units /MUD CAKE RESISTIVITY : Apparent resistivity of the formation (can calculate true resistivity by using at least three apparent resistivity values ) Using Resistivity Tool: in saline muds , good contact between annulus electrode and BH wall. Using Induction Tool : in non saline muds In the first run (lowering tool), first track (middle of log paper) 0.2-2000 units (log scale) Configuration : App resistivity = (Geometrical factor × Observed voltage difference)/ Sending current Characteristic charts used to calculate true resistivity from apparent resistivity
  • 18.
    DLL MSFL Invasion Correctioncharts DLL MSFL LOG RECORD (R t / R LLD )× R LLD = R t DEPTH LLD LLS MSFL LLD/LLS LLD/MSFL Rt/LLD Rsh = Rt in shale RO = Rt in WBZ Rt
  • 19.
    NEUTRON: The countrate of back scattered neutron/gamma as a result of energizing rock units with neutrons (source: Am Be -16 curie) Sending neutron lose total energy and collapse into the nuclei of HYDROGEN and release a Gamma Response α Hydrogen Index In the first run (lowering tool), third track (right side of log paper) 0.54 - -0.06 (10intervels) along with SONIC ,DENSITY. NEUTRON : Gas < Oil <Water in sand Sand < Shale (bounded water) Correction for shale: Φ Nc = ΦN-(Vsh× ΦN in shale) Neutron Porosity Φ N = ΦN corrected calibration
  • 20.
    Chemical Sources: Neutron sources oAm241-Be9 : emits neutrons with mean energy of 4.2 MeV. oz Californium(Cf252) : emits neutrons with mean energy of 2.35 MeV. Gamma sourceso Cesium(Cs137) produce a steady flux of gamma rays at 662 KeV Electrical Generators: This device produces 14 MeV neutrons by accelerating deuterium ions into a tritium target (up to 125,000 V DC).
  • 21.
    NEUTRON SOURCE ENERGY LEAVING SOURCE NEUTRON ENERGY (eV) 106 104 102 10 eV APPROX. EPITHERMAL ENERGY REGION 1 .4 eV AVERAGE THERMAL ENERGY . 025 EV CAPTURE 01 1 10 TIM E ( µ s ) 100
  • 22.
    Φ N RT GR 20 97 24 24 78 23 22 69 25 28 72 26 30 52 23 Willget Rt =100 Sand Stone Matrix Point ∆t = 48, φN =0 , ρb =2.65 ΦN = 0 10 20 30 40 50 Choose Φ=20
  • 23.
    now mark thepoint φ=20,Rt=156.25 & draw the 80% saturation line Rw=4.878 Sw =80% =0.8 Rt = 100/0.64 = 156.25 now replace the 0.64 by 0.36,0.16,0.04 …..to get the 60%,40%,20%,…… saturation lines
  • 24.
    SW =1=100% Red Points GR=23-30 BluePoints GR=30-40 Yellow Points GR=40-50
  • 25.
  • 26.
    Ro =F Rw Rt=F Rwa Different Trend HC indication Main Trend Rwa line WBZ
  • 27.
    50 = φDC -10 0 10 20 30 40 GAS -10 0 10 20 30 40 50= φ NC
  • 28.
    DENSITY : Thecount rate of back scattered gamma as a result of energizing rock units with gammas (source : Cs 137) Sending gamma undergone Compton Scattering no of collisions α no of electrons in rock unit ρe ρb = 1.0704 ρe + 0.1883 In the first run (lowering tool), third track (right side of log paper) 2.8 -1.8 (10intervels) along with SONIC ,NEUTRON. DENSITY: Gas < <Oil <Water in sand Correction for shale: Φ Dc = ΦD-(Vsh× ΦD in shale)
  • 30.
    Effective Porosity: Volumeof interconnected pores Neutron Correction for shale: Φ Nc = ΦN-(Vsh× ΦN in shale) Density Correction for shale: Φ Dc = ΦD-(Vsh× ΦD in shale) DEPTH Φ N cal Φ NC ρb φD φDC Φeff
  • 31.
    Indonesian Equation S HC= (1-SW) DEPTH Rw Rt Φ eff S W S Hc S Hc × Φ eff
  • 32.
    Here our goalneed more data from ROCK PHYSICS LABORATORY, so it limited to S hc × φ e
  • 33.
    Conventional Open holelogs Lithology logs (SP,GR with CALIPER) Porosity logs (NEUTRON, DENSITY ,SONIC) Resistivity logs (RESISTIVITY, MICRORESISTIVITY) Lithology (shale ,sand ,…) Porous –permeable beds (no of ,thickness) Shale volume Effective porosity Type of fluid Contacts (GSC,GOC,OWC,GWC) Uncompacted Formation water & True resistivity Saturation MHI Permeability indication
  • 34.
  • 35.
  • 37.
    Lithology GR Rt φN Sand Stone (more compacted & dry ) Less=25 Less clay minerals More=1000 SiO2 insulator / no electrolytic conduction Less<10 More=2.6 No fluid / no H2 Closed grain packing Sand Stone ( less compacted & wet) Less=25 Less clay minerals Less<100 Saltwater conductor / electrolytic conduction More=10-30 Having H2 Moderate=2.1 (30% H2O=1 /70% SiO2 =2.6) Having oil Less=25 Less clay minerals Moderate >100-700 Oil insulator (at least 5times of R0 ) More=10-30 Having H2 (less than water zone) Moderate=1.9 (less than water zone) Having gas Less=25 Less clay minerals More >700 Gas insulator (at least 5times of More=10-30 Having H2 (less than oil Less =1.8 Having water ρb
  • 38.
    Lithology GR Rt φN ρb Sand-Shale ( more compacted& dry ) Less=30-50 More or less clay minerals More<100 Dry clay insulator ,bounded water in composition / not much electrolytic conduction Less=20 No fluid / bounded water H2 More=2.5 Closed grain packing (30%shale =2.3,70%sio2=2 .6) Sand-Shale ( less compacted & wet) Less=30-50 More or less clay minerals Less<50 Wet clay conductor / more electrolytic conduction More=20-40 Having H2 Moderate=2.2 (20% H2O=1 ,50% SiO2 =2.6 30%Shale 1.82.6) Having oil Less=30-50 More or less clay minerals Moderate >100-700 Oil insulator (at least 5times of R0 ) More=20-40 Having H2 (less than water zone) Moderate=1.8 (less than water zone) Having gas Less=30-50 More or less clay minerals More >700 Gas insulator (at least 5times of oil zone ) More=20-40 Having H2 (less than oil zone) Less =1.7 Having water
  • 39.
    Lithology GR Rt φN ρb Shale ( more compacted& dry ) More =80-100 More clay minerals (80%) More<50 Dry clay insulator / not much electrolytic conduction Less=30-40 No fluid / bounded water H2 More=2.3 Closed grain packing Shale ( less compacted & wet) More =80-100 More clay minerals Less<10 Wet clay conductor / more electrolytic conduction More=40-50 Having H2 Moderate=1.9 (30% H2O=1,70% shale=2.3) , More >100(120) More clay minerals More<50 Dry clay insulator /Less<10 Wet clay conductor Less=30-40 More 2.4 Having water Clay
  • 40.
    Dileep.P.Allavarapu dpa.taeching@gmail.com /or motherindia.energy@gmail.com 9703070878 Contact anyInstitution Dept. of Mathematics, MGR Junior College Dept. of Chemistry, LAMP Degree College Dept. of Geophysics , Andhra University Logging Base ,ONGC –Rajahmundry Asset Oil and Gas Deliveries, Infotech Enterprises Limited Gravity Observatory , Gravity Group-NGRI Seismological Observatory, Warna Canal Division-MERI UV Physics Academy Analog IAS Academy THANK U