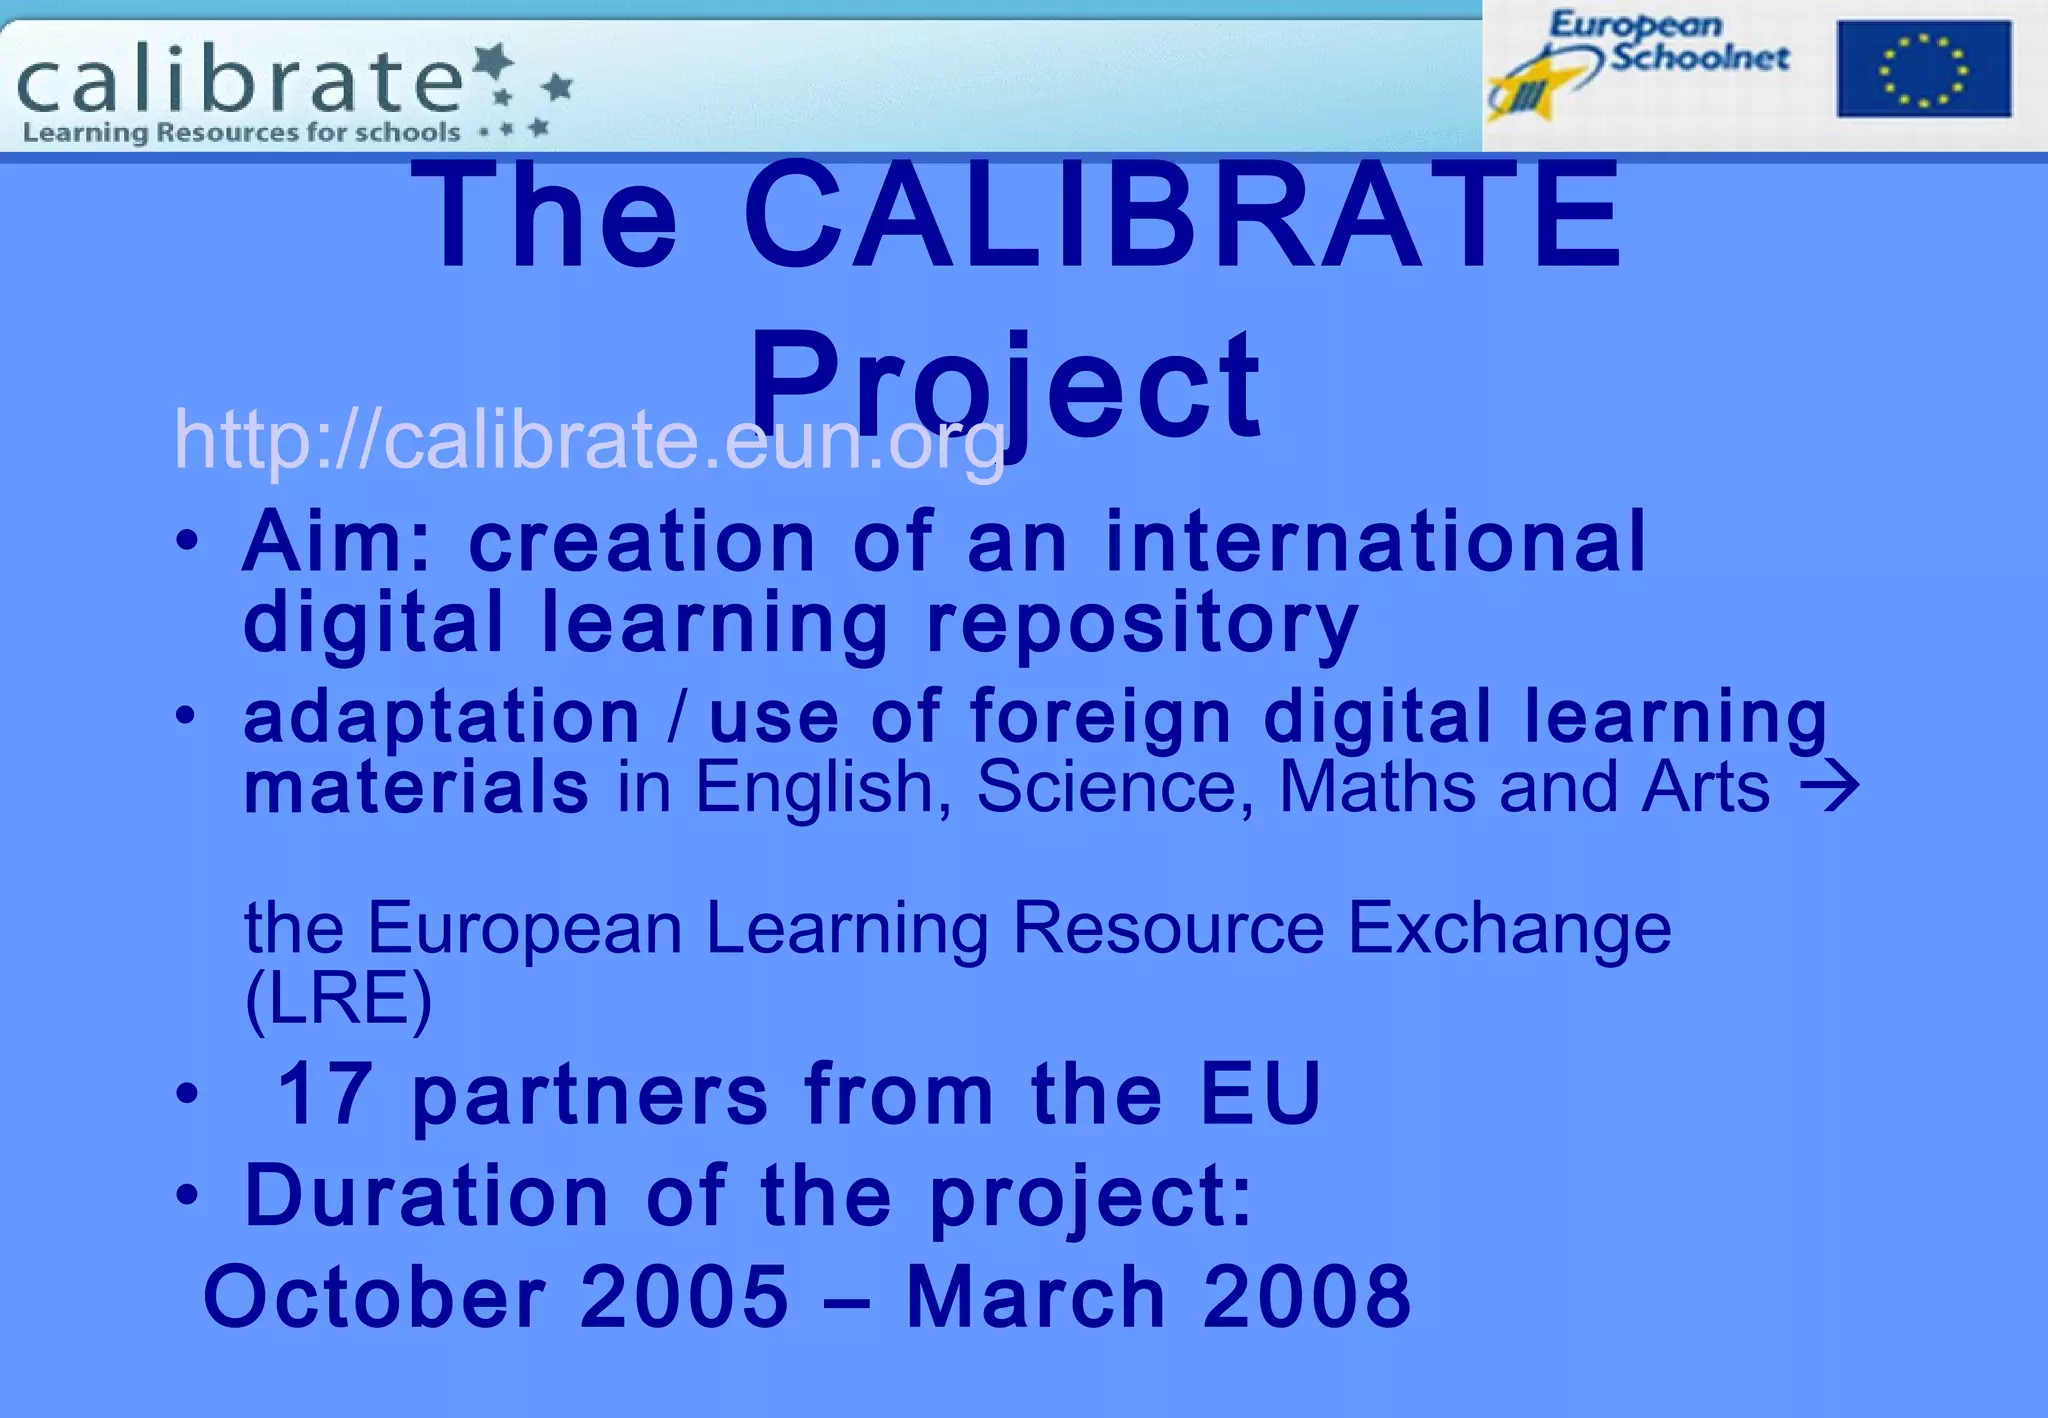
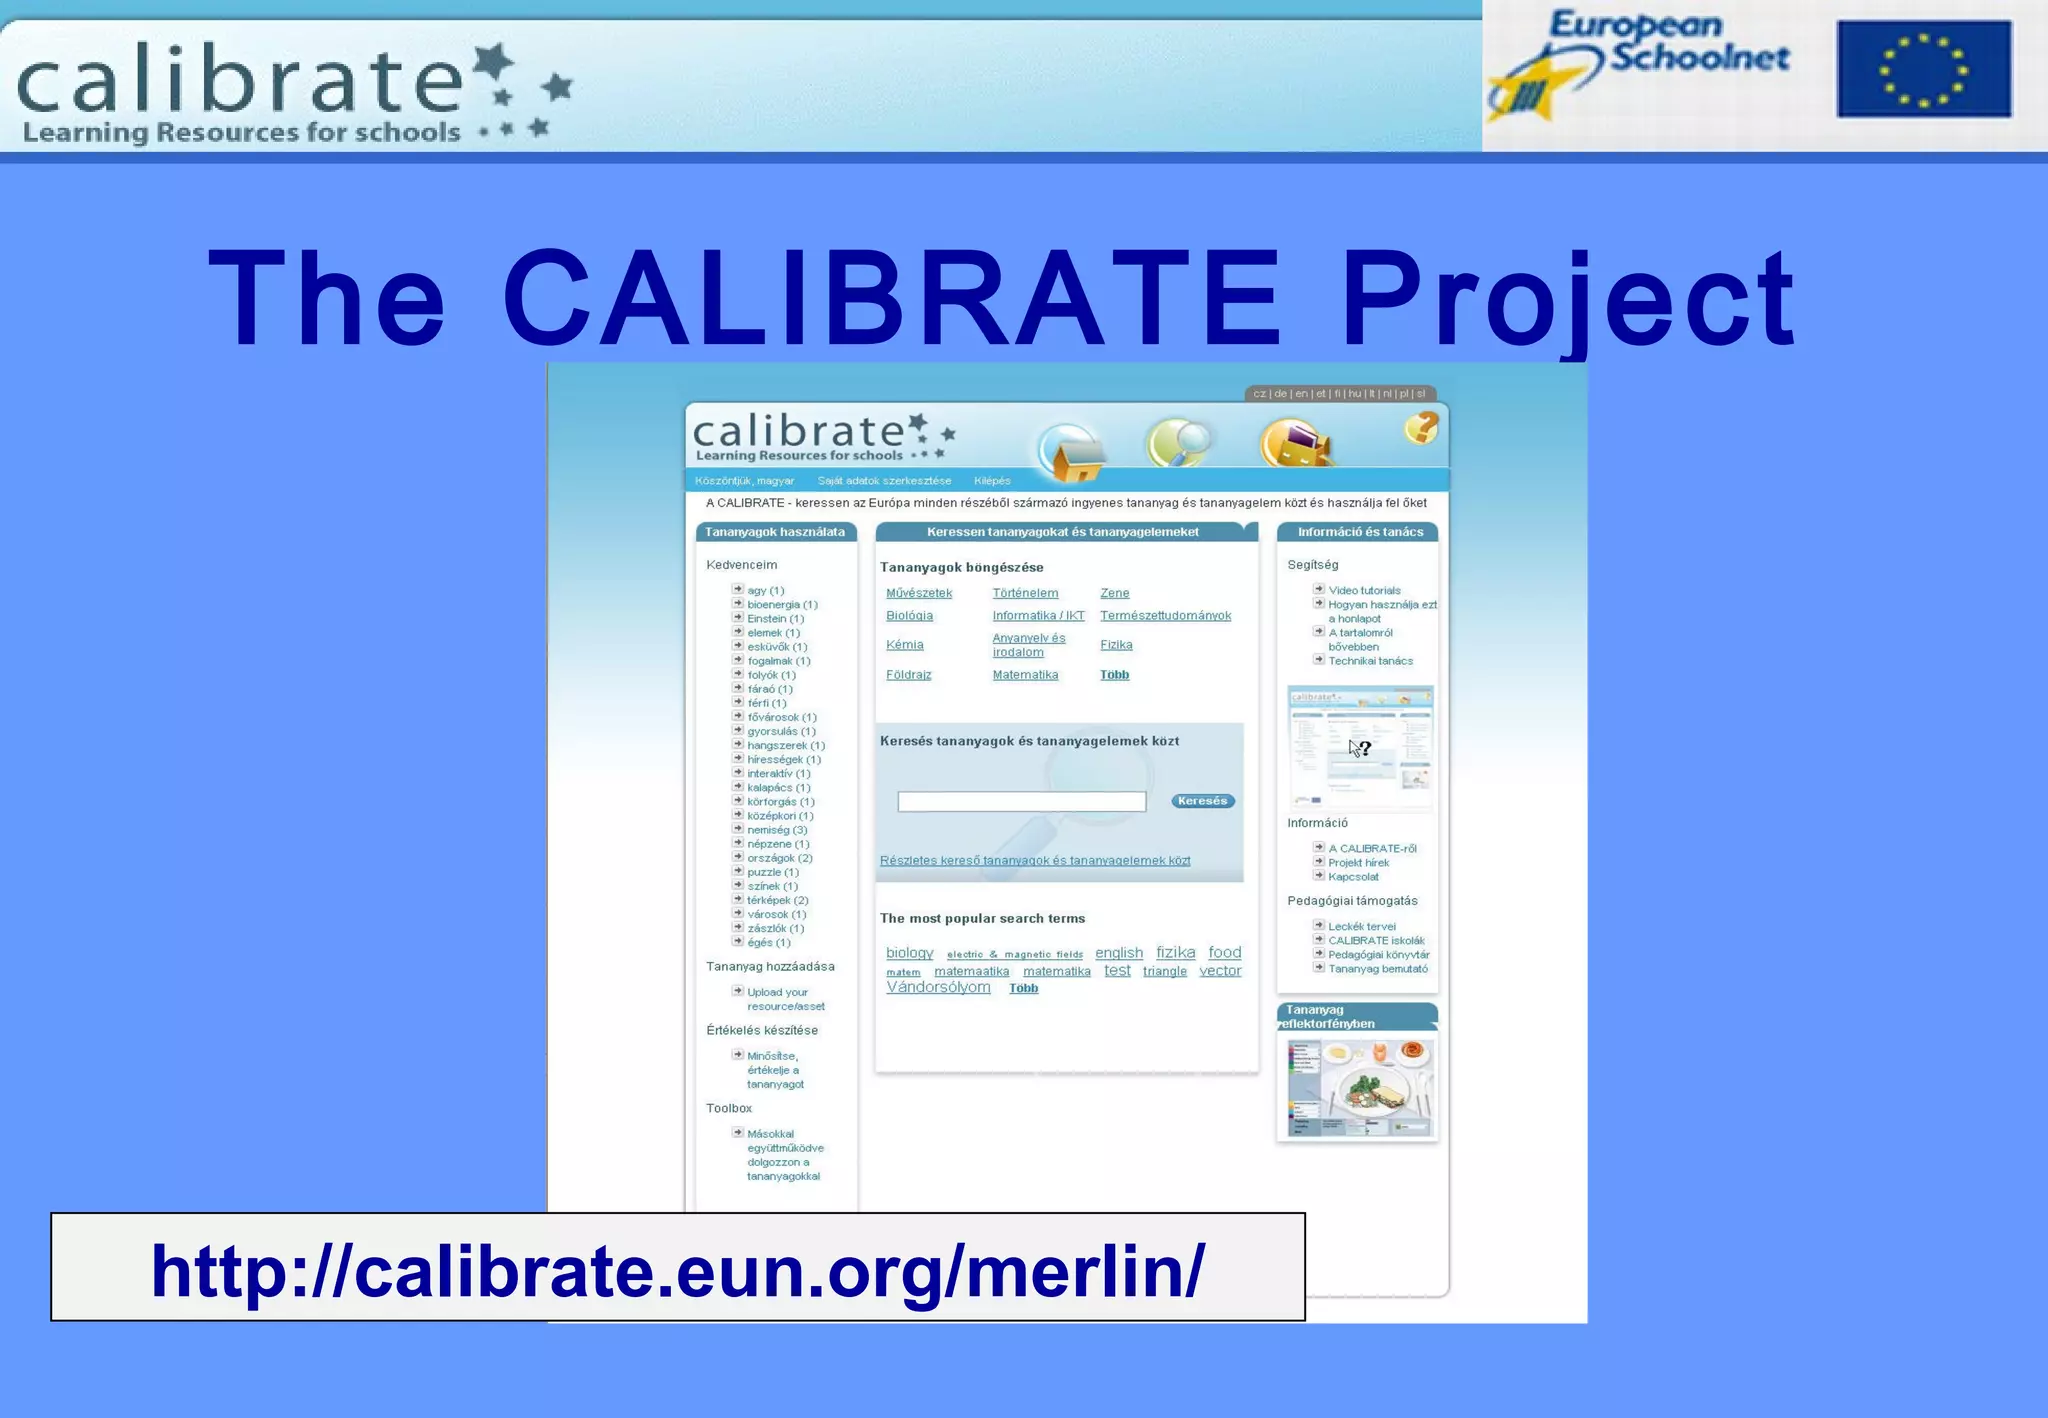
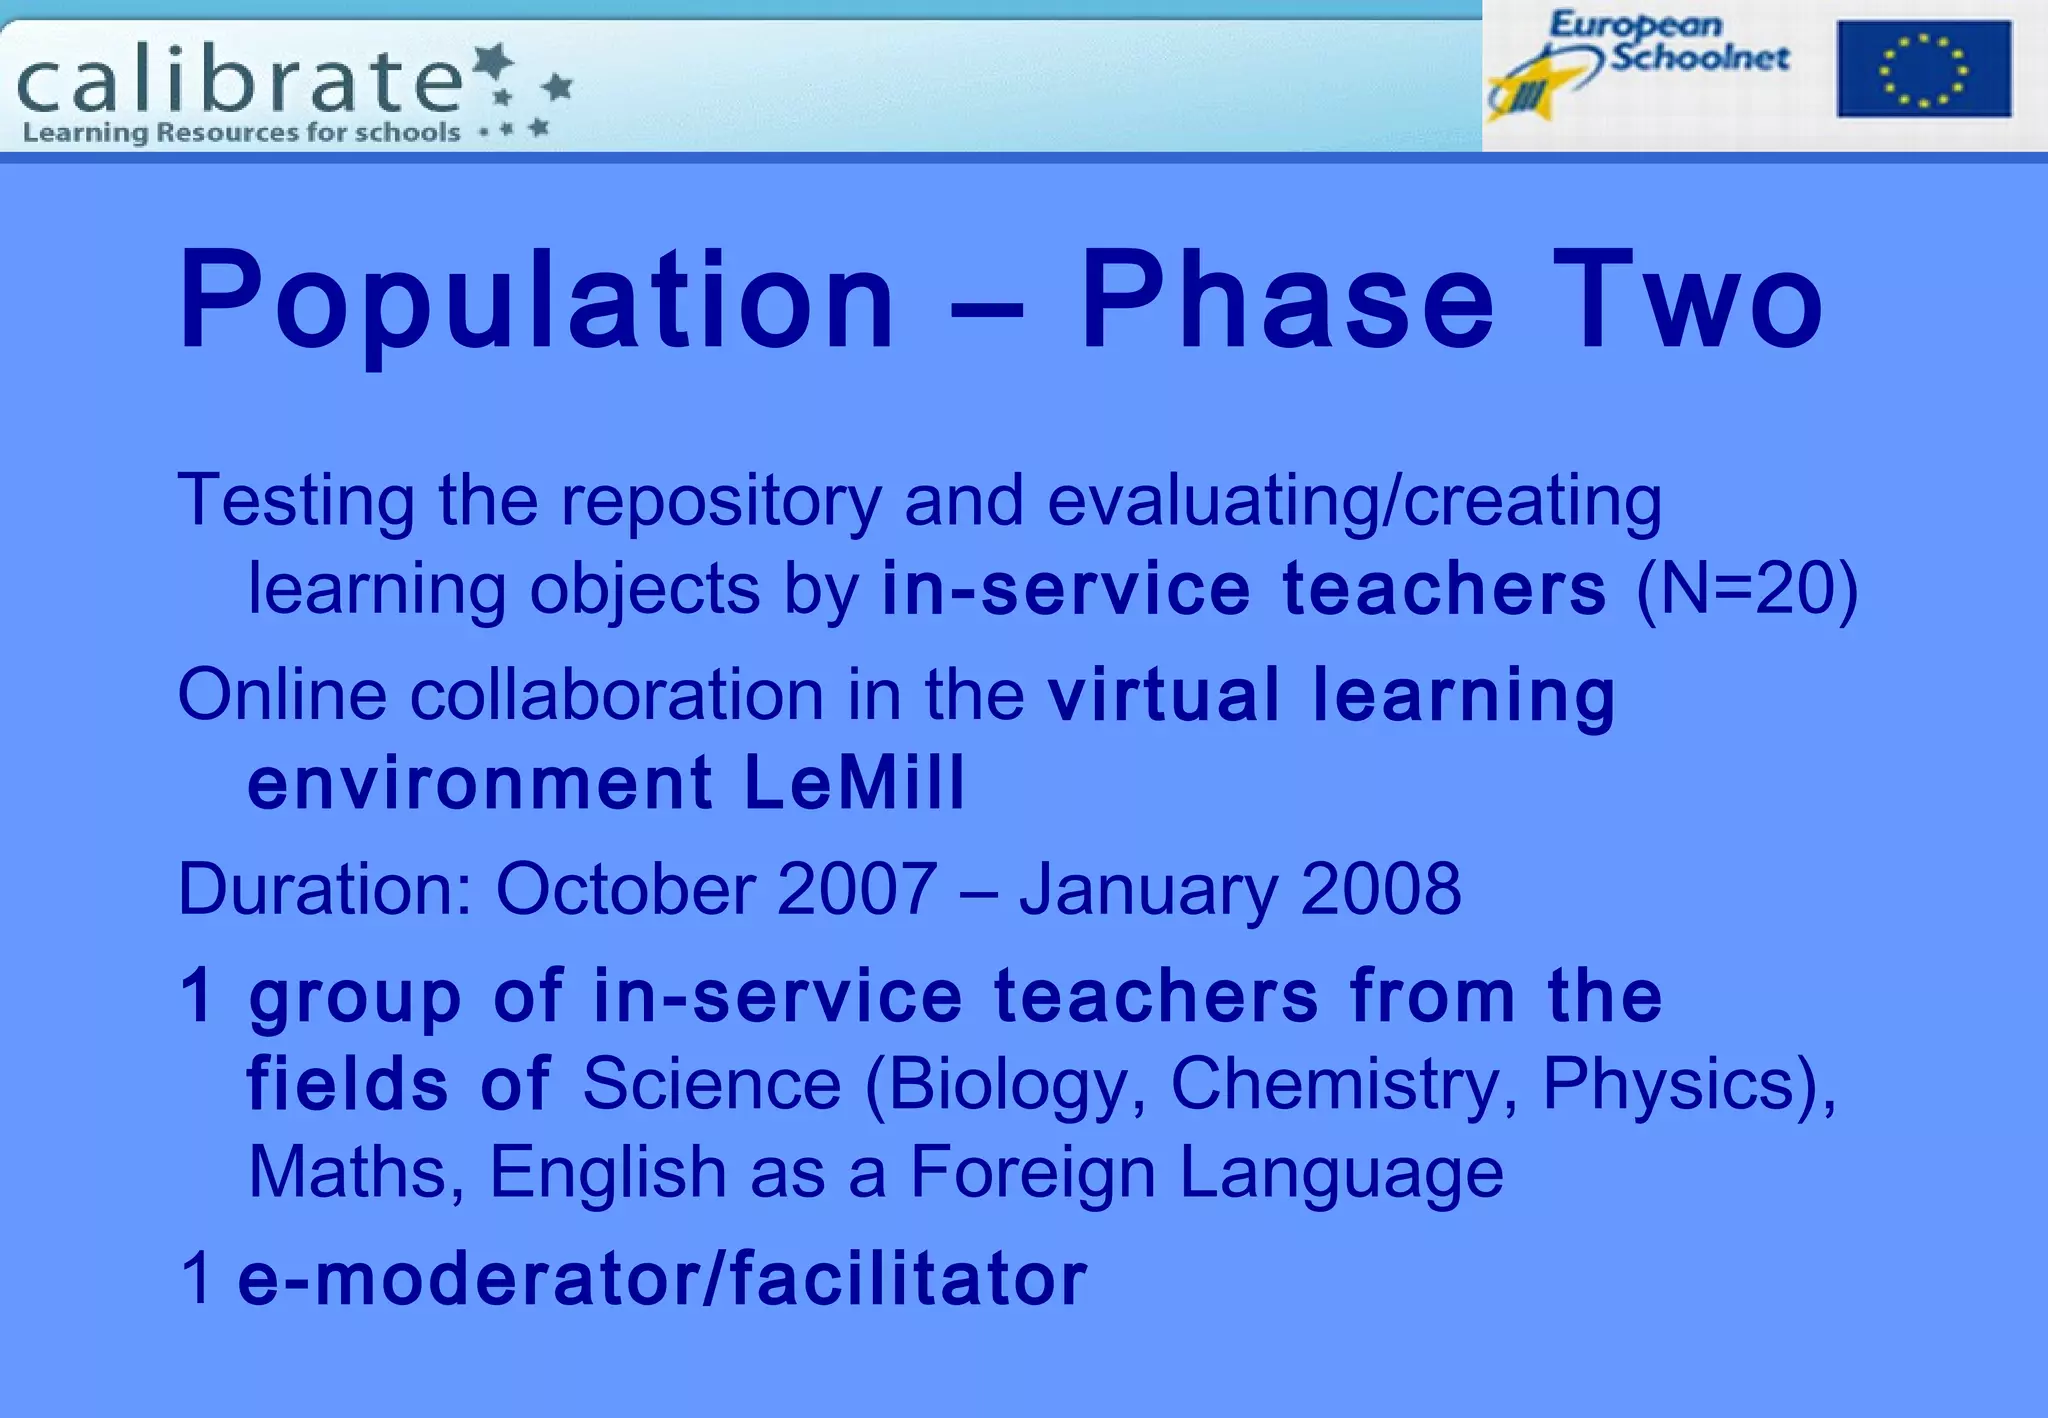
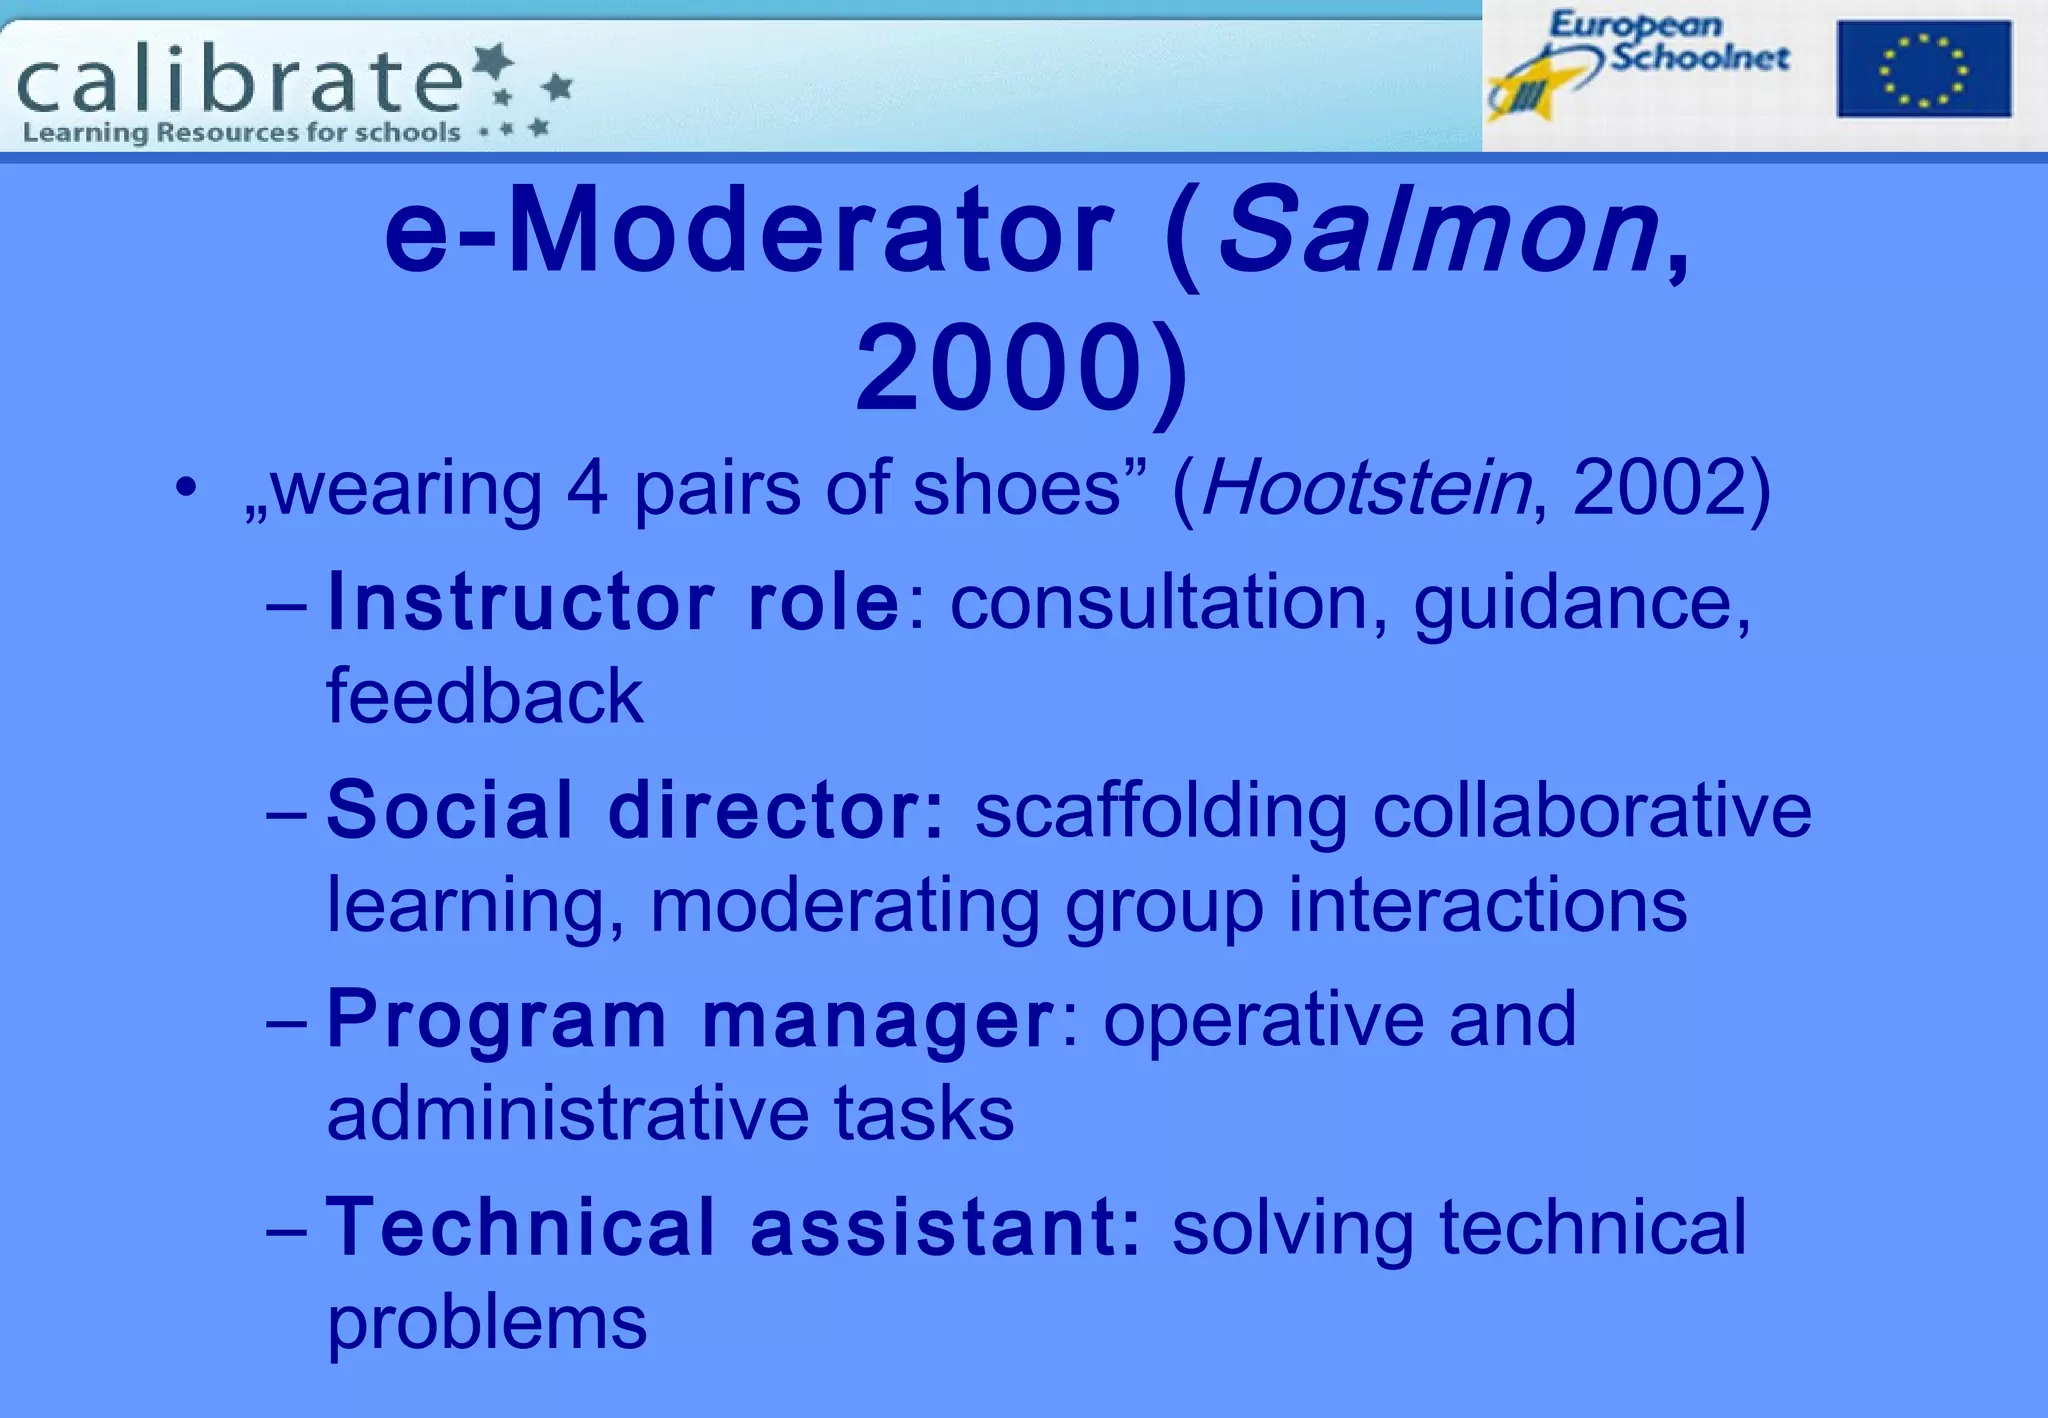
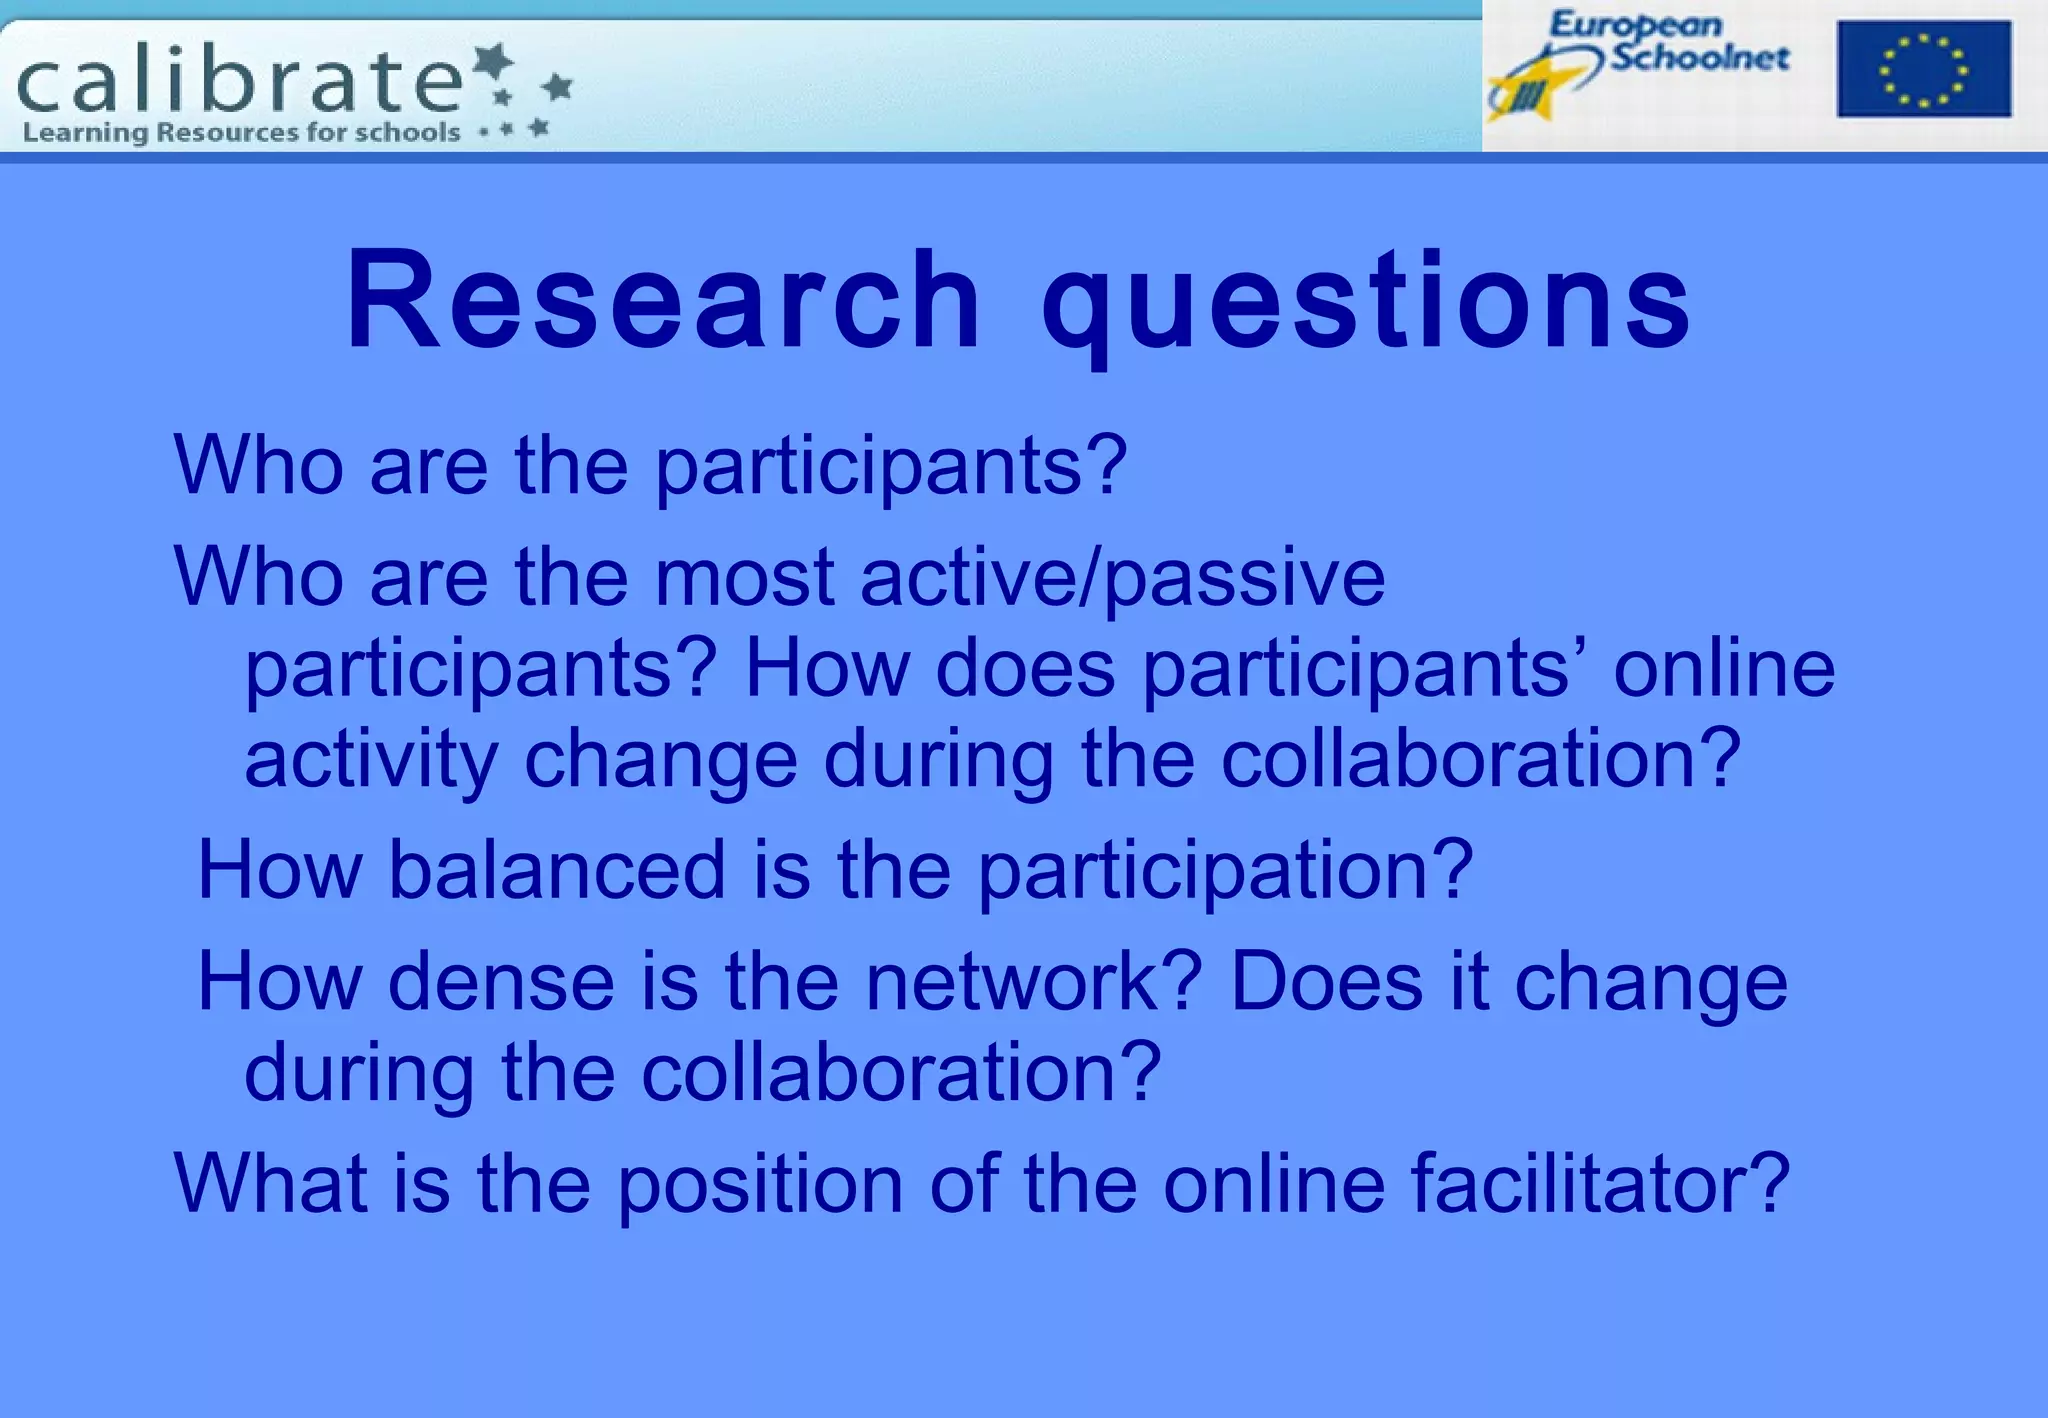
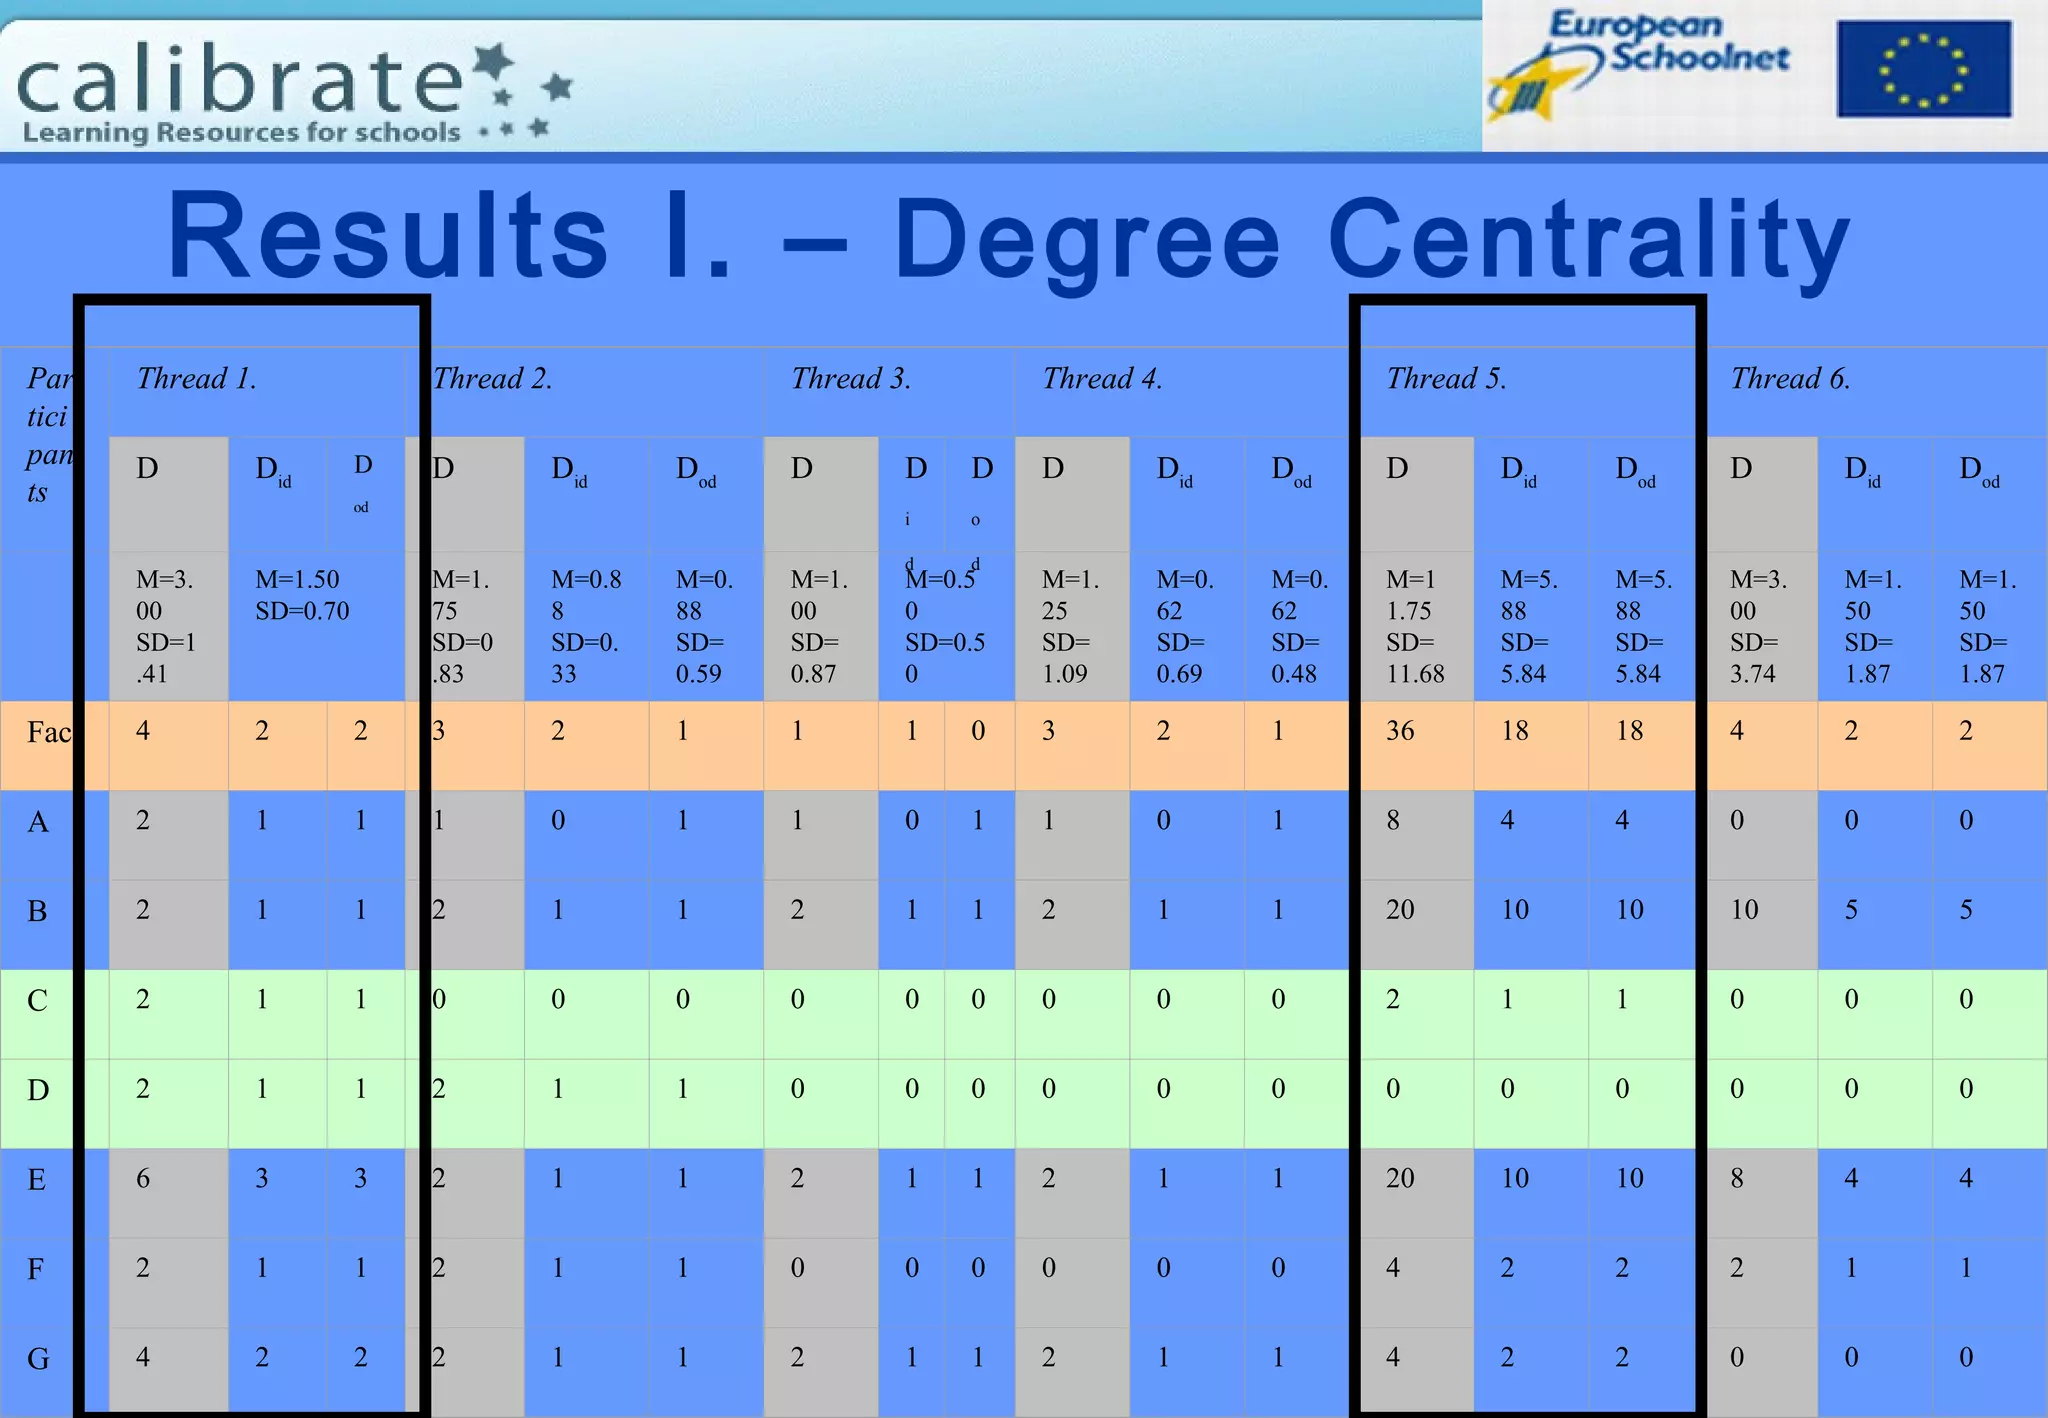
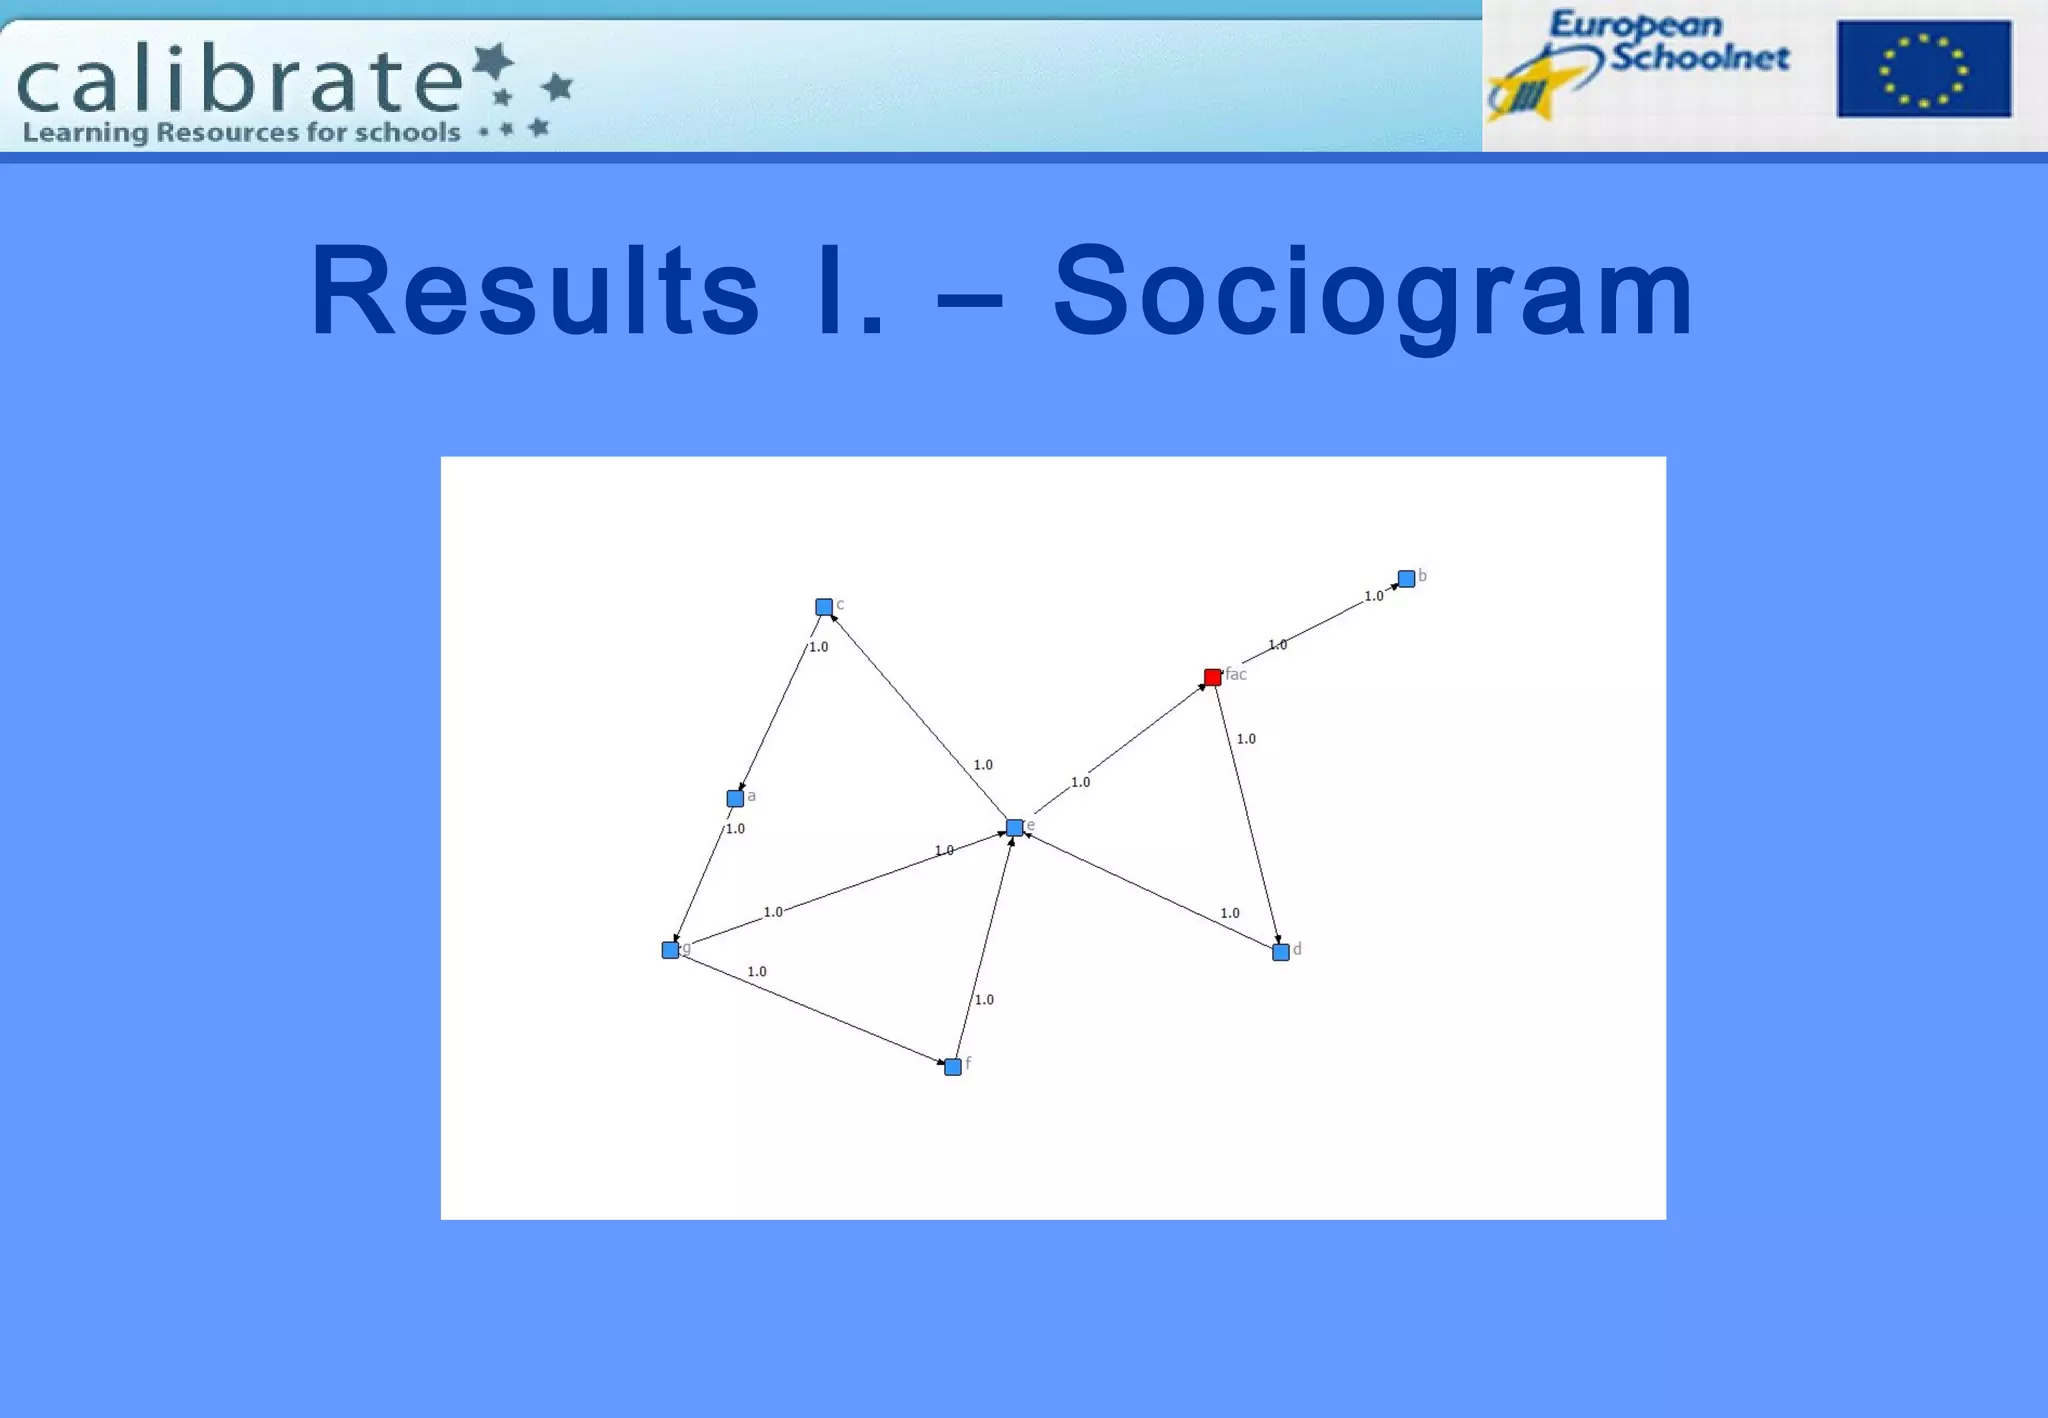
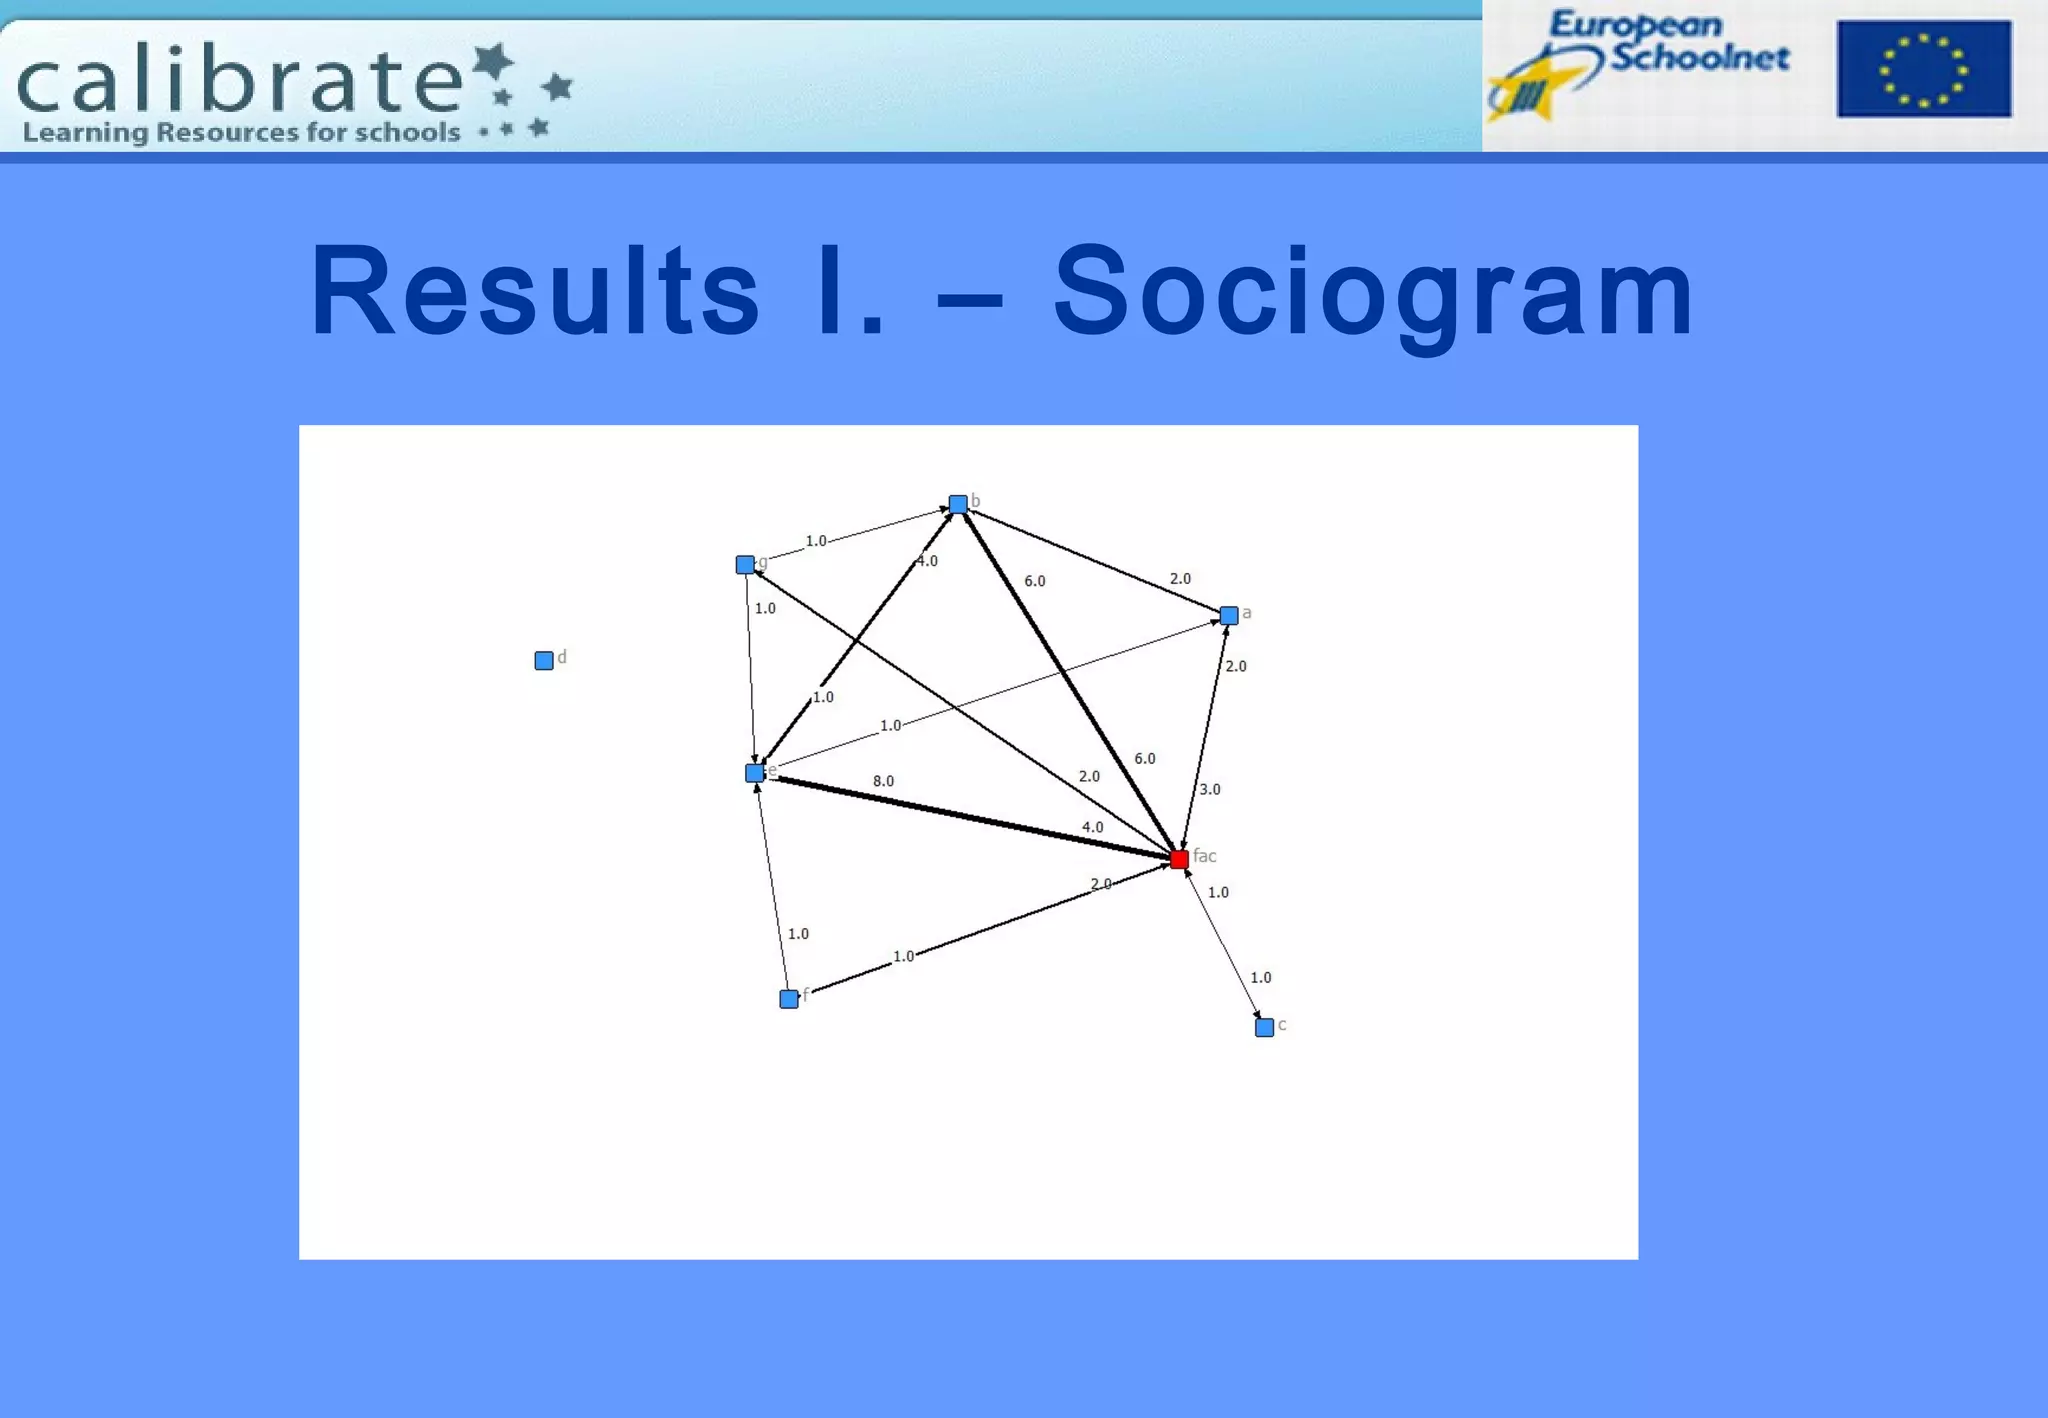
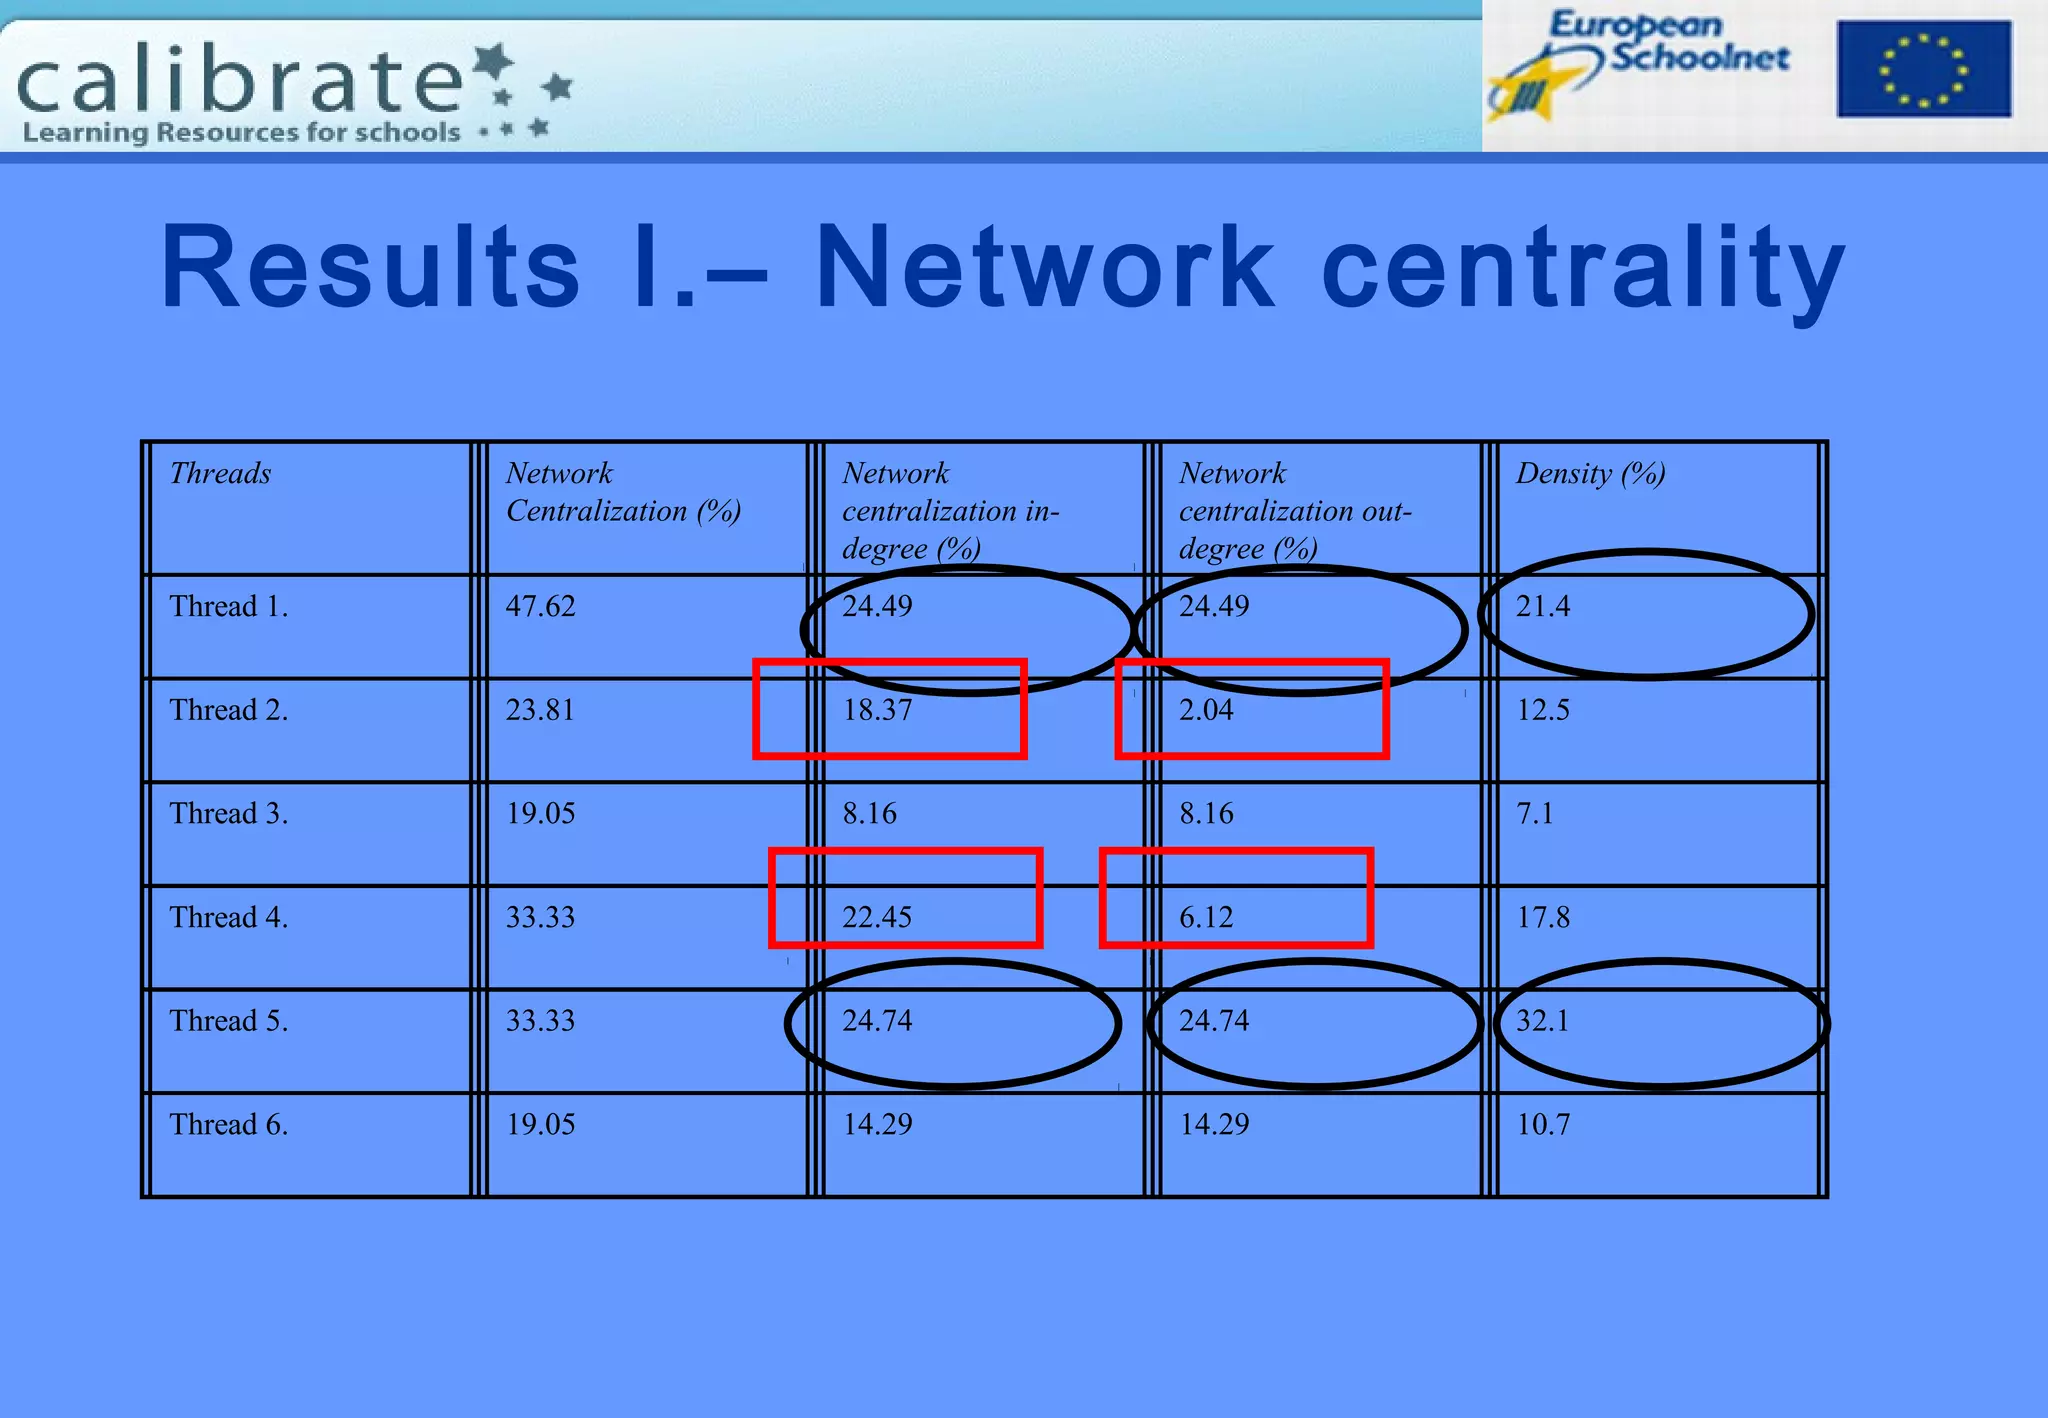
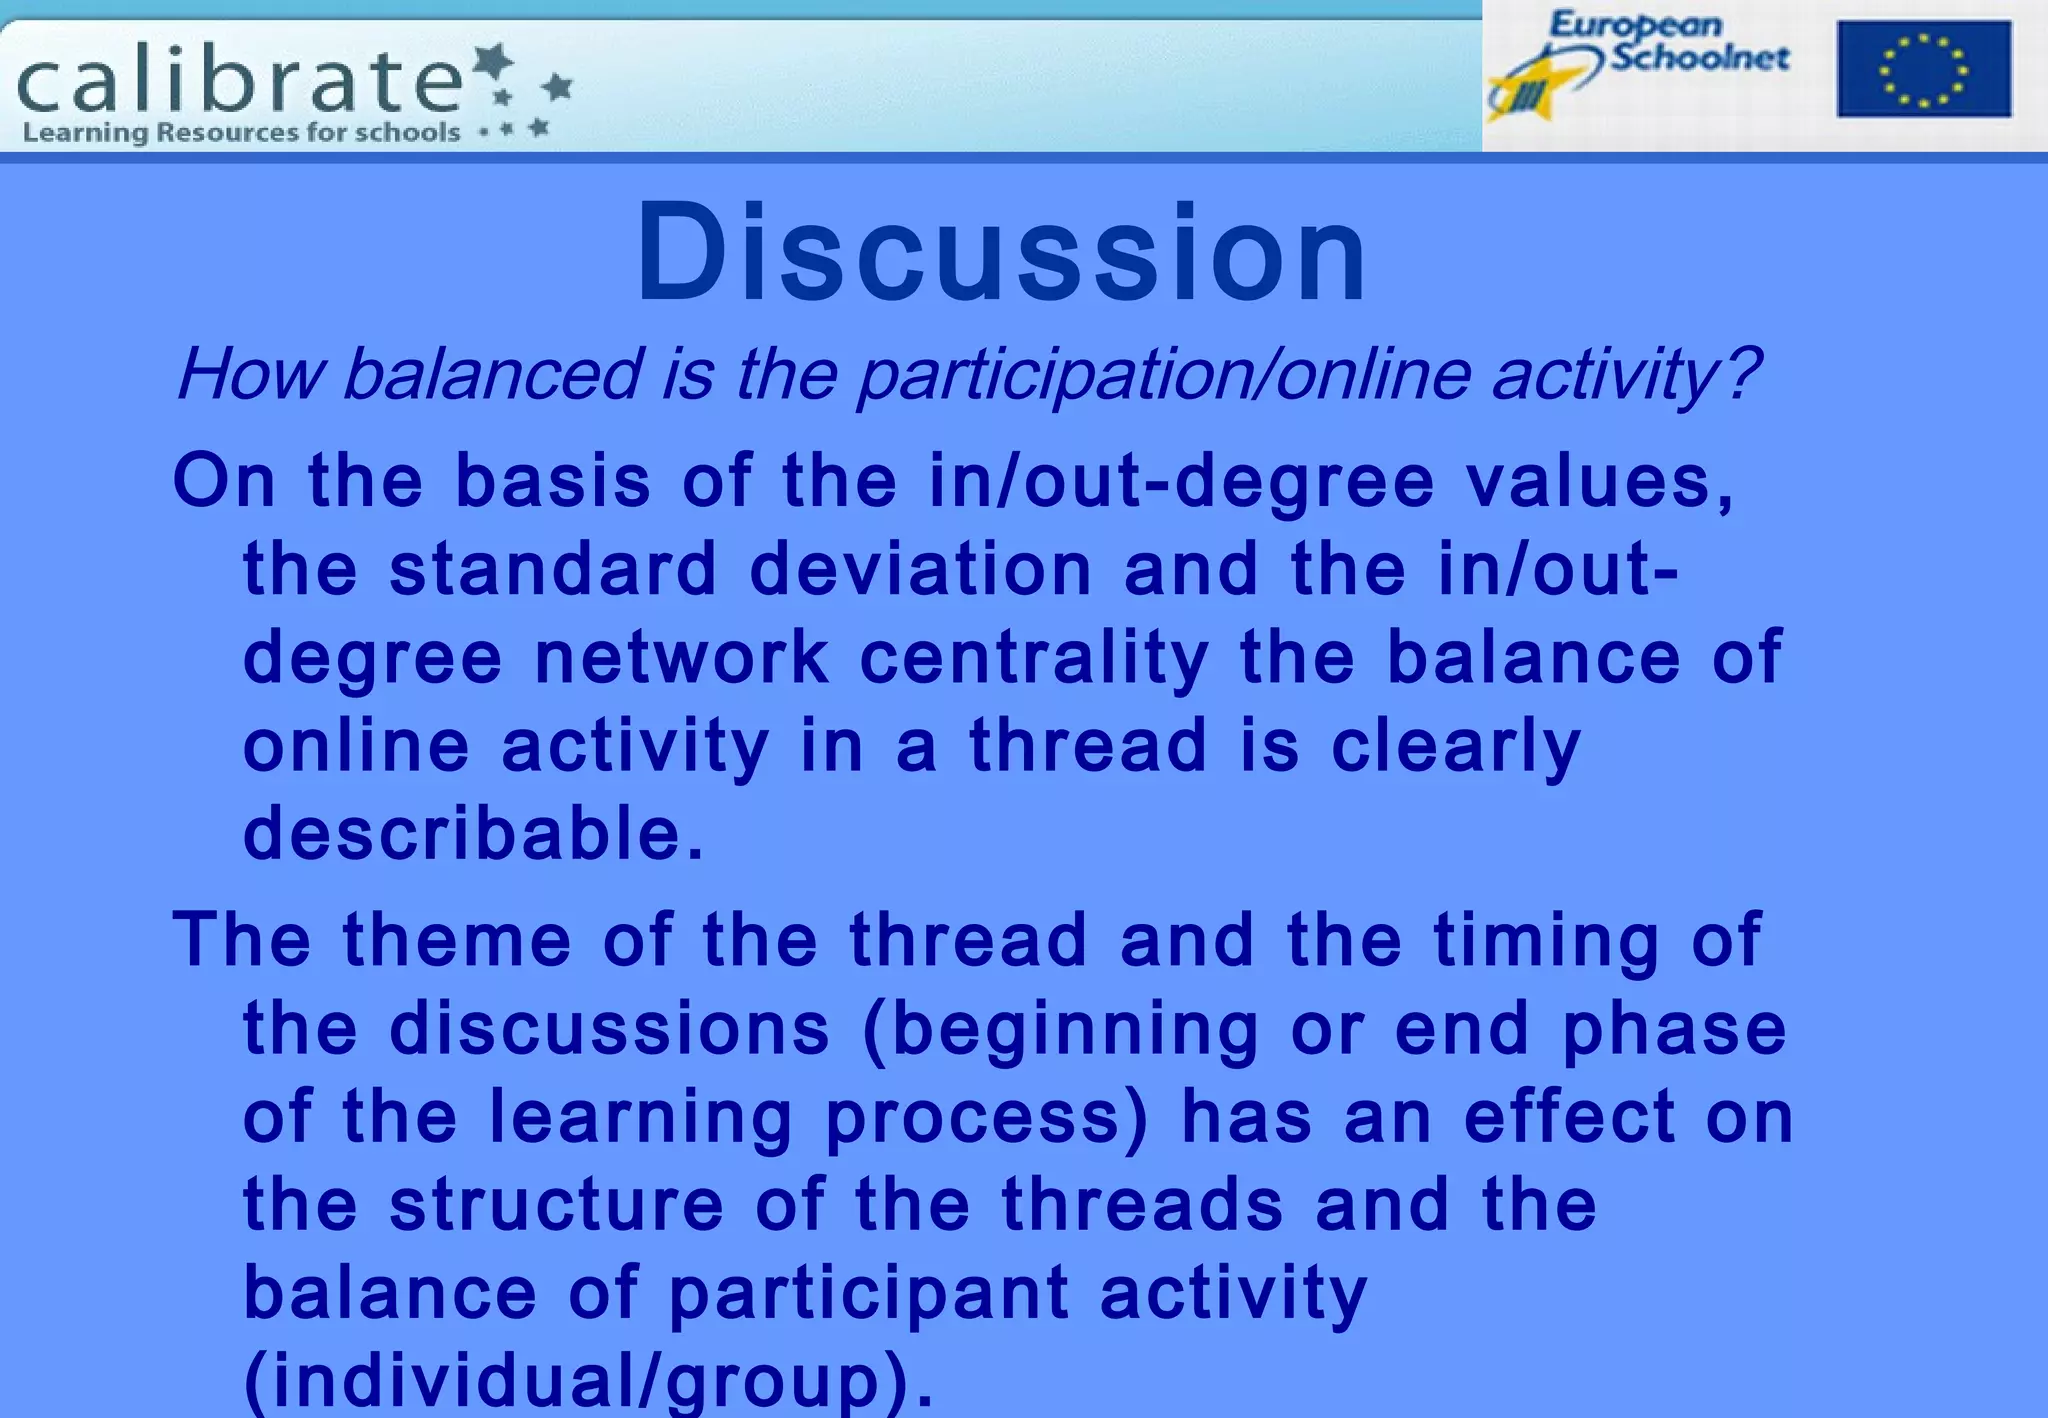
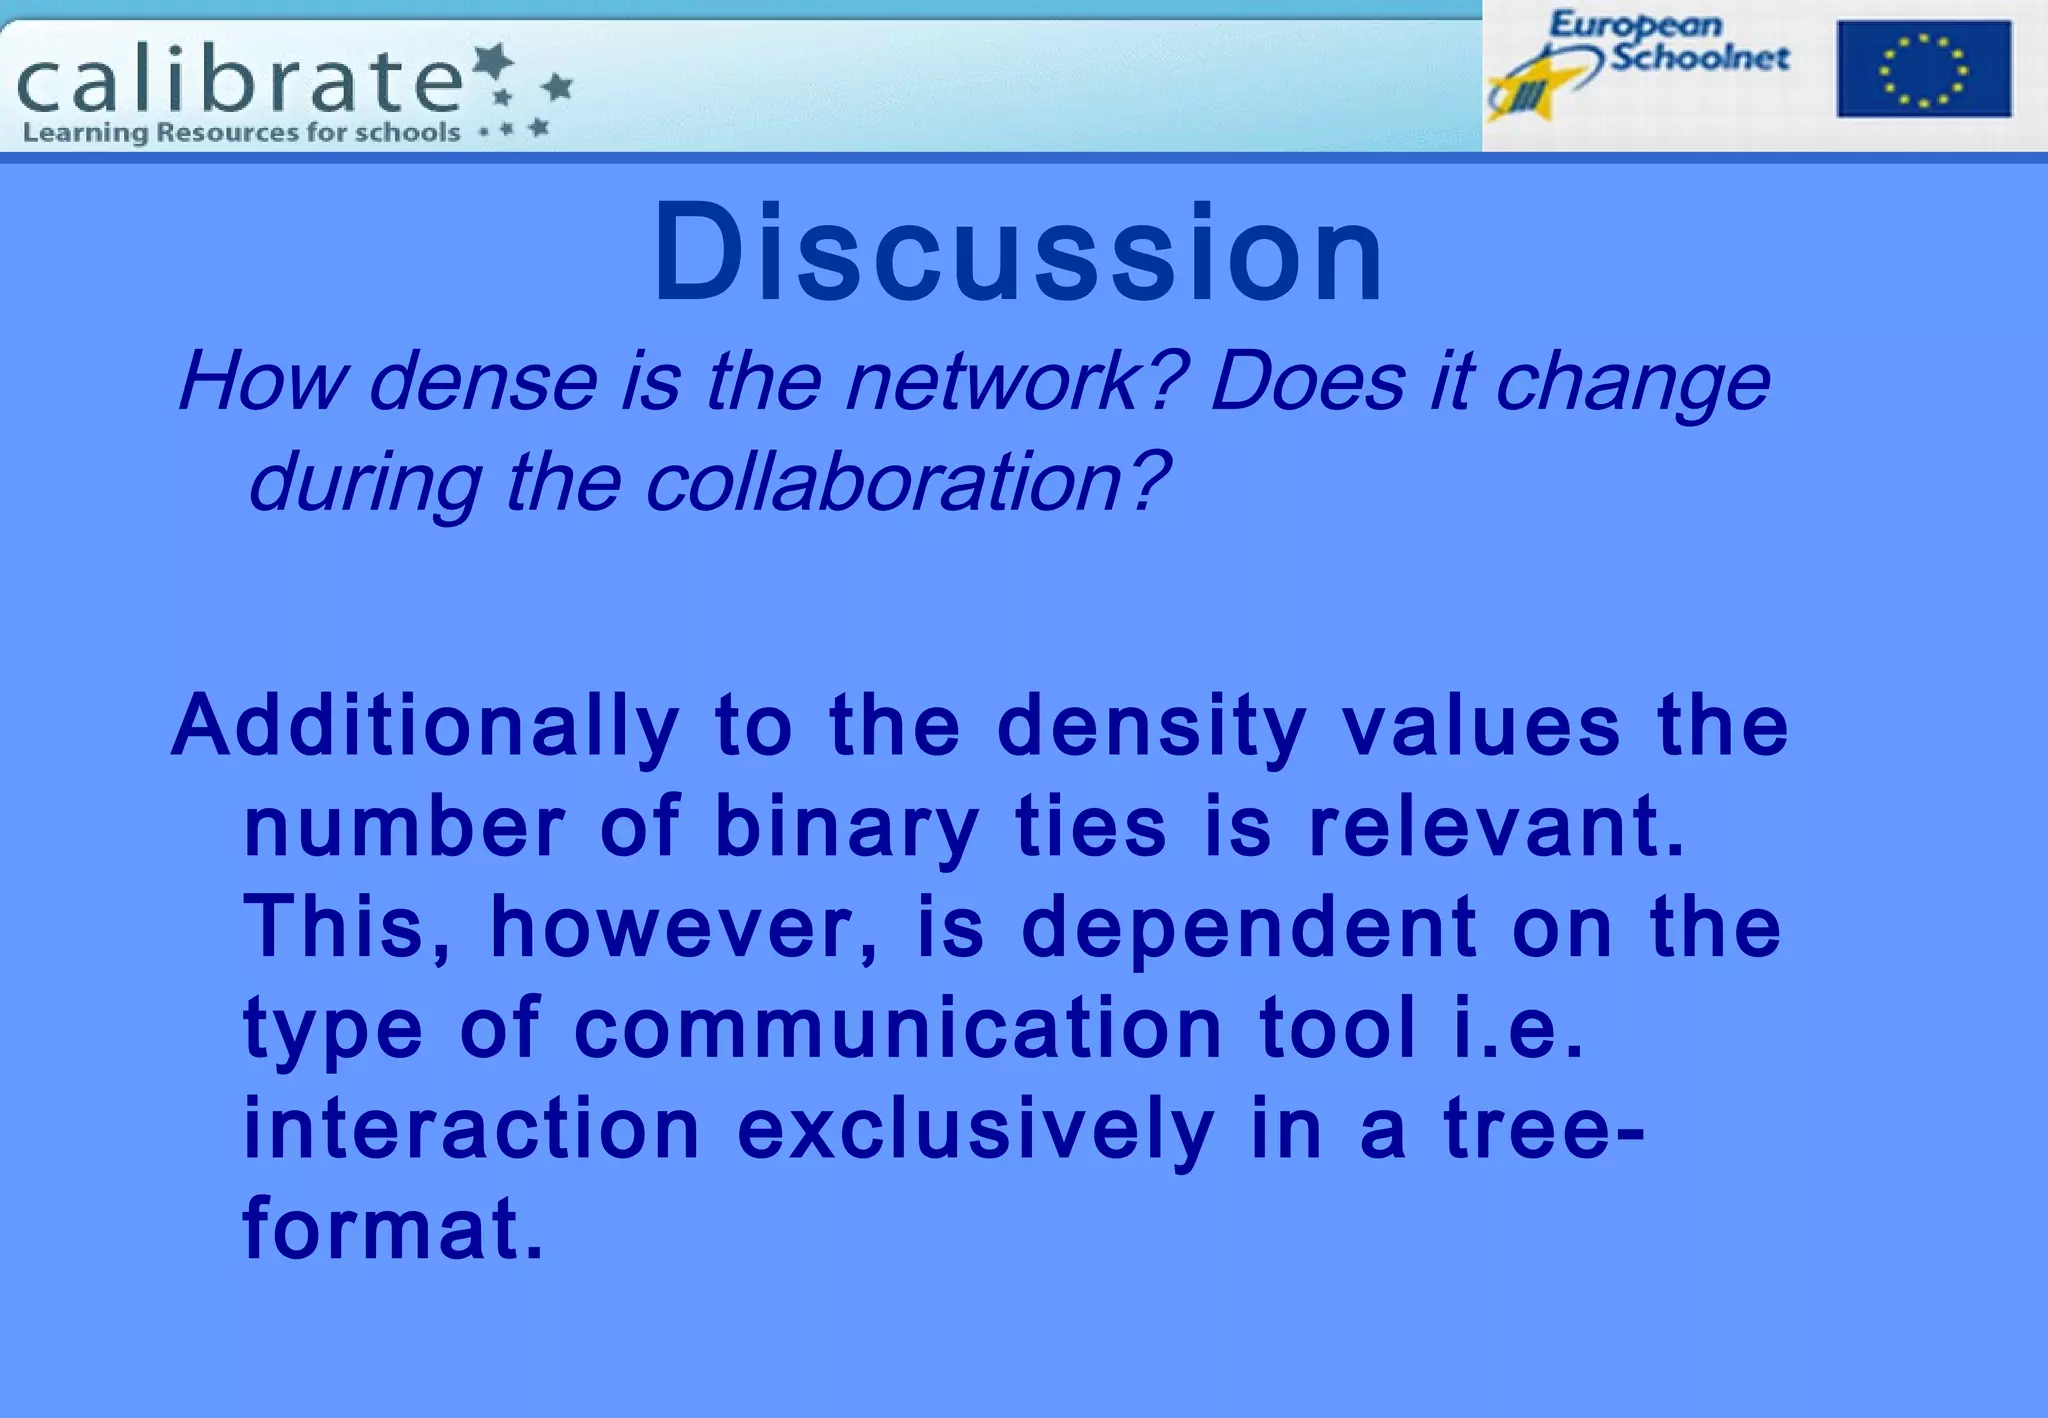
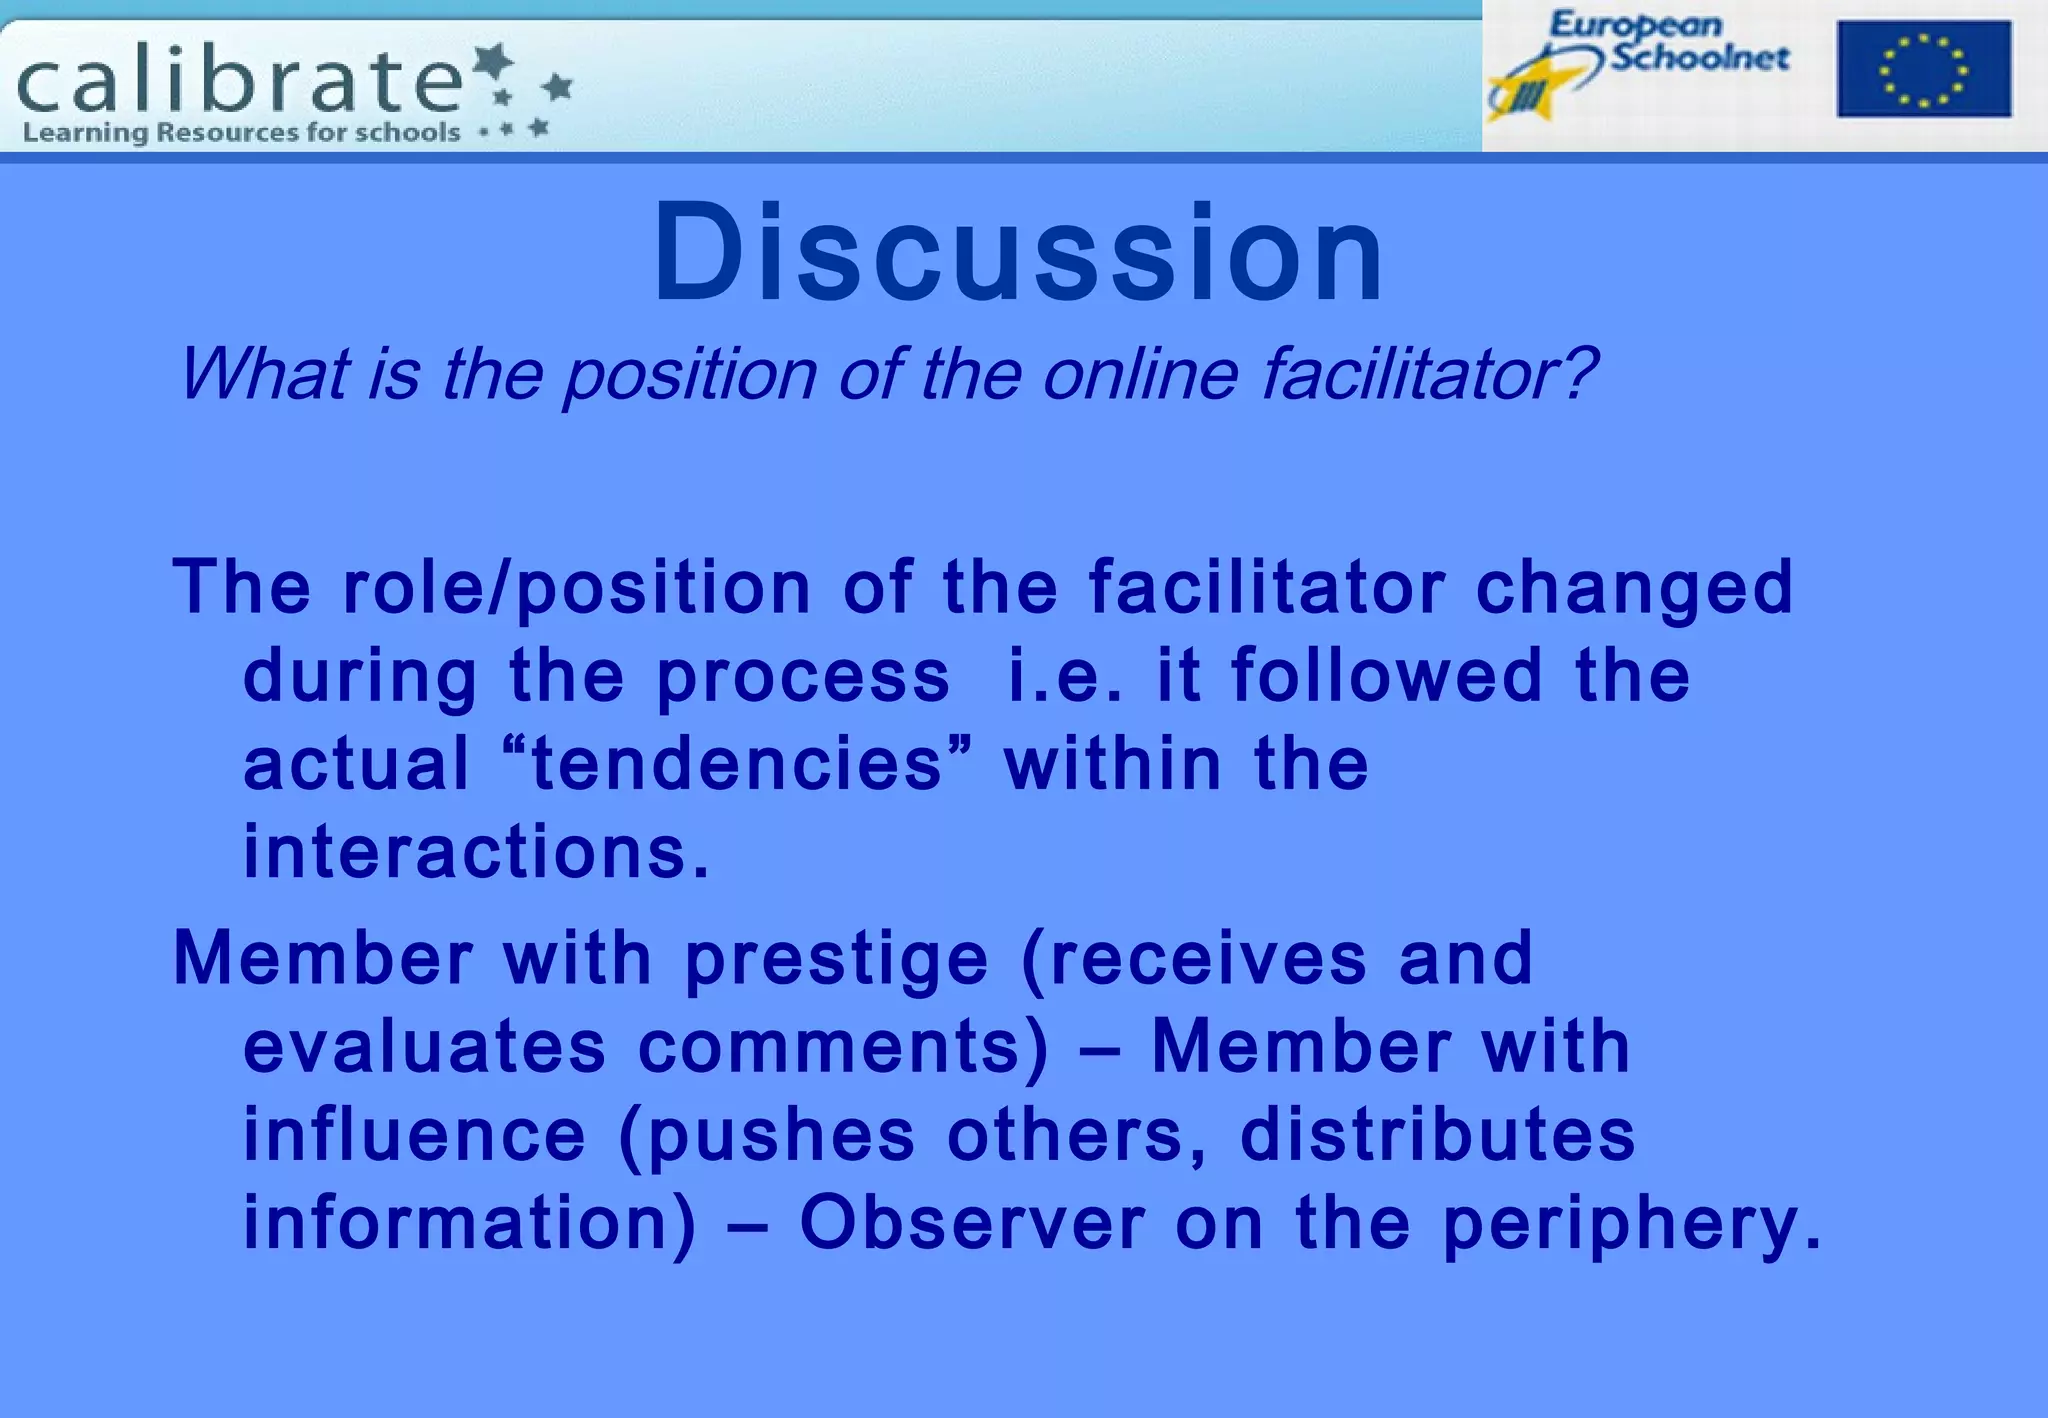
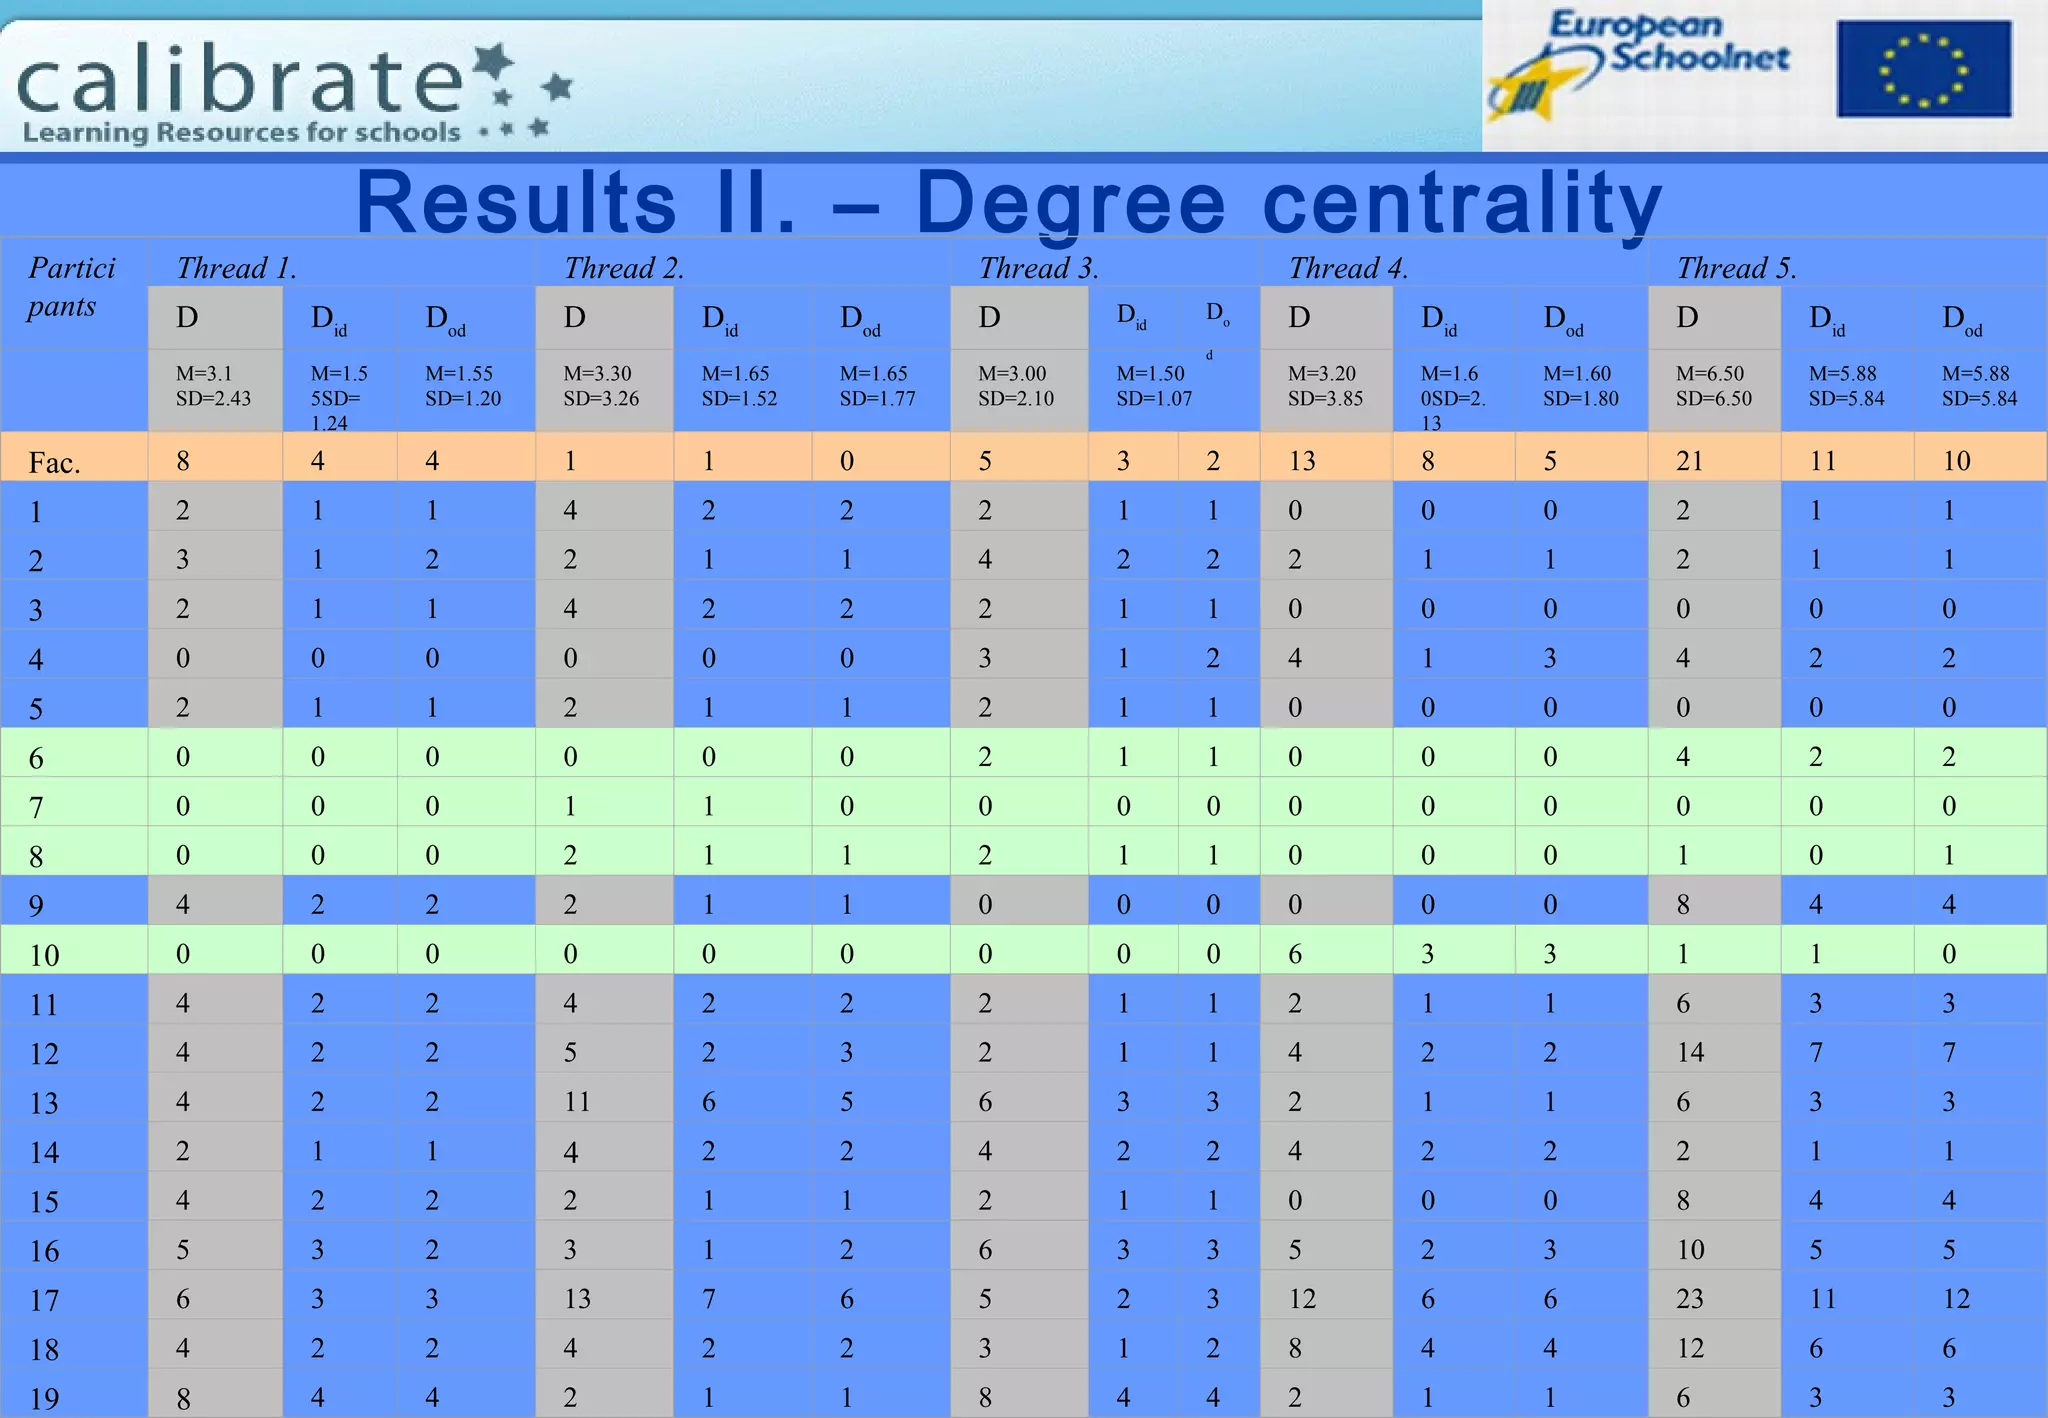
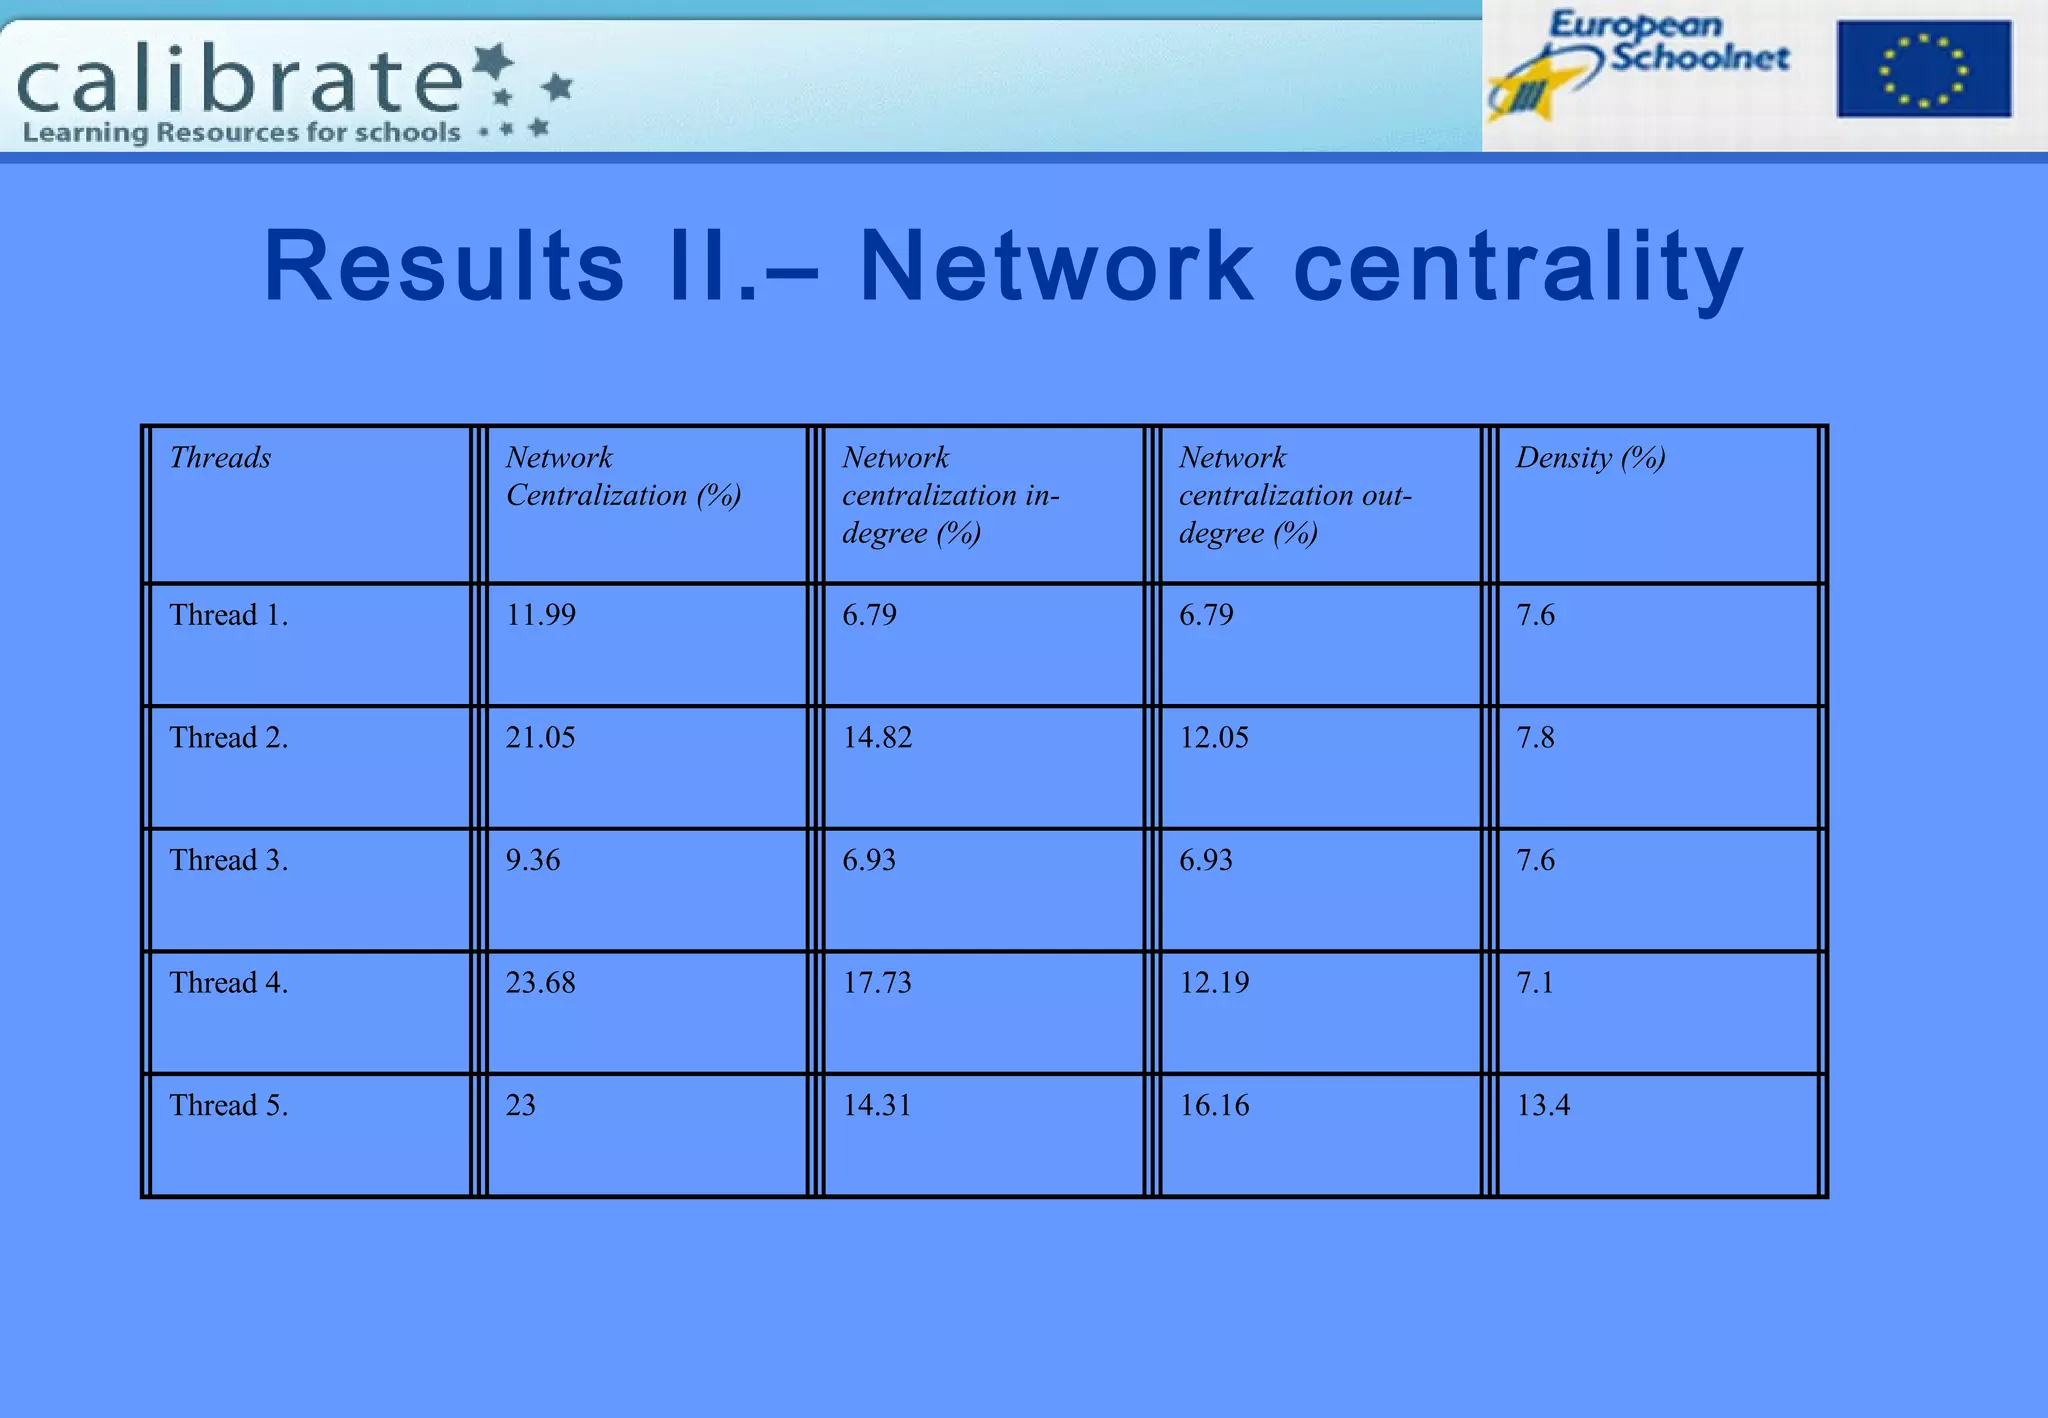
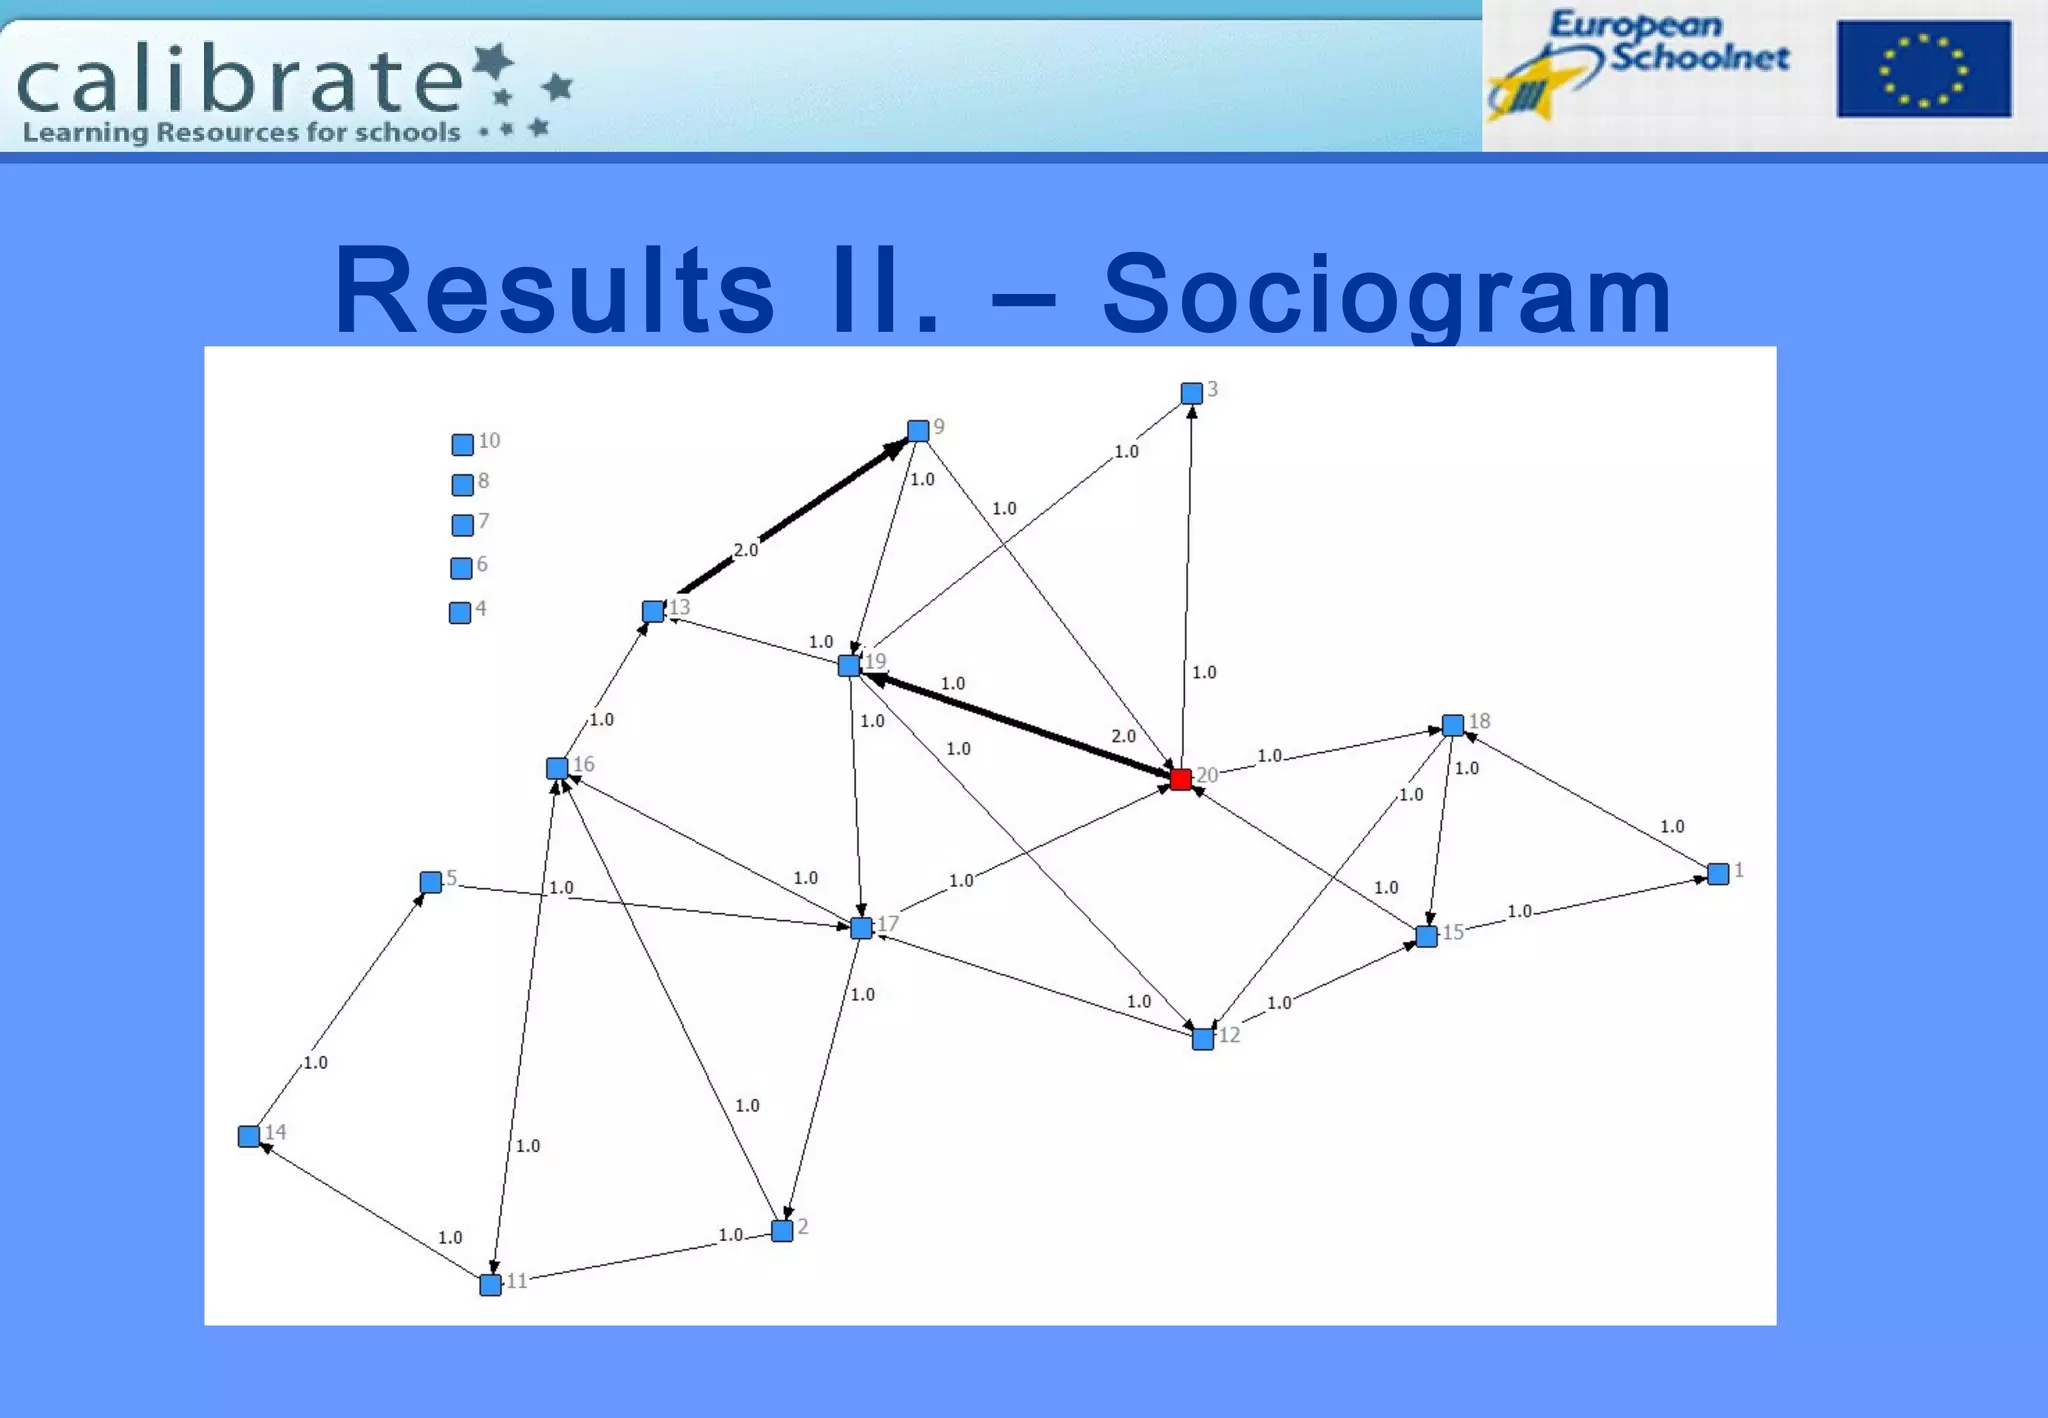
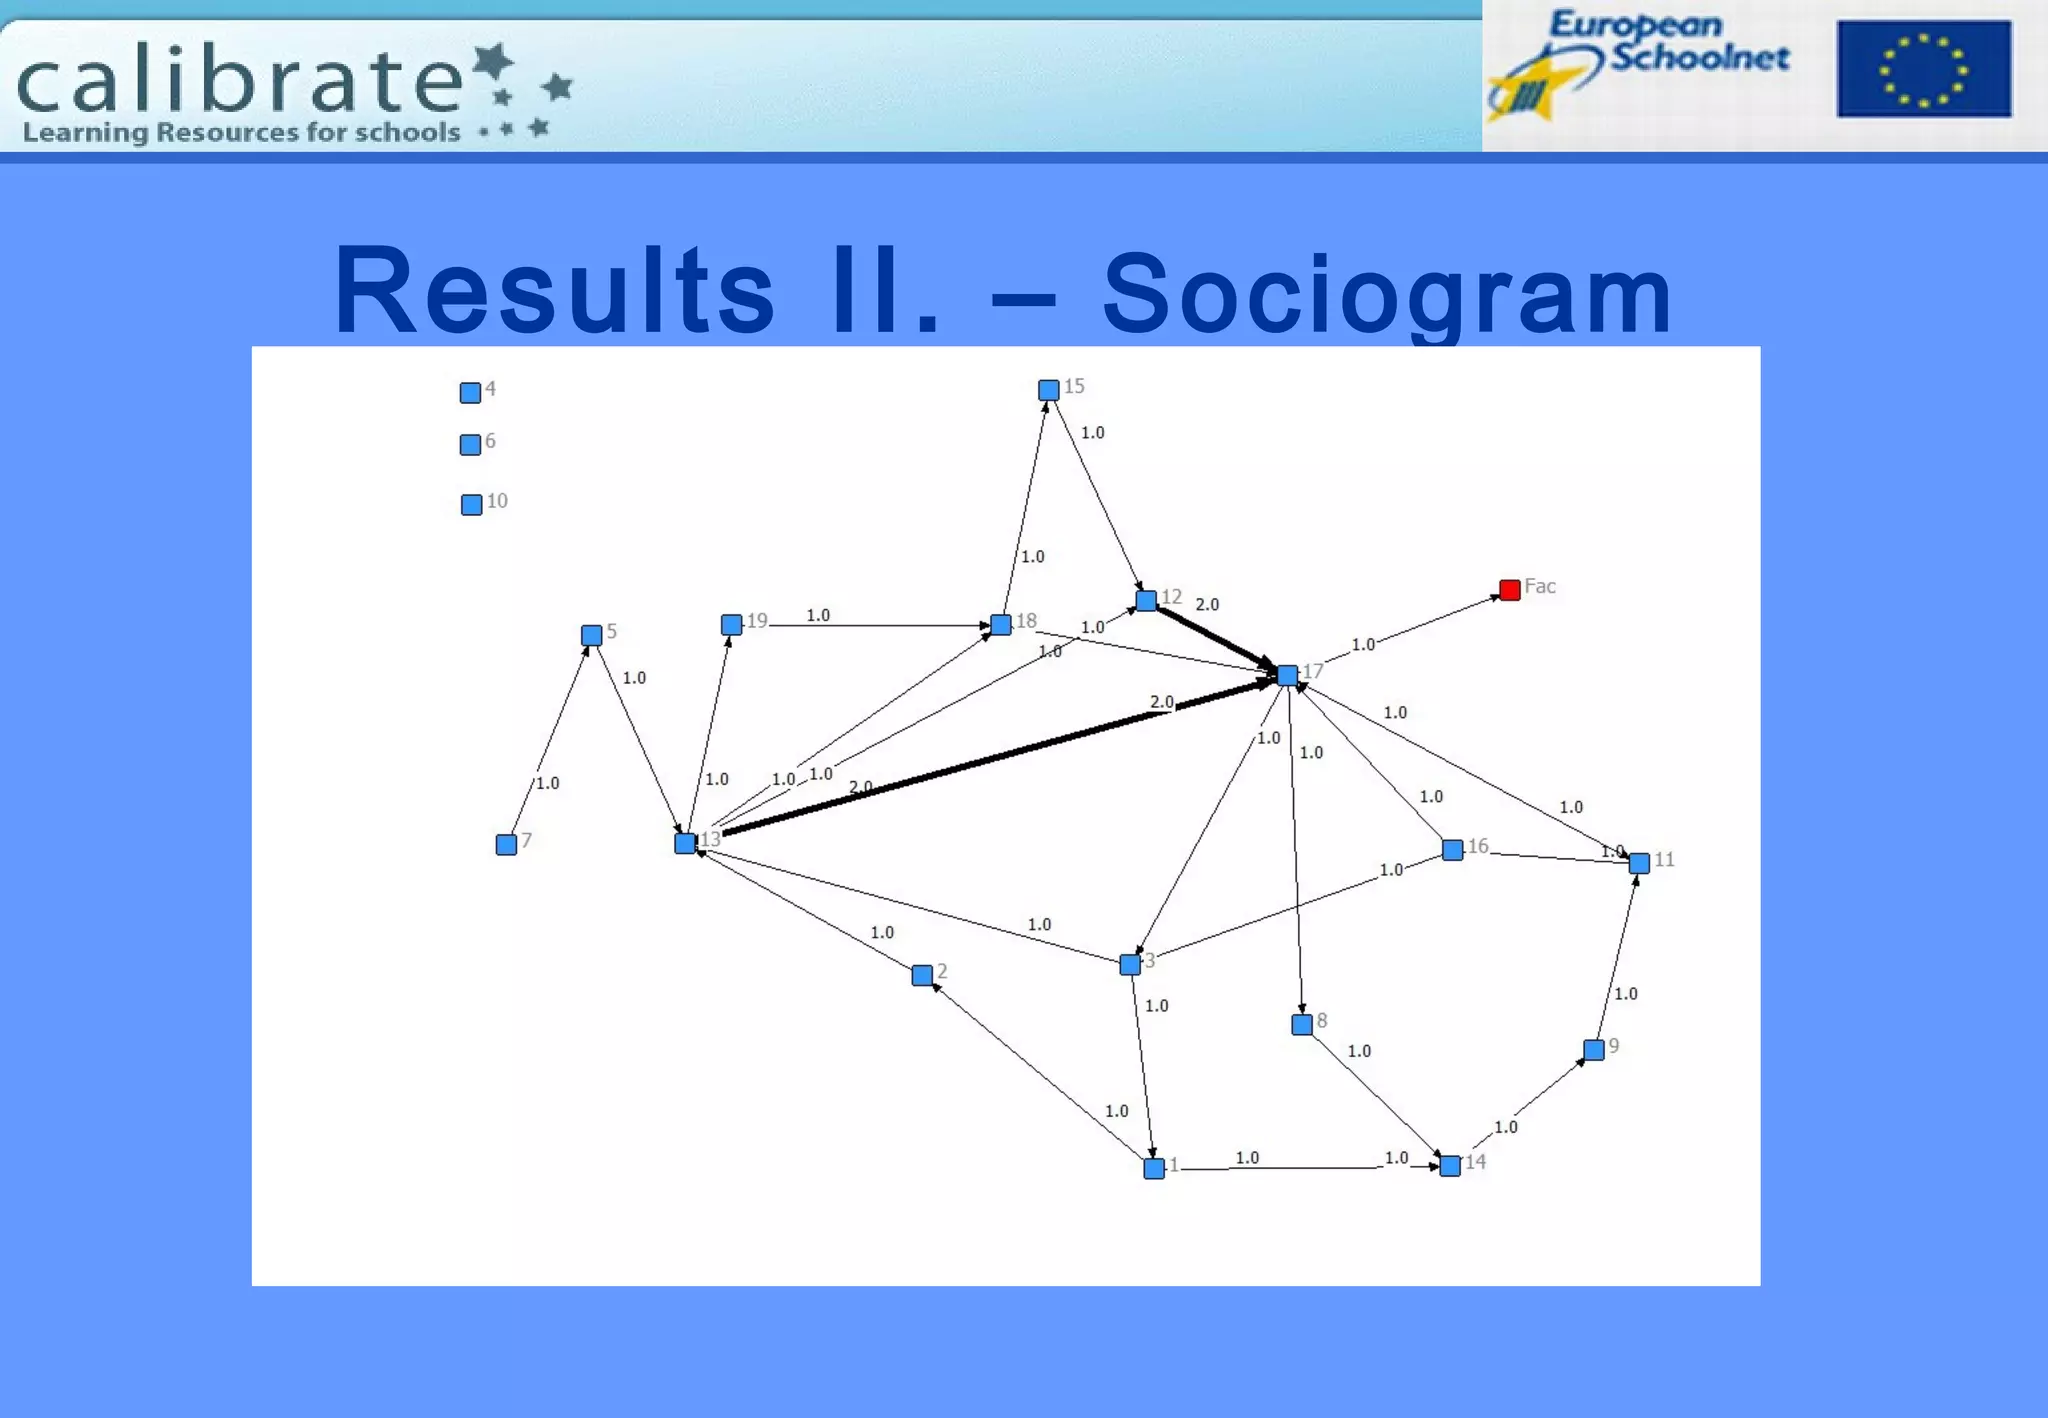
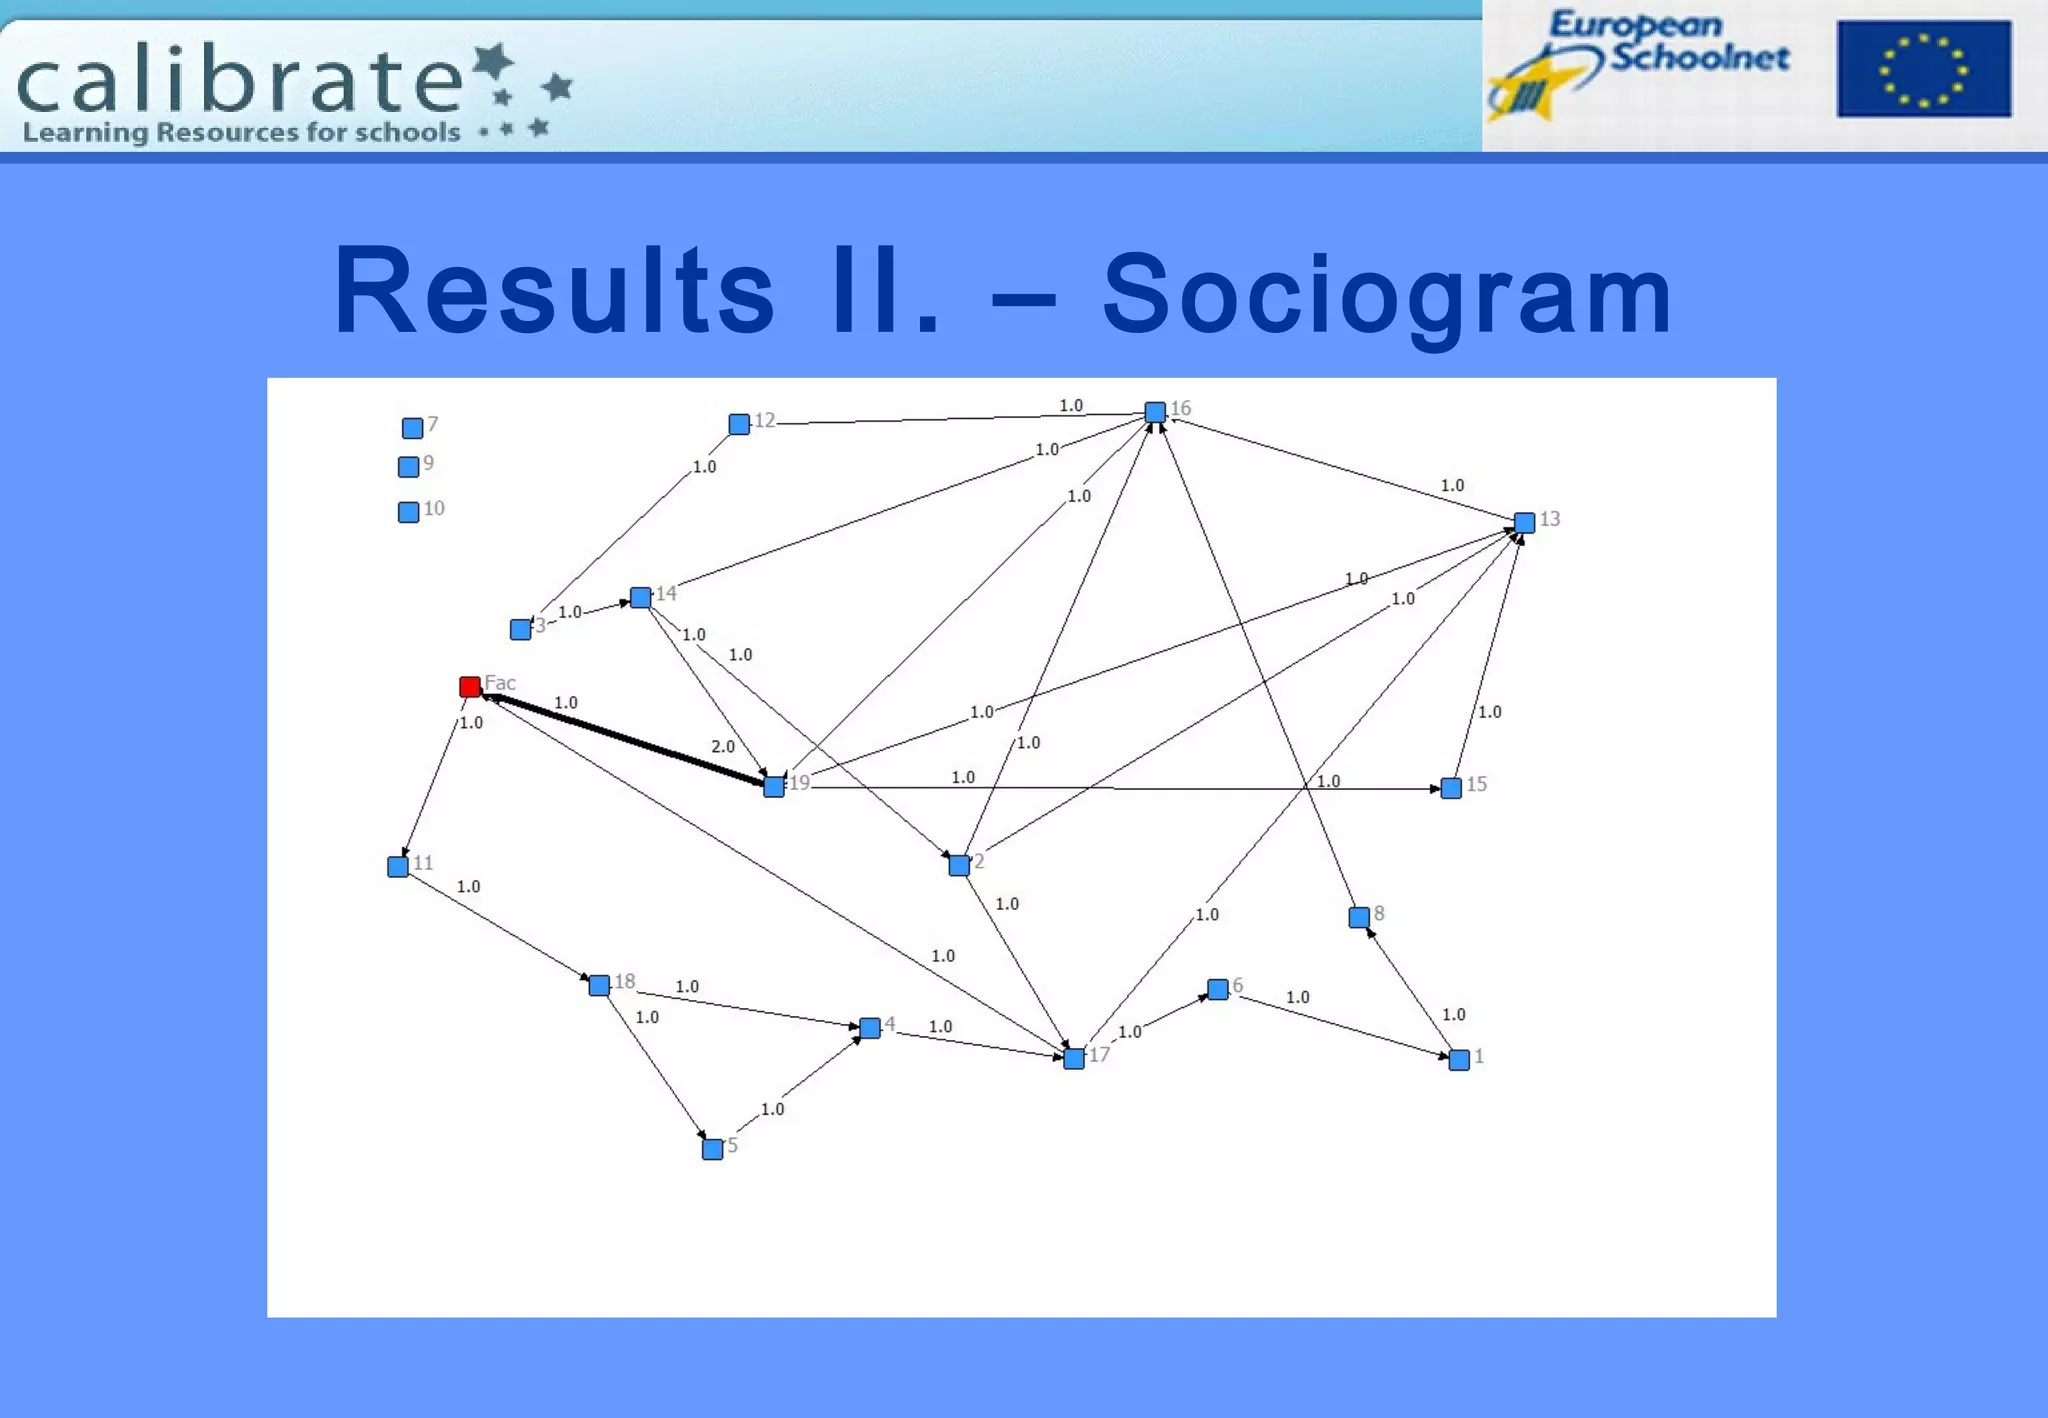
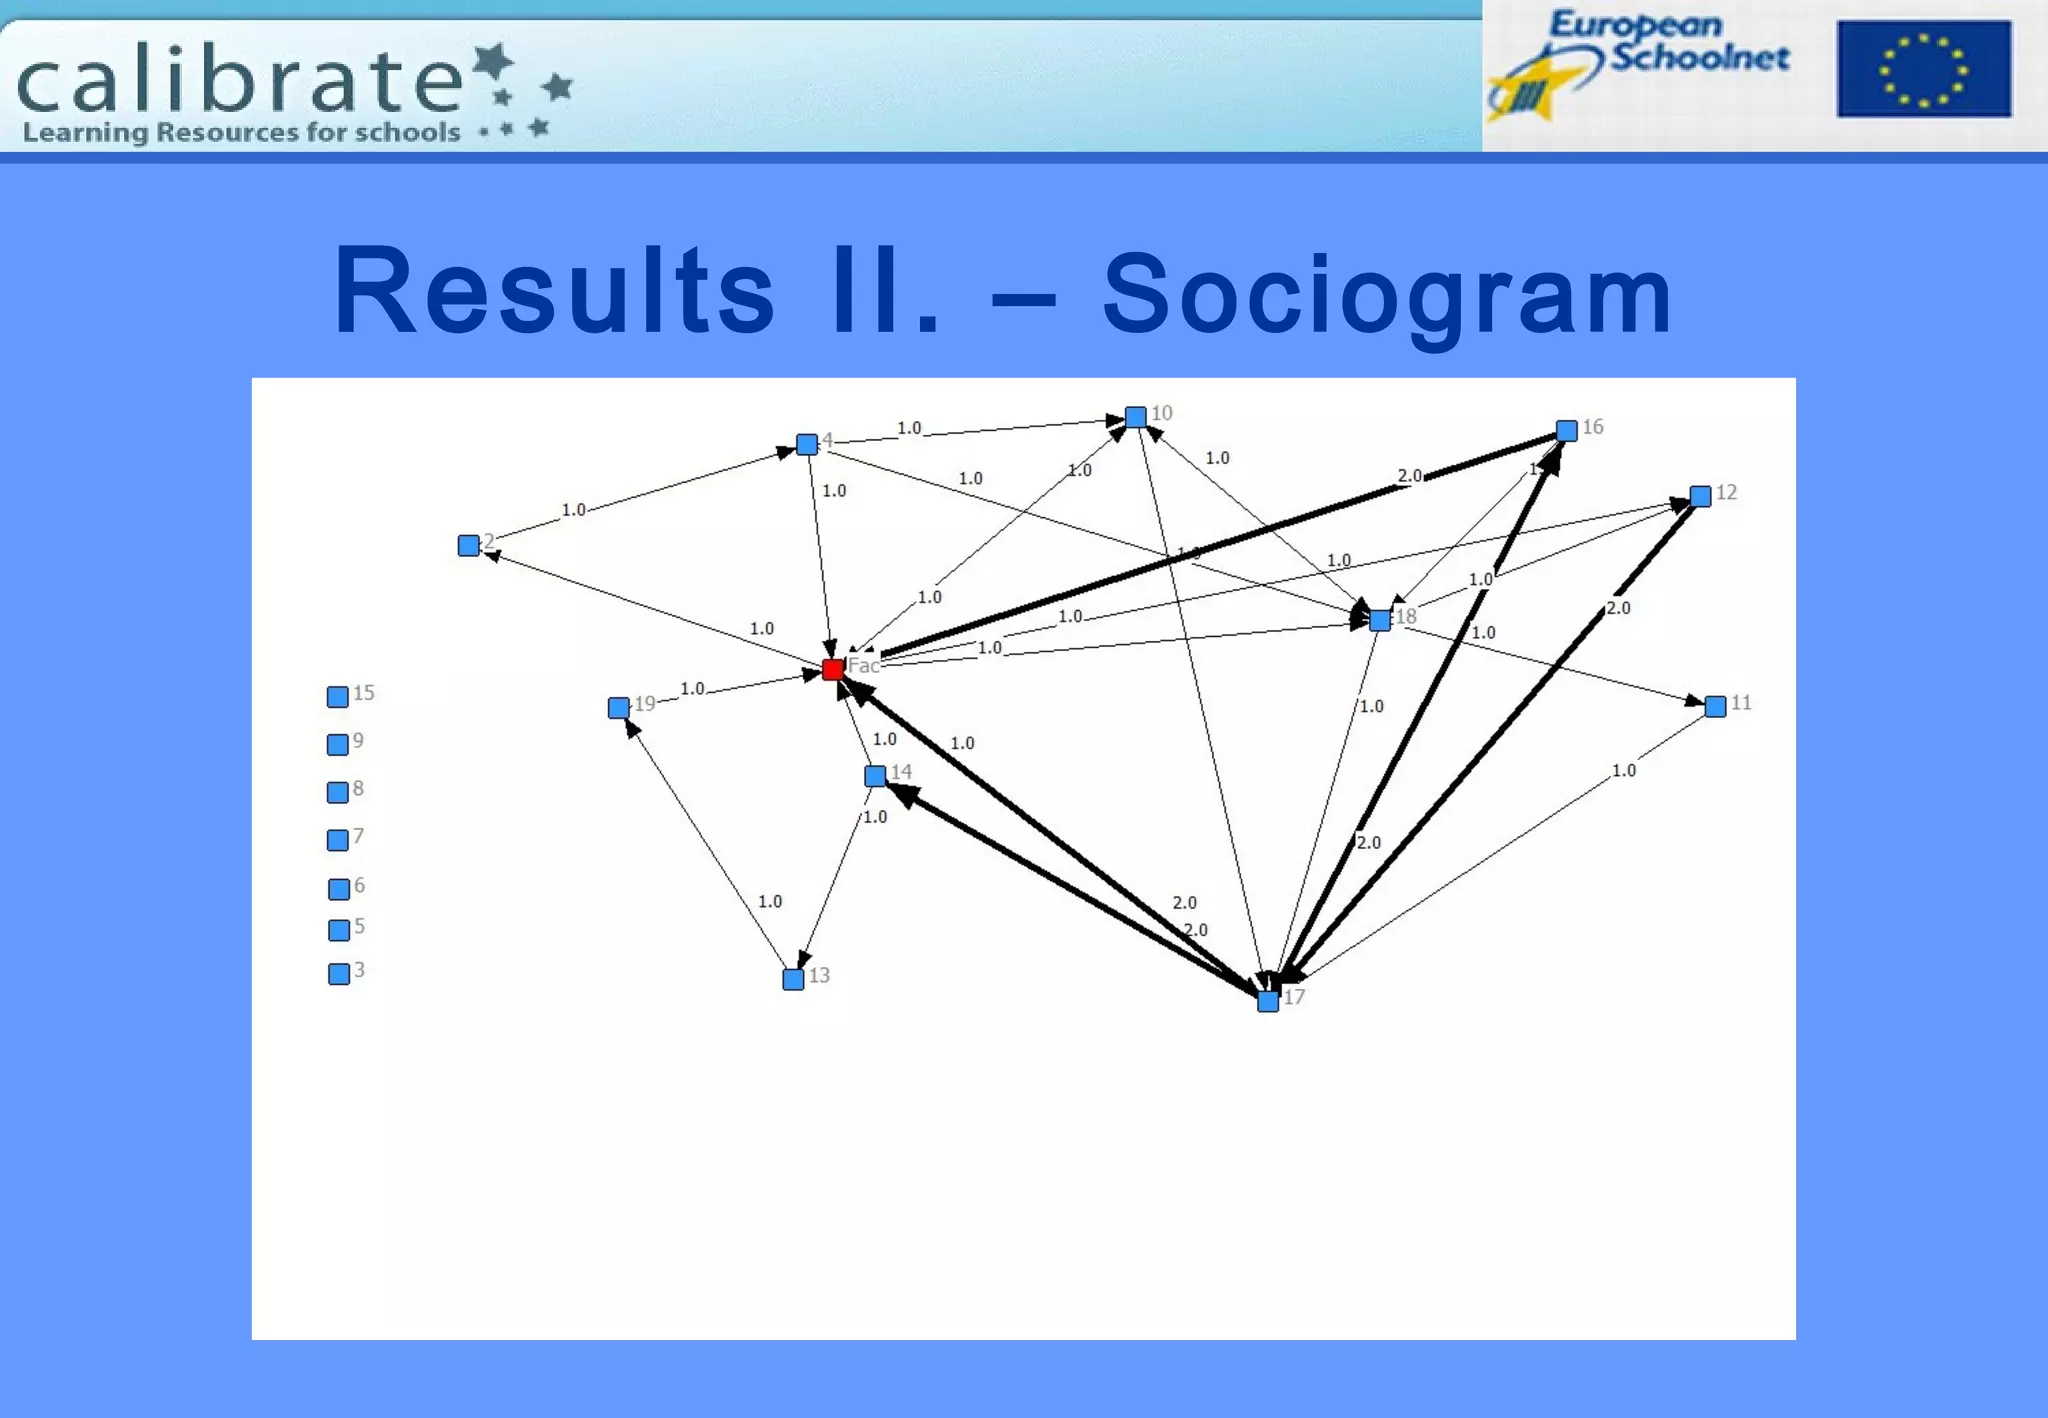
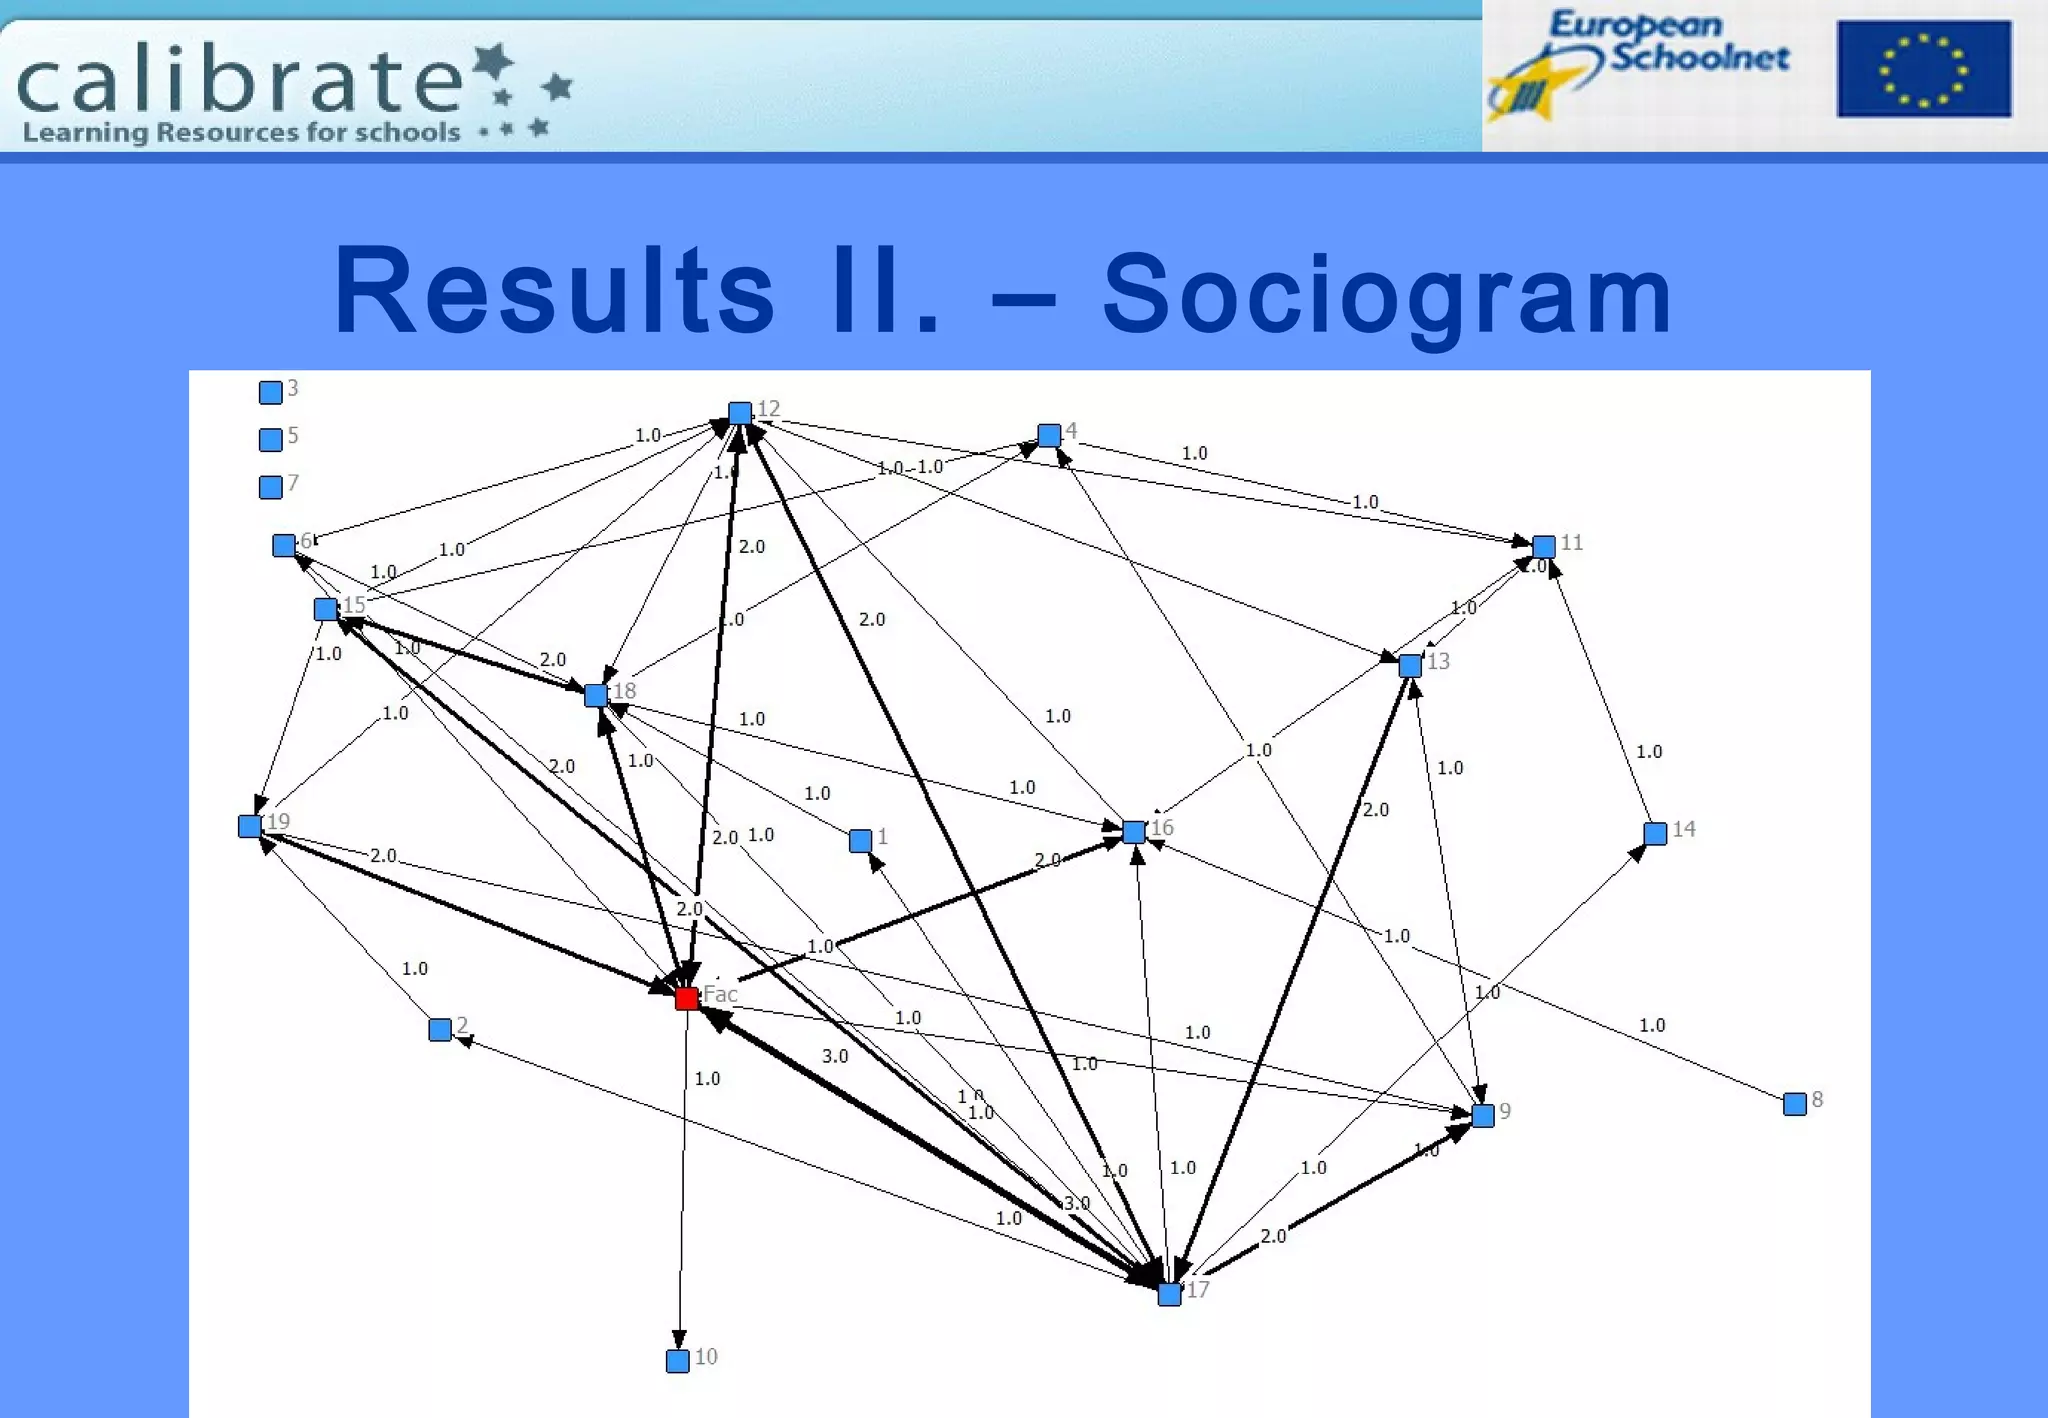
INVESTIGATING PATTERNS
OF INTERACTION IN THE
CALIBRATE PROJECT
THE USE OF SOCIAL
NETWORK ANALYSIS
Helga Dorner
Central European University
University of Szeged
Hungary
The CALIBRATE
Projecthttp://calibrate.eun.org
• Aim: creation of an international
digital learning repository
• adaptation / use of foreign digital learning
materials in English, Science, Maths and Arts 
the European Learning Resource Exchange
(LRE)
• 17 partners from the EU
• Duration of the project:
October 2005 – March 2008
The CALIBRATE Project
http://calibrate.eun.org/merlin/
The CALIBRATE LRE
portal
LeMill
www.lemill.net
Population – Phase One
Testing the repository and evaluating/creating
learning objects by in-service teachers (N=23)
Online collaboration via email and in the virtual
learning environment FLE3
Duration: March – May 2007
4 subject-specific groups Science (Biology,
Chemistry, Physics), Maths, English as a
Foreign Language
4 e-moderators/facilitators
Population – Phase Two
Testing the repository and evaluating/creating
learning objects by in-service teachers (N=20)
Online collaboration in the virtual learning
environment LeMill
Duration: October 2007 – January 2008
1 group of in-service teachers from the
fields of Science (Biology, Chemistry, Physics),
Maths, English as a Foreign Language
1 e-moderator/facilitator
e-Moderator (Salmon,
2000)
• „wearing 4 pairs of shoes” (Hootstein, 2002)
– Instructor role: consultation, guidance,
feedback
– Social director: scaffolding collaborative
learning, moderating group interactions
– Program manager: operative and
administrative tasks
– Technical assistant: solving technical
problems
Methodology
Quantitative
– Participant satisfaction and communication
questionnaire (Dorner, 2007)
Analysis of online activity
• Log file data
• Macro: Social Network Analysis
Qualitative
• Micro: Content analysis of interactions
Social Network Analysis
Analysis on the macro-level: This method
helps to understand and identify (and make
visible) the participatory patterns and
relationships that change in the complex
dynamics of online work.
As Wassermann & Faust (1997) put it, using
SNA, the social environment can be
mapped with relational data – all
information that cannot be reduced to the
properties of individuals themselves.
Social Network Analysis
Important values
1. Density
• provides a measure of the overall ‘connections’ between
the participants.
• is defined as the number of communicative links
observed in a network divided by the maximum number
of possible links (Scotts, 1991).
• It varies between 0 and 1. ‘0’ means that no links have
been created between the participants.
• The more participants are connected to one another the
higher will be the density value of the network (Scott,
1991).
Social Network Analysis
Important values:
2. Centrality
• provides information about the behaviour of
individual participants within a network.
• indicates the extent to which an individual
interacts with other members in the network
(Wasserman & Faust, 1997) – by measuring the
number of connections with the other members.
• Freeman’ s degree centrality used in practice
Social Network Analysis
• In the case of directed graphs
• in-degree: points directed towards i.e. number of responses
received Did
• out-degree: points to which it directs lines i.e. number of
messages sent Dod
Prestige: in-degree value is greater than the out-
degree value
Influence: out-degree value is greater than the in-
degree value
Social Network Analysis
• In the case of directed graphs
• in-degree: points directed towards i.e. number of responses
received Did
• out-degree: points to which it directs lines i.e. number of
messages sent Dod
• In-degree network centrality
• Out-degree network centrality
Research questions
Who are the participants?
Who are the most active/passive
participants? How does participants’ online
activity change during the collaboration?
How balanced is the participation?
How dense is the network? Does it change
during the collaboration?
What is the position of the online facilitator?
Results I. – Degree Centrality
Par
tici
pan
ts
Thread 1. Thread 2. Thread 3. Thread 4. Thread 5. Thread 6.
D Did
D
od
D Did
Dod
D D
i
d
D
o
d
D Did
Dod
D Did
Dod
D Did
Dod
M=3.
00
SD=1
.41
M=1.50
SD=0.70
M=1.
75
SD=0
.83
M=0.8
8
SD=0.
33
M=0.
88
SD=
0.59
M=1.
00
SD=
0.87
M=0.5
0
SD=0.5
0
M=1.
25
SD=
1.09
M=0.
62
SD=
0.69
M=0.
62
SD=
0.48
M=1
1.75
SD=
11.68
M=5.
88
SD=
5.84
M=5.
88
SD=
5.84
M=3.
00
SD=
3.74
M=1.
50
SD=
1.87
M=1.
50
SD=
1.87
Fac. 4 2 2 3 2 1 1 1 0 3 2 1 36 18 18 4 2 2
A 2 1 1 1 0 1 1 0 1 1 0 1 8 4 4 0 0 0
B 2 1 1 2 1 1 2 1 1 2 1 1 20 10 10 10 5 5
C 2 1 1 0 0 0 0 0 0 0 0 0 2 1 1 0 0 0
D 2 1 1 2 1 1 0 0 0 0 0 0 0 0 0 0 0 0
E 6 3 3 2 1 1 2 1 1 2 1 1 20 10 10 8 4 4
F 2 1 1 2 1 1 0 0 0 0 0 0 4 2 2 2 1 1
G 4 2 2 2 1 1 2 1 1 2 1 1 4 2 2 0 0 0
Results I. – Sociogram
Results I.– Network centrality
Threads Network
Centralization (%)
Network
centralization in-
degree (%)
Network
centralization out-
degree (%)
Density (%)
Thread 1. 47.62 24.49 24.49 21.4
Thread 2. 23.81 18.37 2.04 12.5
Thread 3. 19.05 8.16 8.16 7.1
Thread 4. 33.33 22.45 6.12 17.8
Thread 5. 33.33 24.74 24.74 32.1
Thread 6. 19.05 14.29 14.29 10.7
Discussion
Who are the most active/passive participants? How
does the participants’ online activity change
during the collaboration?
• Participants positioned on the periphery
are clearly identifiable - at different
stages of the collaboration usually the
same people
• Participants with prestige or influence are
clearly identifiable – based on in/out-
degree values (plus number of sent
messages)
Discussion
How balanced is the participation/online activity?
On the basis of the in/out-degree values,
the standard deviation and the in/out-
degree network centrality the balance of
online activity in a thread is clearly
describable.
The theme of the thread and the timing of
the discussions (beginning or end phase
of the learning process) has an effect on
the structure of the threads and the
balance of participant activity
(individual/group).
Discussion
How dense is the network? Does it change
during the collaboration?
Additionally to the density values the
number of binary ties is relevant.
This, however, is dependent on the
type of communication tool i.e.
interaction exclusively in a tree-
format.
Discussion
What is the position of the online facilitator?
The role/position of the facilitator changed
during the process i.e. it followed the
actual “tendencies” within the
interactions.
Member with prestige (receives and
evaluates comments) – Member with
influence (pushes others, distributes
information) – Observer on the periphery.
Results II. – Degree centrality
Partici
pants
Thread 1. Thread 2. Thread 3. Thread 4. Thread 5.
D Did
Dod
D Did
Dod
D Did
Do
d
D Did
Dod
D Did
Dod
M=3.1
SD=2.43
M=1.5
5SD=
1.24
M=1.55
SD=1.20
M=3.30
SD=3.26
M=1.65
SD=1.52
M=1.65
SD=1.77
M=3.00
SD=2.10
M=1.50
SD=1.07
M=3.20
SD=3.85
M=1.6
0SD=2.
13
M=1.60
SD=1.80
M=6.50
SD=6.50
M=5.88
SD=5.84
M=5.88
SD=5.84
Fac. 8 4 4 1 1 0 5 3 2 13 8 5 21 11 10
1 2 1 1 4 2 2 2 1 1 0 0 0 2 1 1
2 3 1 2 2 1 1 4 2 2 2 1 1 2 1 1
3 2 1 1 4 2 2 2 1 1 0 0 0 0 0 0
4 0 0 0 0 0 0 3 1 2 4 1 3 4 2 2
5 2 1 1 2 1 1 2 1 1 0 0 0 0 0 0
6 0 0 0 0 0 0 2 1 1 0 0 0 4 2 2
7 0 0 0 1 1 0 0 0 0 0 0 0 0 0 0
8 0 0 0 2 1 1 2 1 1 0 0 0 1 0 1
9 4 2 2 2 1 1 0 0 0 0 0 0 8 4 4
10 0 0 0 0 0 0 0 0 0 6 3 3 1 1 0
11 4 2 2 4 2 2 2 1 1 2 1 1 6 3 3
12 4 2 2 5 2 3 2 1 1 4 2 2 14 7 7
13 4 2 2 11 6 5 6 3 3 2 1 1 6 3 3
14 2 1 1 4 2 2 4 2 2 4 2 2 2 1 1
15 4 2 2 2 1 1 2 1 1 0 0 0 8 4 4
16 5 3 2 3 1 2 6 3 3 5 2 3 10 5 5
17 6 3 3 13 7 6 5 2 3 12 6 6 23 11 12
18 4 2 2 4 2 2 3 1 2 8 4 4 12 6 6
19 8 4 4 2 1 1 8 4 4 2 1 1 6 3 3
Results II.– Network centrality
Threads Network
Centralization (%)
Network
centralization in-
degree (%)
Network
centralization out-
degree (%)
Density (%)
Thread 1. 11.99 6.79 6.79 7.6
Thread 2. 21.05 14.82 12.05 7.8
Thread 3. 9.36 6.93 6.93 7.6
Thread 4. 23.68 17.73 12.19 7.1
Thread 5. 23 14.31 16.16 13.4
Results II. – Sociogram
dornerh@ceu.hu
helgadorner@t-online.hu

Dorner Helga: INVESTIGATING PATTERNS OF INTERACTION IN THE CALIBRATE PROJECT

  • 1.
    INVESTIGATING PATTERNS OF INTERACTIONIN THE CALIBRATE PROJECT THE USE OF SOCIAL NETWORK ANALYSIS Helga Dorner Central European University University of Szeged Hungary
  • 2.
    The CALIBRATE Projecthttp://calibrate.eun.org • Aim:creation of an international digital learning repository • adaptation / use of foreign digital learning materials in English, Science, Maths and Arts  the European Learning Resource Exchange (LRE) • 17 partners from the EU • Duration of the project: October 2005 – March 2008
  • 3.
  • 4.
  • 5.
  • 6.
    Population – PhaseOne Testing the repository and evaluating/creating learning objects by in-service teachers (N=23) Online collaboration via email and in the virtual learning environment FLE3 Duration: March – May 2007 4 subject-specific groups Science (Biology, Chemistry, Physics), Maths, English as a Foreign Language 4 e-moderators/facilitators
  • 7.
    Population – PhaseTwo Testing the repository and evaluating/creating learning objects by in-service teachers (N=20) Online collaboration in the virtual learning environment LeMill Duration: October 2007 – January 2008 1 group of in-service teachers from the fields of Science (Biology, Chemistry, Physics), Maths, English as a Foreign Language 1 e-moderator/facilitator
  • 8.
    e-Moderator (Salmon, 2000) • „wearing4 pairs of shoes” (Hootstein, 2002) – Instructor role: consultation, guidance, feedback – Social director: scaffolding collaborative learning, moderating group interactions – Program manager: operative and administrative tasks – Technical assistant: solving technical problems
  • 9.
    Methodology Quantitative – Participant satisfactionand communication questionnaire (Dorner, 2007) Analysis of online activity • Log file data • Macro: Social Network Analysis Qualitative • Micro: Content analysis of interactions
  • 10.
    Social Network Analysis Analysison the macro-level: This method helps to understand and identify (and make visible) the participatory patterns and relationships that change in the complex dynamics of online work. As Wassermann & Faust (1997) put it, using SNA, the social environment can be mapped with relational data – all information that cannot be reduced to the properties of individuals themselves.
  • 11.
    Social Network Analysis Importantvalues 1. Density • provides a measure of the overall ‘connections’ between the participants. • is defined as the number of communicative links observed in a network divided by the maximum number of possible links (Scotts, 1991). • It varies between 0 and 1. ‘0’ means that no links have been created between the participants. • The more participants are connected to one another the higher will be the density value of the network (Scott, 1991).
  • 12.
    Social Network Analysis Importantvalues: 2. Centrality • provides information about the behaviour of individual participants within a network. • indicates the extent to which an individual interacts with other members in the network (Wasserman & Faust, 1997) – by measuring the number of connections with the other members. • Freeman’ s degree centrality used in practice
  • 13.
    Social Network Analysis •In the case of directed graphs • in-degree: points directed towards i.e. number of responses received Did • out-degree: points to which it directs lines i.e. number of messages sent Dod Prestige: in-degree value is greater than the out- degree value Influence: out-degree value is greater than the in- degree value
  • 14.
    Social Network Analysis •In the case of directed graphs • in-degree: points directed towards i.e. number of responses received Did • out-degree: points to which it directs lines i.e. number of messages sent Dod • In-degree network centrality • Out-degree network centrality
  • 15.
    Research questions Who arethe participants? Who are the most active/passive participants? How does participants’ online activity change during the collaboration? How balanced is the participation? How dense is the network? Does it change during the collaboration? What is the position of the online facilitator?
  • 16.
    Results I. –Degree Centrality Par tici pan ts Thread 1. Thread 2. Thread 3. Thread 4. Thread 5. Thread 6. D Did D od D Did Dod D D i d D o d D Did Dod D Did Dod D Did Dod M=3. 00 SD=1 .41 M=1.50 SD=0.70 M=1. 75 SD=0 .83 M=0.8 8 SD=0. 33 M=0. 88 SD= 0.59 M=1. 00 SD= 0.87 M=0.5 0 SD=0.5 0 M=1. 25 SD= 1.09 M=0. 62 SD= 0.69 M=0. 62 SD= 0.48 M=1 1.75 SD= 11.68 M=5. 88 SD= 5.84 M=5. 88 SD= 5.84 M=3. 00 SD= 3.74 M=1. 50 SD= 1.87 M=1. 50 SD= 1.87 Fac. 4 2 2 3 2 1 1 1 0 3 2 1 36 18 18 4 2 2 A 2 1 1 1 0 1 1 0 1 1 0 1 8 4 4 0 0 0 B 2 1 1 2 1 1 2 1 1 2 1 1 20 10 10 10 5 5 C 2 1 1 0 0 0 0 0 0 0 0 0 2 1 1 0 0 0 D 2 1 1 2 1 1 0 0 0 0 0 0 0 0 0 0 0 0 E 6 3 3 2 1 1 2 1 1 2 1 1 20 10 10 8 4 4 F 2 1 1 2 1 1 0 0 0 0 0 0 4 2 2 2 1 1 G 4 2 2 2 1 1 2 1 1 2 1 1 4 2 2 0 0 0
  • 17.
    Results I. –Sociogram
  • 18.
    Results I. –Sociogram
  • 19.
    Results I.– Networkcentrality Threads Network Centralization (%) Network centralization in- degree (%) Network centralization out- degree (%) Density (%) Thread 1. 47.62 24.49 24.49 21.4 Thread 2. 23.81 18.37 2.04 12.5 Thread 3. 19.05 8.16 8.16 7.1 Thread 4. 33.33 22.45 6.12 17.8 Thread 5. 33.33 24.74 24.74 32.1 Thread 6. 19.05 14.29 14.29 10.7
  • 20.
    Discussion Who are themost active/passive participants? How does the participants’ online activity change during the collaboration? • Participants positioned on the periphery are clearly identifiable - at different stages of the collaboration usually the same people • Participants with prestige or influence are clearly identifiable – based on in/out- degree values (plus number of sent messages)
  • 21.
    Discussion How balanced isthe participation/online activity? On the basis of the in/out-degree values, the standard deviation and the in/out- degree network centrality the balance of online activity in a thread is clearly describable. The theme of the thread and the timing of the discussions (beginning or end phase of the learning process) has an effect on the structure of the threads and the balance of participant activity (individual/group).
  • 22.
    Discussion How dense isthe network? Does it change during the collaboration? Additionally to the density values the number of binary ties is relevant. This, however, is dependent on the type of communication tool i.e. interaction exclusively in a tree- format.
  • 23.
    Discussion What is theposition of the online facilitator? The role/position of the facilitator changed during the process i.e. it followed the actual “tendencies” within the interactions. Member with prestige (receives and evaluates comments) – Member with influence (pushes others, distributes information) – Observer on the periphery.
  • 24.
    Results II. –Degree centrality Partici pants Thread 1. Thread 2. Thread 3. Thread 4. Thread 5. D Did Dod D Did Dod D Did Do d D Did Dod D Did Dod M=3.1 SD=2.43 M=1.5 5SD= 1.24 M=1.55 SD=1.20 M=3.30 SD=3.26 M=1.65 SD=1.52 M=1.65 SD=1.77 M=3.00 SD=2.10 M=1.50 SD=1.07 M=3.20 SD=3.85 M=1.6 0SD=2. 13 M=1.60 SD=1.80 M=6.50 SD=6.50 M=5.88 SD=5.84 M=5.88 SD=5.84 Fac. 8 4 4 1 1 0 5 3 2 13 8 5 21 11 10 1 2 1 1 4 2 2 2 1 1 0 0 0 2 1 1 2 3 1 2 2 1 1 4 2 2 2 1 1 2 1 1 3 2 1 1 4 2 2 2 1 1 0 0 0 0 0 0 4 0 0 0 0 0 0 3 1 2 4 1 3 4 2 2 5 2 1 1 2 1 1 2 1 1 0 0 0 0 0 0 6 0 0 0 0 0 0 2 1 1 0 0 0 4 2 2 7 0 0 0 1 1 0 0 0 0 0 0 0 0 0 0 8 0 0 0 2 1 1 2 1 1 0 0 0 1 0 1 9 4 2 2 2 1 1 0 0 0 0 0 0 8 4 4 10 0 0 0 0 0 0 0 0 0 6 3 3 1 1 0 11 4 2 2 4 2 2 2 1 1 2 1 1 6 3 3 12 4 2 2 5 2 3 2 1 1 4 2 2 14 7 7 13 4 2 2 11 6 5 6 3 3 2 1 1 6 3 3 14 2 1 1 4 2 2 4 2 2 4 2 2 2 1 1 15 4 2 2 2 1 1 2 1 1 0 0 0 8 4 4 16 5 3 2 3 1 2 6 3 3 5 2 3 10 5 5 17 6 3 3 13 7 6 5 2 3 12 6 6 23 11 12 18 4 2 2 4 2 2 3 1 2 8 4 4 12 6 6 19 8 4 4 2 1 1 8 4 4 2 1 1 6 3 3
  • 25.
    Results II.– Networkcentrality Threads Network Centralization (%) Network centralization in- degree (%) Network centralization out- degree (%) Density (%) Thread 1. 11.99 6.79 6.79 7.6 Thread 2. 21.05 14.82 12.05 7.8 Thread 3. 9.36 6.93 6.93 7.6 Thread 4. 23.68 17.73 12.19 7.1 Thread 5. 23 14.31 16.16 13.4
  • 26.
    Results II. –Sociogram
  • 27.
    Results II. –Sociogram
  • 28.
    Results II. –Sociogram
  • 29.
    Results II. –Sociogram
  • 30.
    Results II. –Sociogram
  • 31.