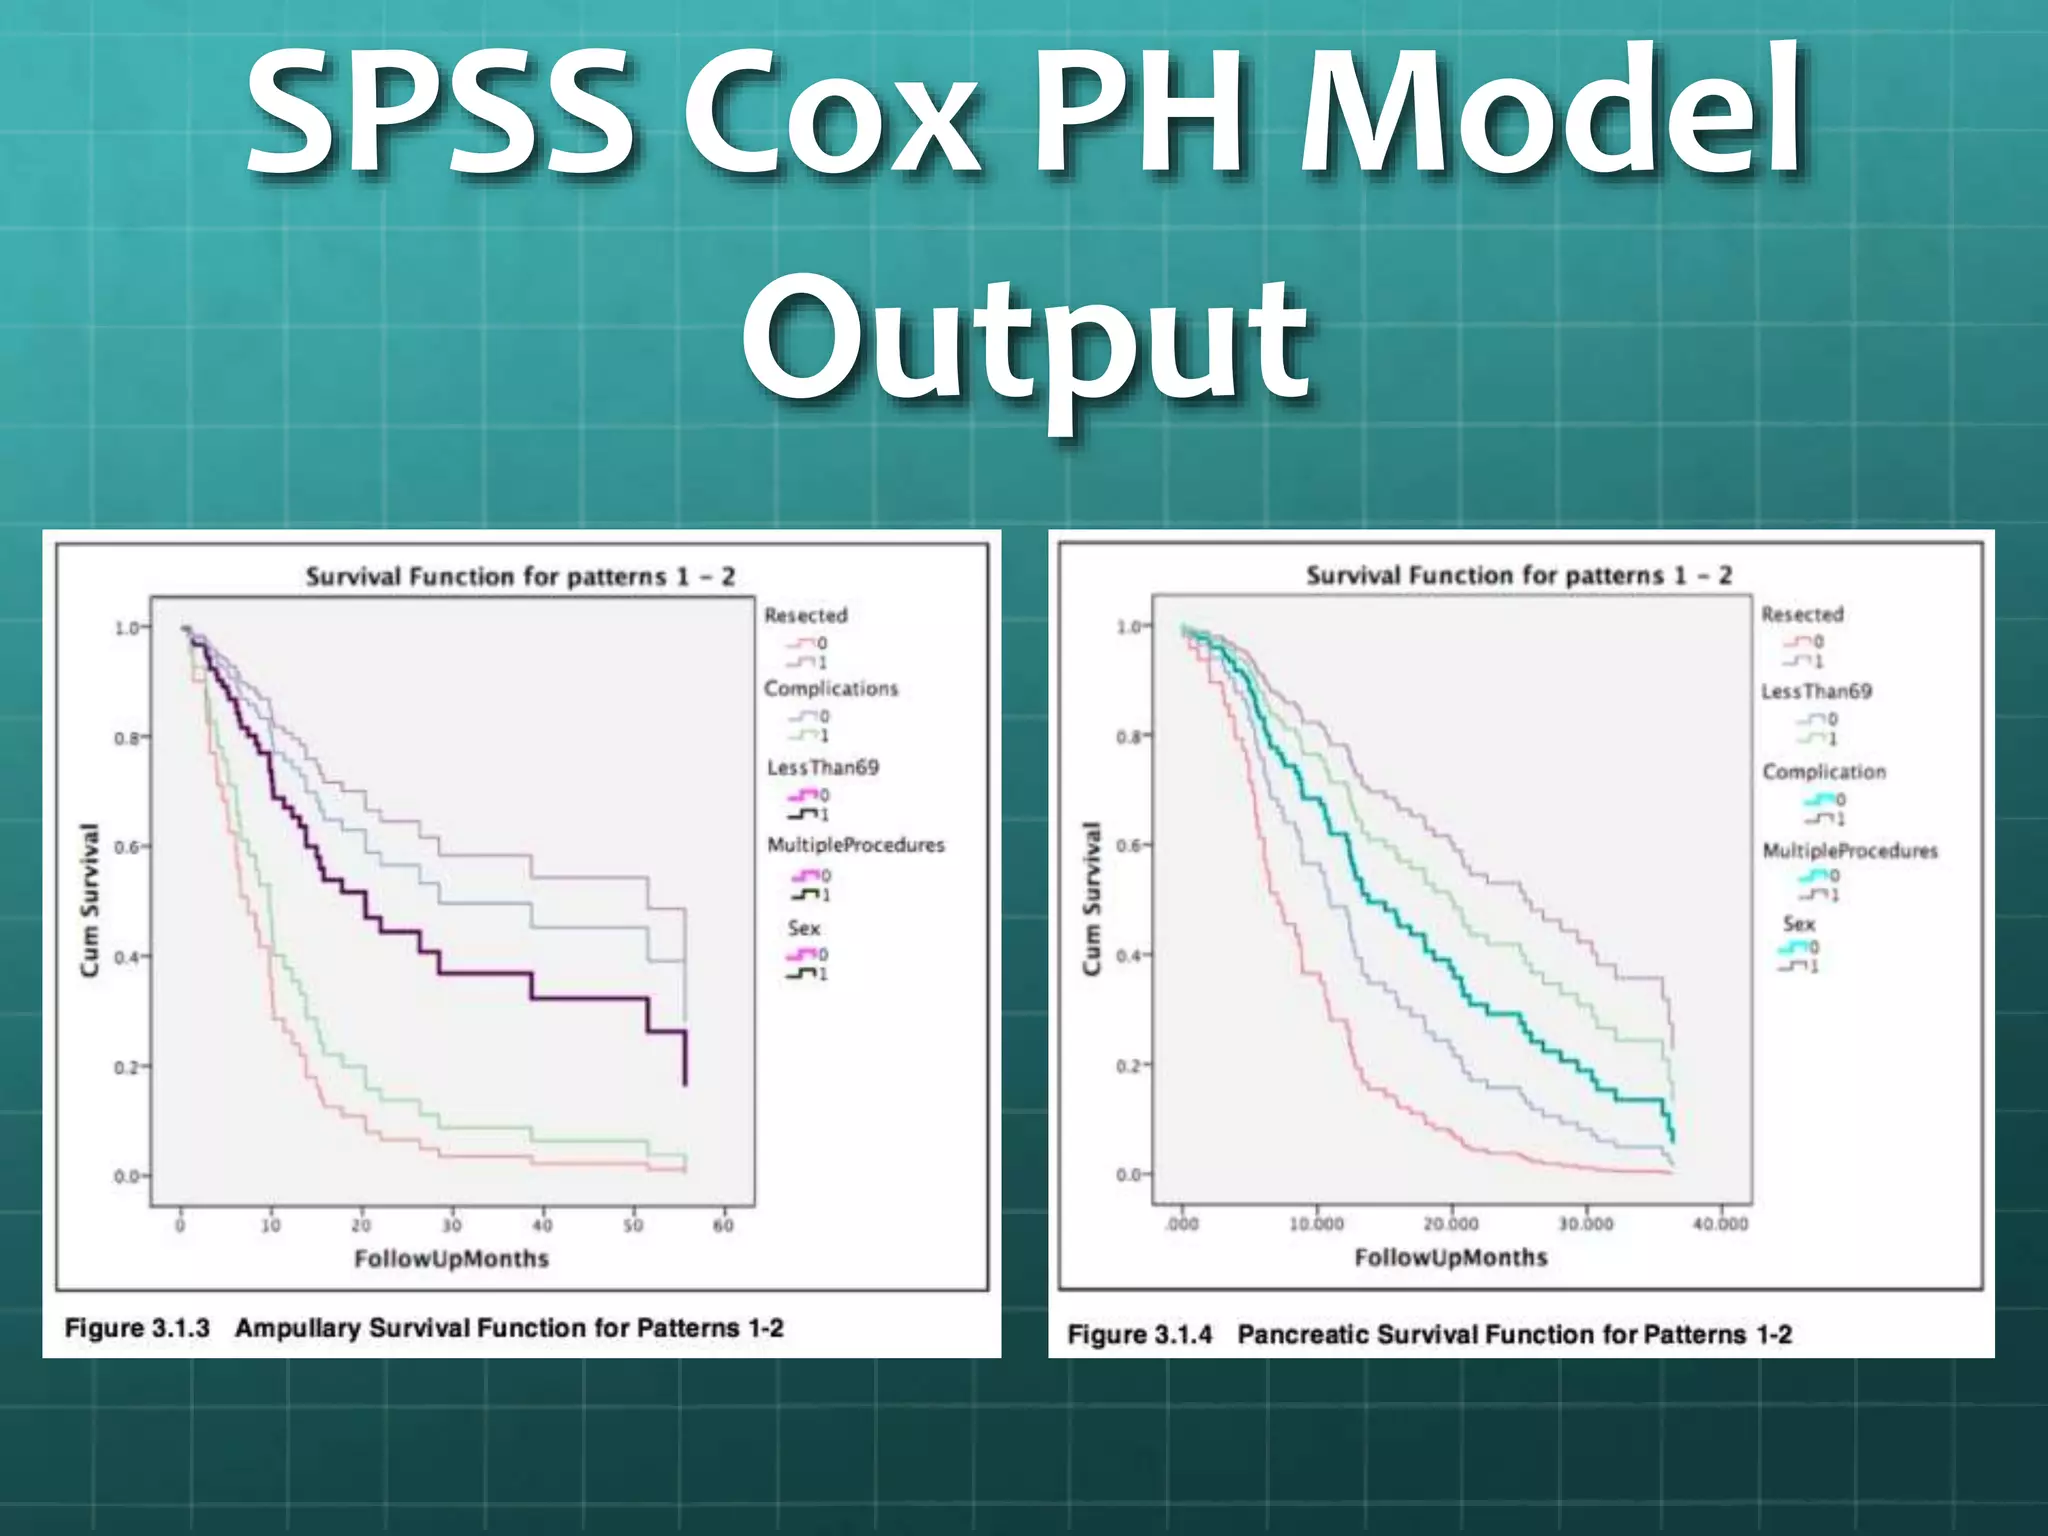
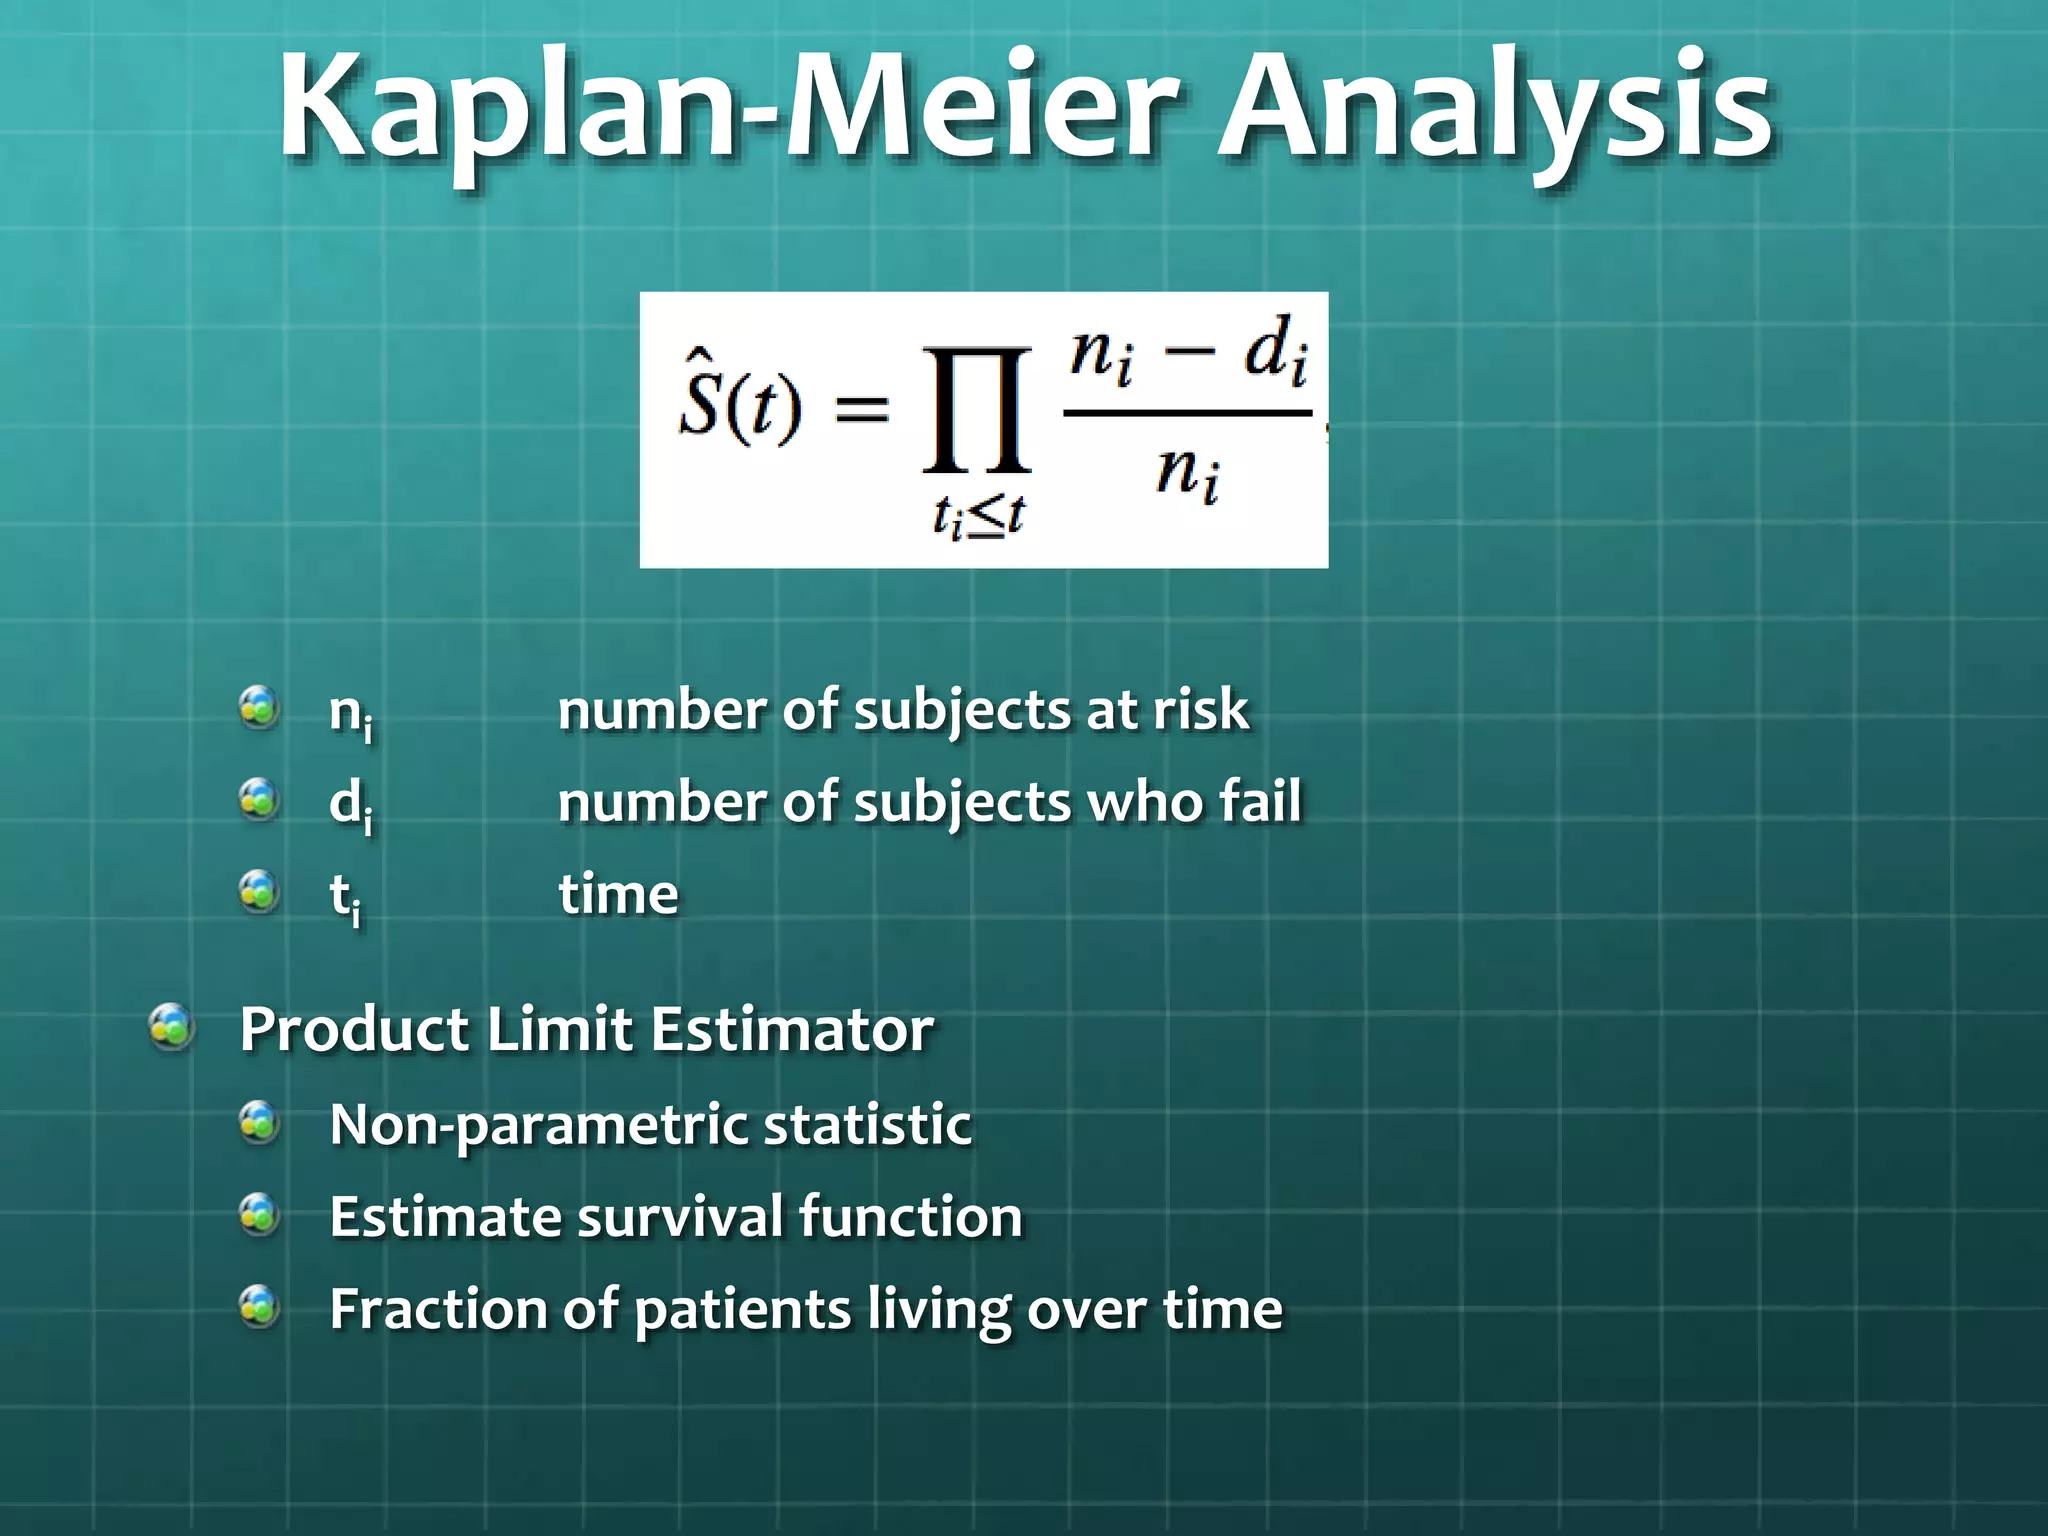
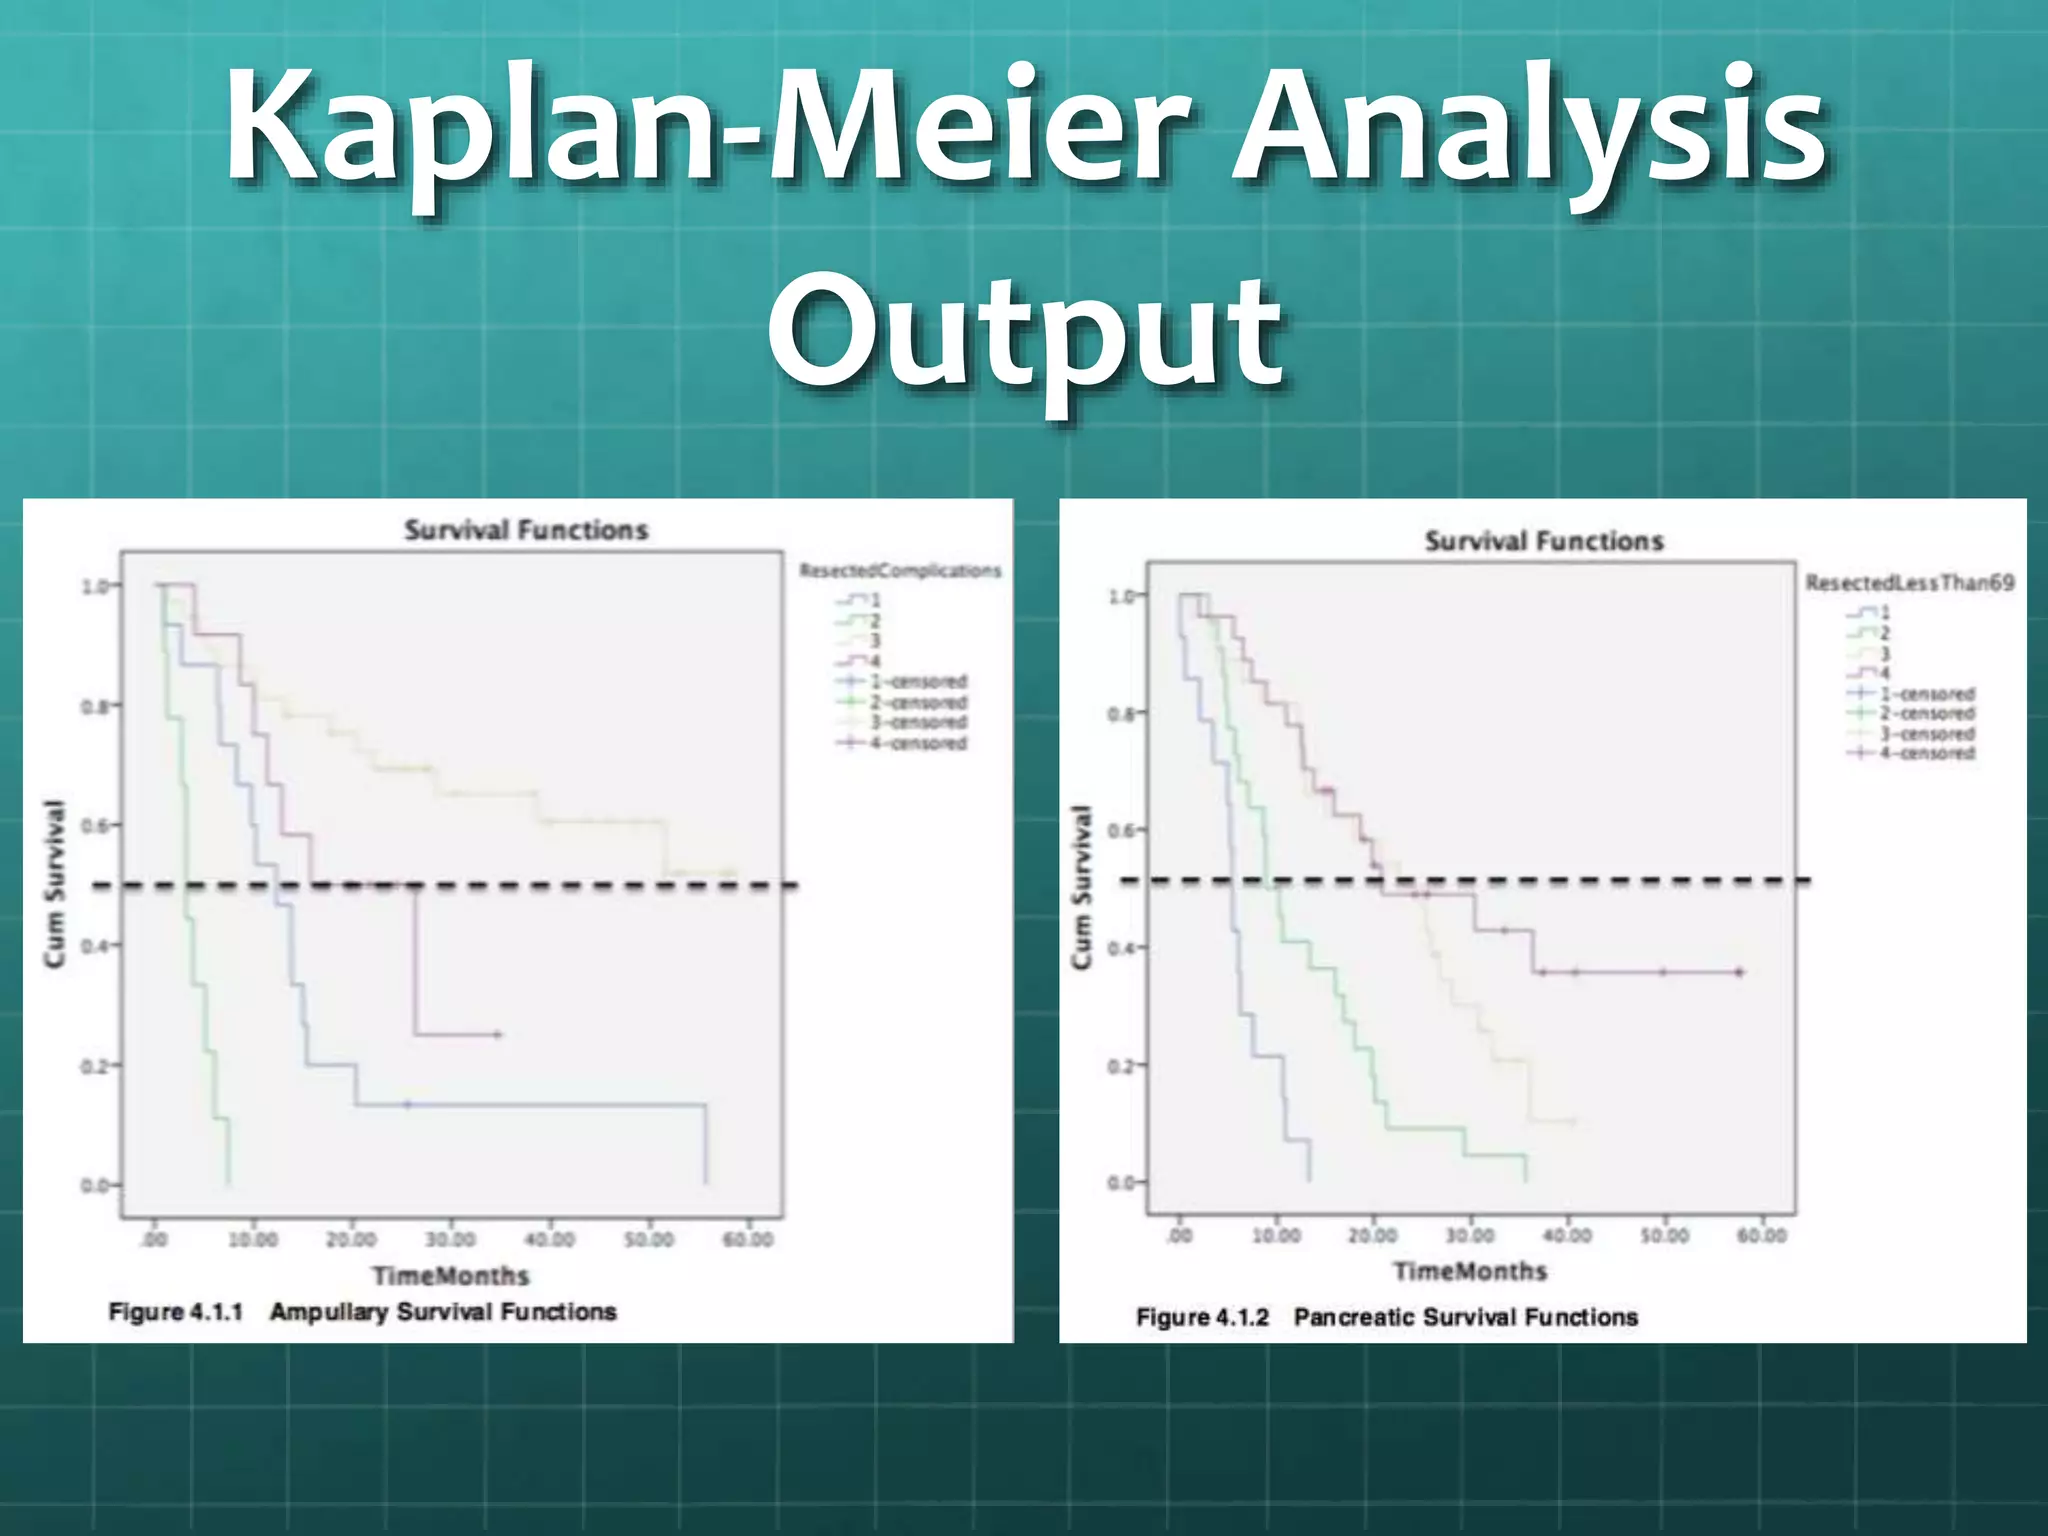
Mortality Rates of
Cancer Patients
Priya Herian 1011944
BSc (Hons) Mathematics
University of Wolverhampton
Supervisor: Ruth Fairclough
Principle Lecturer Mathematics
Faculty of Science and Engineering
Abstract
Aim
Mortality rates of patients affected by variables
Acceptance or Rejection of the null-hypothesis
Method
SPSS Software
Cox Proportional Hazard Model
Kaplan-Meier Analysis
Results
Ampullary Cancer affected by “resected” and “complications”
Pancreatic Cancer affected by “resected” and “less than 69”
Conclusion
Rejection of null-hypothesis
Confirmation using Kaplan-Meier Analysis
Overview of Cancer
Genes change
Cells grow excessively
and multiple too fast
Over 200 types of cancer
Ampullary Cancer Facts
Figure 1.1 Age-standardised incidence rates of Ampulla of Vater cancer per 100’000 European
population (ASR(E)) by Gender and Year of diagnosis
Pancreatic Cancer Facts
5th most common cause of
cancer death in men
4th most common cause of
cancer death in women
More common in women
than men
Half of all deaths are in 75
years and over
Cox Proportional Hazard
Model (Cox PH Model)
Various variables upon the time a specified event
takes to happen
Estimate of treatment effect on survival
t = time X = predictor variables H0 = null hypothesis
Assumes the time to an event is defined by a hazard function
Creation of baseline hazard function, independent of
exponential function
Baseline Hazard defines the shape of hazard function
Assumptions & Decisions
SPSS
Clear
Accurate
Hypothesis
H0 : The mortality rates of cancer patients are not affected by
the following variables: resected, less than 69, multiple
procedures and complications
H1 : At least one variable has an impact on the mortality rates of
cancer patients
Forward Stepwise Function within SPSS
SPSS Cox PH Model
Output
Kaplan-Meier Analysis
ni number of subjects at risk
di number of subjects who fail
ti time
Product Limit Estimator
Non-parametric statistic
Estimate survival function
Fraction of patients living over time
Kaplan-Meier Assumptions
Ampullary Cancer
Not Resected with No Complications = 1
Not Resected with Complications = 2
Resected with No Complications = 3
Resected with Complications = 4
Pancreatic Cancer
Not Resected and being 69 or older = 1
Not Resected and being less than 69 = 2
Resected and being 69 or older = 3
Resected and being less than 69 = 4
Kaplan-Meier Analysis
Output
Conclusion & Critical Evaluation
20.053% difference
Ampullary cancer – higher survival rate
Hypothesis
Null hypothesis is rejected
No measurable difference between gender and multiple
procedures
Further Work
Extending data amount
Computer Software Packages
Survival Analysis Methods
Literature Review
disseration presentation

disseration presentation

  • 1.
    Mortality Rates of CancerPatients Priya Herian 1011944 BSc (Hons) Mathematics University of Wolverhampton Supervisor: Ruth Fairclough Principle Lecturer Mathematics Faculty of Science and Engineering
  • 2.
    Abstract Aim Mortality rates ofpatients affected by variables Acceptance or Rejection of the null-hypothesis Method SPSS Software Cox Proportional Hazard Model Kaplan-Meier Analysis Results Ampullary Cancer affected by “resected” and “complications” Pancreatic Cancer affected by “resected” and “less than 69” Conclusion Rejection of null-hypothesis Confirmation using Kaplan-Meier Analysis
  • 3.
    Overview of Cancer Geneschange Cells grow excessively and multiple too fast Over 200 types of cancer
  • 4.
    Ampullary Cancer Facts Figure1.1 Age-standardised incidence rates of Ampulla of Vater cancer per 100’000 European population (ASR(E)) by Gender and Year of diagnosis
  • 5.
    Pancreatic Cancer Facts 5thmost common cause of cancer death in men 4th most common cause of cancer death in women More common in women than men Half of all deaths are in 75 years and over
  • 6.
    Cox Proportional Hazard Model(Cox PH Model) Various variables upon the time a specified event takes to happen Estimate of treatment effect on survival t = time X = predictor variables H0 = null hypothesis Assumes the time to an event is defined by a hazard function Creation of baseline hazard function, independent of exponential function Baseline Hazard defines the shape of hazard function
  • 7.
    Assumptions & Decisions SPSS Clear Accurate Hypothesis H0: The mortality rates of cancer patients are not affected by the following variables: resected, less than 69, multiple procedures and complications H1 : At least one variable has an impact on the mortality rates of cancer patients Forward Stepwise Function within SPSS
  • 8.
    SPSS Cox PHModel Output
  • 9.
    Kaplan-Meier Analysis ni numberof subjects at risk di number of subjects who fail ti time Product Limit Estimator Non-parametric statistic Estimate survival function Fraction of patients living over time
  • 10.
    Kaplan-Meier Assumptions Ampullary Cancer NotResected with No Complications = 1 Not Resected with Complications = 2 Resected with No Complications = 3 Resected with Complications = 4 Pancreatic Cancer Not Resected and being 69 or older = 1 Not Resected and being less than 69 = 2 Resected and being 69 or older = 3 Resected and being less than 69 = 4
  • 11.
  • 12.
    Conclusion & CriticalEvaluation 20.053% difference Ampullary cancer – higher survival rate Hypothesis Null hypothesis is rejected No measurable difference between gender and multiple procedures Further Work Extending data amount Computer Software Packages Survival Analysis Methods Literature Review

Editor's Notes

  • #3 Firstly, I would like to quickly take you through the abstract of my project. My aim within this dissertation was to see if the mortality rates of these patients were affected by any variable. Letting me either accept or reject the null-hypothesis. The method used, was within the software application SPSS. I produced a Cox PH Model and a Kaplan-Meier analysis on two types of cancer, ampullary and pancreatic. The results signified to me, within ampullary cancer, patients were affected by the variables “resected” and “complications” Whereas Pancreatic cancer patients were affected by the variables “resected” and “less than 69” To conclude my project, I rejected the null-hypothesis within the Cox PH Model, and this was confirmed by the Kaplan-Meier analysis which was carried out.
  • #4 So what is cancer? In short, cancer develops when genes anywhere within our body begin to change. This causes cells to grow rapidly and multiply. There are over 200 types of cancer that we know of to date. Here are two bar charts which I found from cancer research UK, showing the 10 most common cancers in both males and females.
  • #5 Lets look at a few cancer facts at both of the cancers I have looked at within my project. Ampullary cancer, is also known as Ampulla of Vater cancer and it is one of the rarest cancers around. According to the National Cancer Intelligence Network, ampullary cancer shows to be more common in males than females, as illustrated in the line graph behind me.
  • #6 Pancreatic cancer is more common and well known compared to ampullary cancer. It is the 5th most common cause of cancer deaths in men whilst it is the 4th most common in women. Referring back to more facts gathered from Cancer Research UK, the image on the slide shows it is more common in women than men, and half of all deaths are in patients 75 years or older.
  • #7 A Cox Proportional Hazard Model, sometimes noted as the Cox PH Model is used to investigate the various variables upon the time a specified event takes to happen. The model presents an estimate of a treatment effect on survival after familiarizing other explanatory variables. Here is the Cox PH Model formula: In this model, an expression is given for the hazard at time “t”, for someone with a given set of specified explanatory variables represented by X. “X” signifies a group of predictor variables. The proportional hazards’ model assumes that the time to an event is defined by a hazard function, which is a conceivable measure for the event to occur at a particular time “t”, given that the event did not yet occur. The hazard function is the creation of a baseline hazard function, independent of the exponential function describing, the effect of the covariates, and covariates themselves.
  • #8 The first decision that needed to be made was what software will be used to carry out the analysis. There are many software applications that can produce a Cox PH model, the ones I am most familiar with are SPSS, R and MiniTab. After a quick look at these three, I decided to use SPSS, as it seemed to give a clear and accurate output. Now, knowing which software is being used, I can make the following hypotheses assumptions, where the null hypothesis represents; The mortality rates of cancer patients are not affected by any of the variables. Whereas, the alternative hypothesis represents “at least one variable has an impact on the mortality rates of cancer patients”. The final assumption that needed to be made was within SPSS’s method of producing a Cox PH Model; I used the Forward Stepwise Function. This changes the way SPSS outputs the information. This displays only the variables which are statistically significant in descending order, from having the highest effect to lowest. All other variables which have a p-value ≥ 0.05 are not in the equation.
  • #9 The graphs shown on these next two slides show the probability of survival of patients, for both ampullary and pancreatic cancers. As you can see from the Survival Function for Ampullary cancer, the only two statistically significant variables which effect the survival of the patients are “resected” and “complications”. The graph shows, a patient with ampullary cancer who has been resected has the best survival chances, displayed by the purple line, along with a similarly high probability of survival with patients who have no complications. The bold line, shows three of the variables which have not had any statistical significant evidence to change the average survival probability for all ampullary cancer patients. The red and green lines show the extreme drop in survival probability as these patients have not had their tumour resected and have complications during their time examined. The same can be seen for the pancreatic cancer patients. Again resected is a statistically significant variable, along with patients being less than 69 years of age. Showing if the patient is over the age of 69, they have a less than average chance of survival. A patient having their tumour resected, gives the same odds as a patient with ampullary cancer who gets their tumour resected, giving the best and worst survival probabilities, illustrated by the red and purple lines.
  • #10 The Kaplan Meier survival function estimator is calculated as the following equation: Where ni is the number of subjects at risk and di is the number of subjects who fail, both at time ti The kaplan-meier estimator, also known as the product limit estimator, is a non-parametric statistic used to estimate the survival function from lifetime data. In this particular case, it is used to measure the fraction of patients living for a certain amount of time.
  • #11 The reason behind carrying out the K-M analysis, was to get a confirmation of if the variables, which came out statistically significant were true. In order to carry out the Kaplan-Meier analysis, some data alterations needed to be made: For ampullary cancer: the two variables that were statistically significant were “resected” and “complications” as the other three variables were not making any difference to the survival times of patients, there were not needed within the analysis. So having two variables gave 4 different varieties of patients, the groups are displayed here: The same needed to be done for pancreatic cancer patients, as the two statistically significant variables were “resected” and “less than 69”. The groups for pancreatic cancer is given on the slide:
  • #12 The outcome from the K-M analysis indicates that the Cox PH Model was accurate. This Survival Function shown for Ampullary cancer patients, suggests the same as the survival function in the Cox PH Model… Being a patient who has had the tumour resected clearly has a higher survival probability than a patient without resection, similarly having the advantage of no complications as well as being resected shows the best survival on this graph, represented by the gold line. This particular group has no median survival time calculated as the average survival probability has not dropped below 0.5, this therefore confirms the suspicion of group 3 being more successful at having longer time spans and less deaths than the other groups. Displayed here is the survival function graph for the pancreatic cancer patients. This again confirms the Cox PH model, having what we would expect to be the lowest survival rates to the highest. Lowest being patients who have not been resected and being 69 or older, whilst the highest is, the patients who have had their tumour resected and are ages less than 69. As there are no groups above the 0.5 mark, all of these groups have a calculated median survival time.
  • #13 A 20.053% difference was worked out between the overall mortality rates between pancreatic and ampullary cancer patients. This indicates the mortality rates are approximately 20% higher for pancreatic cancer patients than ampullary, therefore suggesting ampullary cancer patients have a higher survival rate. Now we can say the null hypothesis can be rejected, as there is enough statistically significant evidence to prove there has been at least one variable effecting the mortality rates of the cancer patients for both cancer types. There was no measurable difference between gender and multiple procedures in either cancer type. To conclude, it can be said with confidence, both the ampullary and pancreatic cancers can reject the null hypotheses, proving both these cancers are affected by at least one variable in the given data. To finish off with, a brief outline on what I believe could have been added to this project is shown behind me Extending the amount of data can give a more accurate outcome, showing greater relationships between the different variables. Having several software applications gives a wider variety of outcomes, showing how different packages display different results. Adding additional methods of survival analysis, such as a Logistic Regression or even a Nelson-Aalen estimator, again gives a variety of results which can be analysed And finally having a more in depth Literature review just gives the reader a better insight into the subject.
  • #14 This poster has been produced to show off my main skills and abilities I have learnt within these three years, which can and will help me within my chosen career. My main career goal is to become a fully qualified Actuary, hopefully working in either London or Manchester. But with any career, you always need an alternative, in my case, I have a few connections within a couple of Hedge Fund Companies which could get me one step closer to an interview for an out of this world job opportunity. I chose Operational Researcher as my third career choice, as this was my strongest subject throughout this degree. And finally teaching, from talking to many individuals who have had experience within these careers, I have noticed there is roughly a timespan of around 10-20 years of work. If I find myself needing a more family orientated career, teaching is what I would prefer.