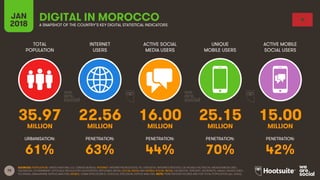
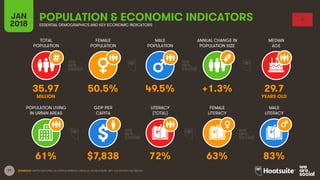
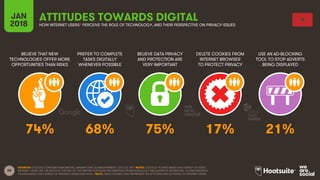
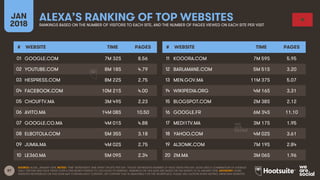
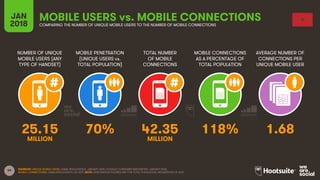
![76
INTERNET
USERS
ACTIVE SOCIAL
MEDIA USERS
UNIQUE
MOBILE USERS
ACTIVE MOBILE
SOCIAL USERS
JAN
2018 YEAR-ON-YEAR CHANGE IN KEY STATISTICAL INDICATORS
ANNUAL DIGITAL GROWTH
SINCE JAN 2017 SINCE JAN 2017 SINCE JAN 2017 SINCE JAN 2017
SOURCES: POPULATION: UNITED NATIONS; U.S. CENSUS BUREAU; INTERNET: INTERNETWORLDSTATS; ITU; EUROSTAT; INTERNETLIVESTATS; CIA WORLD FACTBOOK; MIDEASTMEDIA.ORG;
FACEBOOK; GOVERNMENT OFFICIALS; REGULATORY AUTHORITIES; REPUTABLE MEDIA; SOCIAL MEDIA AND MOBILE SOCIAL MEDIA: FACEBOOK; TENCENT; VKONTAKTE; KAKAO; NAVER; DING;
TECHRASA; SIMILARWEB; KEPIOS ANALYSIS; MOBILE: GSMA INTELLIGENCE; GOOGLE; ERICSSON; KEPIOS ANALYSIS. GROWTH DATA: WE ARE SOCIAL & HOOTSUITE’S DIGITAL IN 2017 REPORT.
+12% +14% [N/A] +15%
+2 MILLION +2 MILLION [N/A] +2 MILLION](https://image.slidesharecdn.com/digitalinmorocco-180227180046/85/Digital-in-Morocco-2018-3-320.jpg)
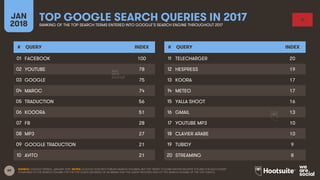
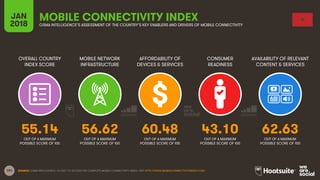
![78
MOBILE PHONE
(ANY TYPE)
SMART
PHONE
LAPTOP OR
DESKTOP COMPUTER
TABLET
COMPUTER
JAN
2018
DEVICE USAGEPERCENTAGE OF THE ADULT POPULATION* THAT CURRENTLY USES EACH KIND OF DEVICE [SURVEY-BASED]
TELEVISION
(ANY KIND)
DEVICE FOR STREAMING
INTERNET CONTENT TO TV
E-READER
DEVICE
WEARABLE
TECH DEVICE
SOURCE: GOOGLE CONSUMER BAROMETER, JANUARY 2018. FIGURES BASED ON RESPONSES TO A SURVEY. *NOTE: DATA REPRESENTS ADULT RESPONDENTS
ONLY; PLEASE SEE THE NOTES AT THE END OF THIS REPORT FOR MORE INFORMATION ON GOOGLE’S METHODOLOGY AND THEIR AUDIENCE DEFINITIONS.
96% 57% 25% 14%
87% 7% 1% 2%](https://image.slidesharecdn.com/digitalinmorocco-180227180046/85/Digital-in-Morocco-2018-5-320.jpg)
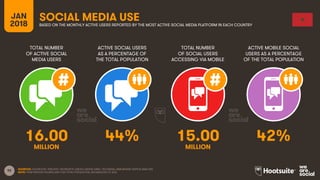
![79
AVERAGE DAILY TIME
SPENT USING THE
INTERNET VIA ANY DEVICE
AVERAGE DAILY TIME
SPENT USING SOCIAL
MEDIA VIA ANY DEVICE
AVERAGE DAILY TV VIEWING TIME
(BROADCAST, STREAMING
AND VIDEO ON DEMAND)
AVERAGE DAILY TIME
SPENT LISTENING TO
STREAMING MUSIC
JAN
2018
TIME SPENT WITH MEDIASURVEY-BASED DATA: FIGURES REPRESENT RESPONDENTS’ SELF-REPORTED ACTIVITY
SOURCE: GLOBALWEBINDEX, Q2 & Q3 2017. BASED ON A SURVEY OF INTERNET USERS AGED 16-64.
NOTE: TIME SPENT USING SOCIAL MEDIA INCLUDES SOCIAL NETWORKS AS WELL AS MESSENGERS / CHAT APPS.
2H 53M 2H 24M [N/A] [N/A]](https://image.slidesharecdn.com/digitalinmorocco-180227180046/85/Digital-in-Morocco-2018-6-320.jpg)


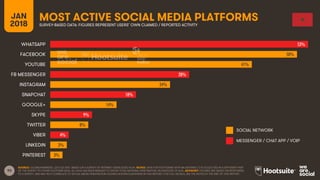
![88
USE A SEARCH
ENGINE
VISIT A SOCIAL
NETWORK
PLAY
GAMES
WATCH
VIDEOS
JAN
2018
WEEKLY ONLINE ACTIVITIES BY DEVICEPERCENTAGE OF THE TOTAL POPULATION* ENGAGING IN EACH ACTIVITY AT LEAST ONCE PER WEEK [SURVEY-BASED]
LOOK FOR PRODUCT
INFORMATION
SMARTPHONE:
COMPUTER:
SMARTPHONE:
COMPUTER:
SMARTPHONE:
COMPUTER:
SMARTPHONE:
COMPUTER:
SMARTPHONE:
COMPUTER:
SOURCE: GOOGLE CONSUMER BAROMETER, JANUARY 2018. FIGURES BASED ON RESPONSES TO A SURVEY. *NOTES: DATA BASED ON SURVEY
RESPONSES FROM ADULT INTERNET USERS ONLY; PLEASE SEE THE NOTES AT THE END OF THIS REPORT FOR MORE INFORMATION ON GOOGLE’S
METHODOLOGY AND THEIR AUDIENCE DEFINITIONS. DATA HAS BEEN REBASED TO SHOW TOTAL NATIONAL PENETRATION, REGARDLESS OF AGE.
28% 38% 12% 39% 21%
7% 9% 4% 8% 4%](https://image.slidesharecdn.com/digitalinmorocco-180227180046/85/Digital-in-Morocco-2018-15-320.jpg)


![102
HAS A BANK
ACCOUNT
HAS A
CREDIT CARD
MAKES AND / OR RECEIVES
MOBILE PAYMENTS VIA GSMA
MAKES ONLINE PURCHASES
AND / OR PAYS BILLS ONLINE
JAN
2018
FINANCIAL INCLUSION FACTORSPERCENTAGE OF THE POPULATION AGED 15+ THAT REPORTS OWNING OR USING EACH FINANCIAL PRODUCT OR SERVICE
PERCENTAGE OF WOMEN
WITH A CREDIT CARD
PERCENTAGE OF MEN
WITH A CREDIT CARD
PERCENTAGE OF WOMEN
MAKING INTERNET PAYMENTS
PERCENTAGE OF MEN
MAKING INTERNET PAYMENTS
SOURCE: WORLD BANK GLOBAL FINANCIAL INCLUSION DATA (2015). NOTE: FIGURES REPRESENT THE PERCENTAGE OF PEOPLE AGED 15+, NOT TOTAL POPULATION.
39% 4% [N/A] [N/A]
2% 7% [N/A] [N/A]](https://image.slidesharecdn.com/digitalinmorocco-180227180046/85/Digital-in-Morocco-2018-29-320.jpg)

This document provides statistics and data on digital trends in Morocco as of January 2018. It includes data on internet and social media penetration rates, device usage, time spent online, most visited websites, and weekly online activities. The data is sourced from various organizations that track digital and internet metrics worldwide.


![[DSC Europe 25] Josip Saban - Career building for data professionals.pptx](https://cdn.slidesharecdn.com/ss_thumbnails/zroflcttkm1vmli0txea-josip-saban-career-building-for-data-professionals-260123083019-587cdb8c-thumbnail.jpg?width=640&height=640&fit=bounds)
![[DSC Europe 25] Marcos Heidemann - Beyond the Hype: Making AI Coding Assistan...](https://cdn.slidesharecdn.com/ss_thumbnails/eexkhvldrjsopspdjbur-marcos-heidemann-beyond-the-hype-getting-real-value-out-of-ai-assisted-coding-260121115910-7e9d41ec-thumbnail.jpg?width=640&height=640&fit=bounds)


![[DSC Europe 25] Egor Krasheninnikov - The Control Stack: Building Guardrails ...](https://cdn.slidesharecdn.com/ss_thumbnails/3lzcz7hxqmo51mtalv4u-the-control-stack-260119101520-ea90841a-thumbnail.jpg?width=640&height=640&fit=bounds)


![[DSC Europe 25] Bojan Banjac - AI is always right when it comes to the matter...](https://cdn.slidesharecdn.com/ss_thumbnails/syoxtqierpydwxm5srcb-4-bojan-banjac-ai-is-always-right-when-it-comes-to-the-matters-of-taste-260119101519-694ee7d7-thumbnail.jpg?width=640&height=640&fit=bounds)


