
Uploaded byShameem Anwar
Descriptive statistics
The document presents descriptive statistics for survey respondents from three sectors: IT/ITES, automobile, and FMCG. Most respondents were between 40-50 years old, had over 25 years of experience, and held positions as member/director or non-executive director. This provides a balanced assessment across sectors from experienced professionals. Factor analysis was then conducted on Likert-scaled survey variables to extract principal components and reduce the data dimensions, retaining only factors with eigenvalues over 1.


Descriptive statistics
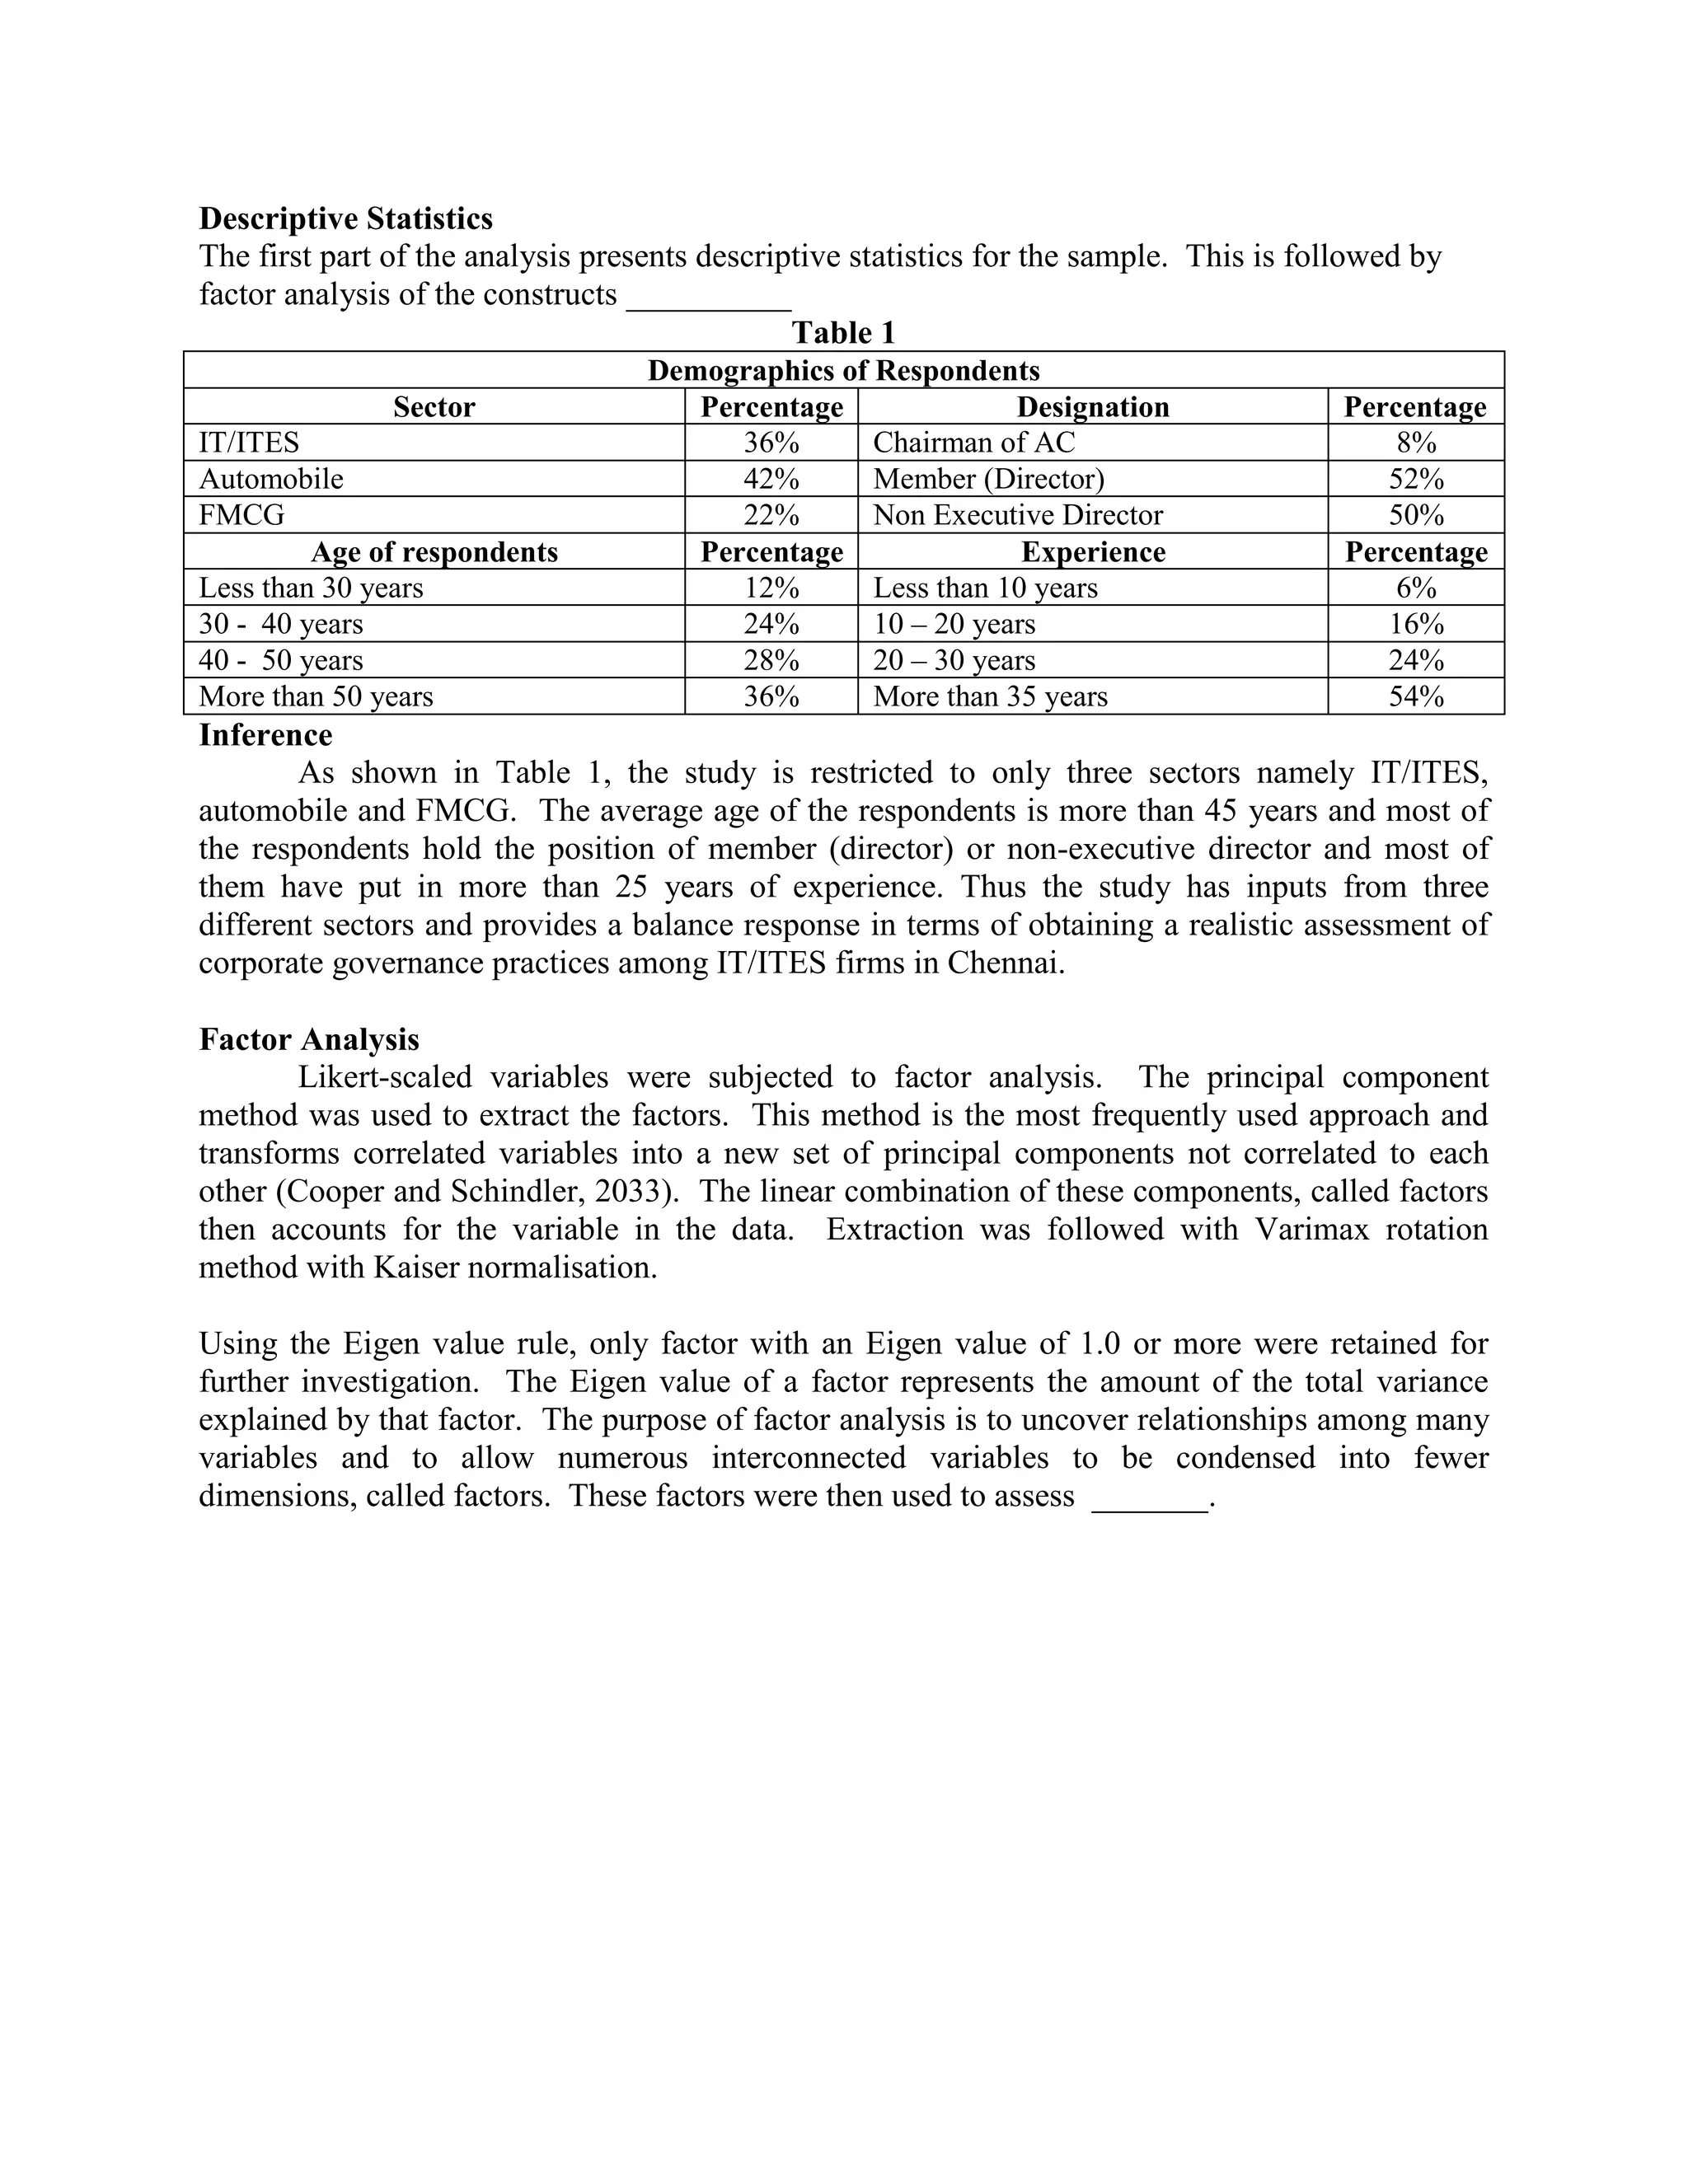
- 1. Descriptive Statistics The firstpart of the analysis presents descriptive statistics for the sample. This is followed by factor analysis of the constructs __________ Table 1 Demographics of Respondents Sector Percentage Designation Percentage IT/ITES 36% Chairman of AC 8% Automobile 42% Member (Director) 52% FMCG 22% Non Executive Director 50% Age of respondents Percentage Experience Percentage Less than 30 years 12% Less than 10 years 6% 30 - 40 years 24% 10 – 20 years 16% 40 - 50 years 28% 20 – 30 years 24% More than 50 years 36% More than 35 years 54% Inference As shown in Table 1, the study is restricted to only three sectors namely IT/ITES, automobile and FMCG. The average age of the respondents is more than 45 years and most of the respondents hold the position of member (director) or non-executive director and most of them have put in more than 25 years of experience. Thus the study has inputs from three different sectors and provides a balance response in terms of obtaining a realistic assessment of corporate governance practices among IT/ITES firms in Chennai. Factor Analysis Likert-scaled variables were subjected to factor analysis. The principal component method was used to extract the factors. This method is the most frequently used approach and transforms correlated variables into a new set of principal components not correlated to each other (Cooper and Schindler, 2033). The linear combination of these components, called factors then accounts for the variable in the data. Extraction was followed with Varimax rotation method with Kaiser normalisation. Using the Eigen value rule, only factor with an Eigen value of 1.0 or more were retained for further investigation. The Eigen value of a factor represents the amount of the total variance explained by that factor. The purpose of factor analysis is to uncover relationships among many variables and to allow numerous interconnected variables to be condensed into fewer dimensions, called factors. These factors were then used to assess _______.