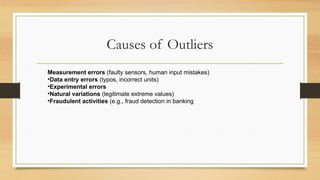
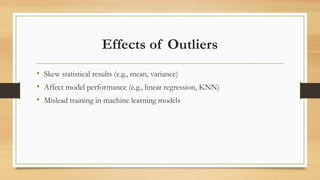
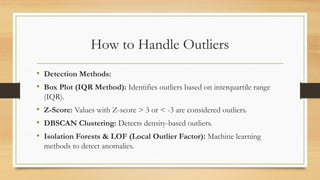
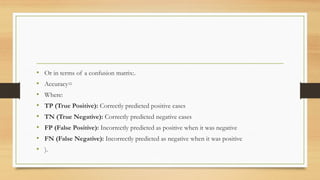
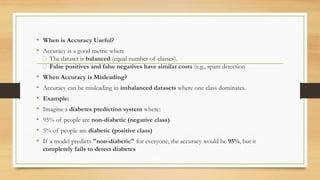
Dependency modelling
AI
Outliers
• In machine learning, outliers are data points that significantly differ from the
rest of the dataset. They can be unusually high or low values compared to
the majority of data points and may result from errors, variability in
measurements, or rare occurrences.
Types of Outliers
• Global Outliers (Point Anomalies)
• A data point that deviates significantly from the entire dataset.
• Example: In a dataset of human weights (mostly between 40-100 kg), a value
of 500 kg would be a global outlier.
• Contextual Outliers (Conditional Anomalies):
• A value that is normal in one context but an outlier in another.
•Example: A temperature of 30°C is normal in summer but an outlier
in winter.
• Collective Outliers:
•A group of data points that, when considered together, behave
differently from the rest.
•Example: A sudden spike in website traffic at midnight for an e-
commerce site may indicate a cyber attack.
Causes of Outliers
Measurement errors (faulty sensors, human input mistakes)
•Data entry errors (typos, incorrect units)
•Experimental errors
•Natural variations (legitimate extreme values)
•Fraudulent activities (e.g., fraud detection in banking
Effects of Outliers
• Skew statistical results (e.g., mean, variance)
• Affect model performance (e.g., linear regression, KNN)
• Mislead training in machine learning models
How to Handle Outliers
• Detection Methods:
• Box Plot (IQR Method): Identifies outliers based on interquartile range
(IQR).
• Z-Score: Values with Z-score > 3 or < -3 are considered outliers.
• DBSCAN Clustering: Detects density-based outliers.
• Isolation Forests & LOF (Local Outlier Factor): Machine learning
methods to detect anomalies.
Handling Techniques
• Remove outliers if they are due to errors.
• Transform data (e.g., log transformation) to reduce impact.
• Cap the values (winsorization) to limit extreme values.
• Use robust models (e.g., tree-based models, median-based methods) that
are less sensitive to outliers.
Evaluation metrics in machine learning
• Accuracy is one of the most commonly used evaluation metrics in machine
learning, especially for classification problems. It measures how often the
model correctly predicts the target class.
• Formula for Accuracy
• Accuracy= *100
• Or in terms of a confusion matrix:.
• Accuracy=
• Where:
• TP (True Positive): Correctly predicted positive cases
• TN (True Negative): Correctly predicted negative cases
• FP (False Positive): Incorrectly predicted as positive when it was negative
• FN (False Negative): Incorrectly predicted as negative when it was positive
• ).
• When is Accuracy Useful?
• Accuracy is a good metric when:
✅ The dataset is balanced (equal number of classes).
✅ False positives and false negatives have similar costs (e.g., spam detection
• When Accuracy is Misleading?
• Accuracy can be misleading in imbalanced datasets where one class dominates.
• Example:
• Imagine a diabetes prediction system where:
• 95% of people are non-diabetic (negative class)
• 5% of people are diabetic (positive class)
• If a model predicts "non-diabetic" for everyone, the accuracy would be 95%, but it
completely fails to detect diabetes
Better Metrics in Imbalanced Datasets
• Precision (Positive Predictive Value)
• Precision=
•Measures how many predicted positives are actually positive.
•Useful when false positives are costly (e.g., cancer detection).
Recall
• Recall (Sensitivity, True Positive Rate)
• Recall=
•Measures how many actual positives were detected.
•Important when false negatives are costly (e.g., missing a diabetes
case).
• `
•
F1-Score (Harmonic Mean of Precision &
Recall)
• F1-Score (Harmonic Mean of Precision & Recall)
• F1=2*
•A balance between precision and recall.
•ROC-AUC (Receiver Operating Characteristic - Area Under
Curve)
•Measures the ability of the model to distinguish between classes.

Dependency modelling in data mining.pptx

  • 1.
  • 2.
    Outliers • In machinelearning, outliers are data points that significantly differ from the rest of the dataset. They can be unusually high or low values compared to the majority of data points and may result from errors, variability in measurements, or rare occurrences.
  • 3.
    Types of Outliers •Global Outliers (Point Anomalies) • A data point that deviates significantly from the entire dataset. • Example: In a dataset of human weights (mostly between 40-100 kg), a value of 500 kg would be a global outlier.
  • 4.
    • Contextual Outliers(Conditional Anomalies): • A value that is normal in one context but an outlier in another. •Example: A temperature of 30°C is normal in summer but an outlier in winter.
  • 5.
    • Collective Outliers: •Agroup of data points that, when considered together, behave differently from the rest. •Example: A sudden spike in website traffic at midnight for an e- commerce site may indicate a cyber attack.
  • 6.
    Causes of Outliers Measurementerrors (faulty sensors, human input mistakes) •Data entry errors (typos, incorrect units) •Experimental errors •Natural variations (legitimate extreme values) •Fraudulent activities (e.g., fraud detection in banking
  • 7.
    Effects of Outliers •Skew statistical results (e.g., mean, variance) • Affect model performance (e.g., linear regression, KNN) • Mislead training in machine learning models
  • 8.
    How to HandleOutliers • Detection Methods: • Box Plot (IQR Method): Identifies outliers based on interquartile range (IQR). • Z-Score: Values with Z-score > 3 or < -3 are considered outliers. • DBSCAN Clustering: Detects density-based outliers. • Isolation Forests & LOF (Local Outlier Factor): Machine learning methods to detect anomalies.
  • 9.
    Handling Techniques • Removeoutliers if they are due to errors. • Transform data (e.g., log transformation) to reduce impact. • Cap the values (winsorization) to limit extreme values. • Use robust models (e.g., tree-based models, median-based methods) that are less sensitive to outliers.
  • 10.
    Evaluation metrics inmachine learning • Accuracy is one of the most commonly used evaluation metrics in machine learning, especially for classification problems. It measures how often the model correctly predicts the target class. • Formula for Accuracy • Accuracy= *100
  • 11.
    • Or interms of a confusion matrix:. • Accuracy= • Where: • TP (True Positive): Correctly predicted positive cases • TN (True Negative): Correctly predicted negative cases • FP (False Positive): Incorrectly predicted as positive when it was negative • FN (False Negative): Incorrectly predicted as negative when it was positive • ).
  • 12.
    • When isAccuracy Useful? • Accuracy is a good metric when: ✅ The dataset is balanced (equal number of classes). ✅ False positives and false negatives have similar costs (e.g., spam detection • When Accuracy is Misleading? • Accuracy can be misleading in imbalanced datasets where one class dominates. • Example: • Imagine a diabetes prediction system where: • 95% of people are non-diabetic (negative class) • 5% of people are diabetic (positive class) • If a model predicts "non-diabetic" for everyone, the accuracy would be 95%, but it completely fails to detect diabetes
  • 13.
    Better Metrics inImbalanced Datasets • Precision (Positive Predictive Value) • Precision= •Measures how many predicted positives are actually positive. •Useful when false positives are costly (e.g., cancer detection).
  • 14.
    Recall • Recall (Sensitivity,True Positive Rate) • Recall= •Measures how many actual positives were detected. •Important when false negatives are costly (e.g., missing a diabetes case). • ` •
  • 15.
    F1-Score (Harmonic Meanof Precision & Recall) • F1-Score (Harmonic Mean of Precision & Recall) • F1=2* •A balance between precision and recall. •ROC-AUC (Receiver Operating Characteristic - Area Under Curve) •Measures the ability of the model to distinguish between classes.