Downloaded 10 times

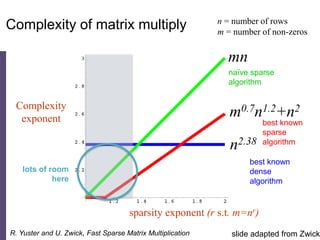
![SELECT x.strain, x.chr, x.region as snp_region, x.start_bp as snp_start_bp
, x.end_bp as snp_end_bp, w.start_bp as nc_start_bp, w.end_bp as nc_end_bp
, w.category as nc_category
, CASE WHEN (x.start_bp >= w.start_bp AND x.end_bp <= w.end_bp)
THEN x.end_bp - x.start_bp + 1
WHEN (x.start_bp <= w.start_bp AND w.start_bp <= x.end_bp)
THEN x.end_bp - w.start_bp + 1
WHEN (x.start_bp <= w.end_bp AND w.end_bp <= x.end_bp)
THEN w.end_bp - x.start_bp + 1
END AS len_overlap
FROM [koesterj@washington.edu].[hotspots_deserts.tab] x
INNER JOIN [koesterj@washington.edu].[table_noncoding_positions.tab] w
ON x.chr = w.chr
WHERE (x.start_bp >= w.start_bp AND x.end_bp <= w.end_bp)
OR (x.start_bp <= w.start_bp AND w.start_bp <= x.end_bp)
OR (x.start_bp <= w.end_bp AND w.end_bp <= x.end_bp)
ORDER BY x.strain, x.chr ASC, x.start_bp ASC
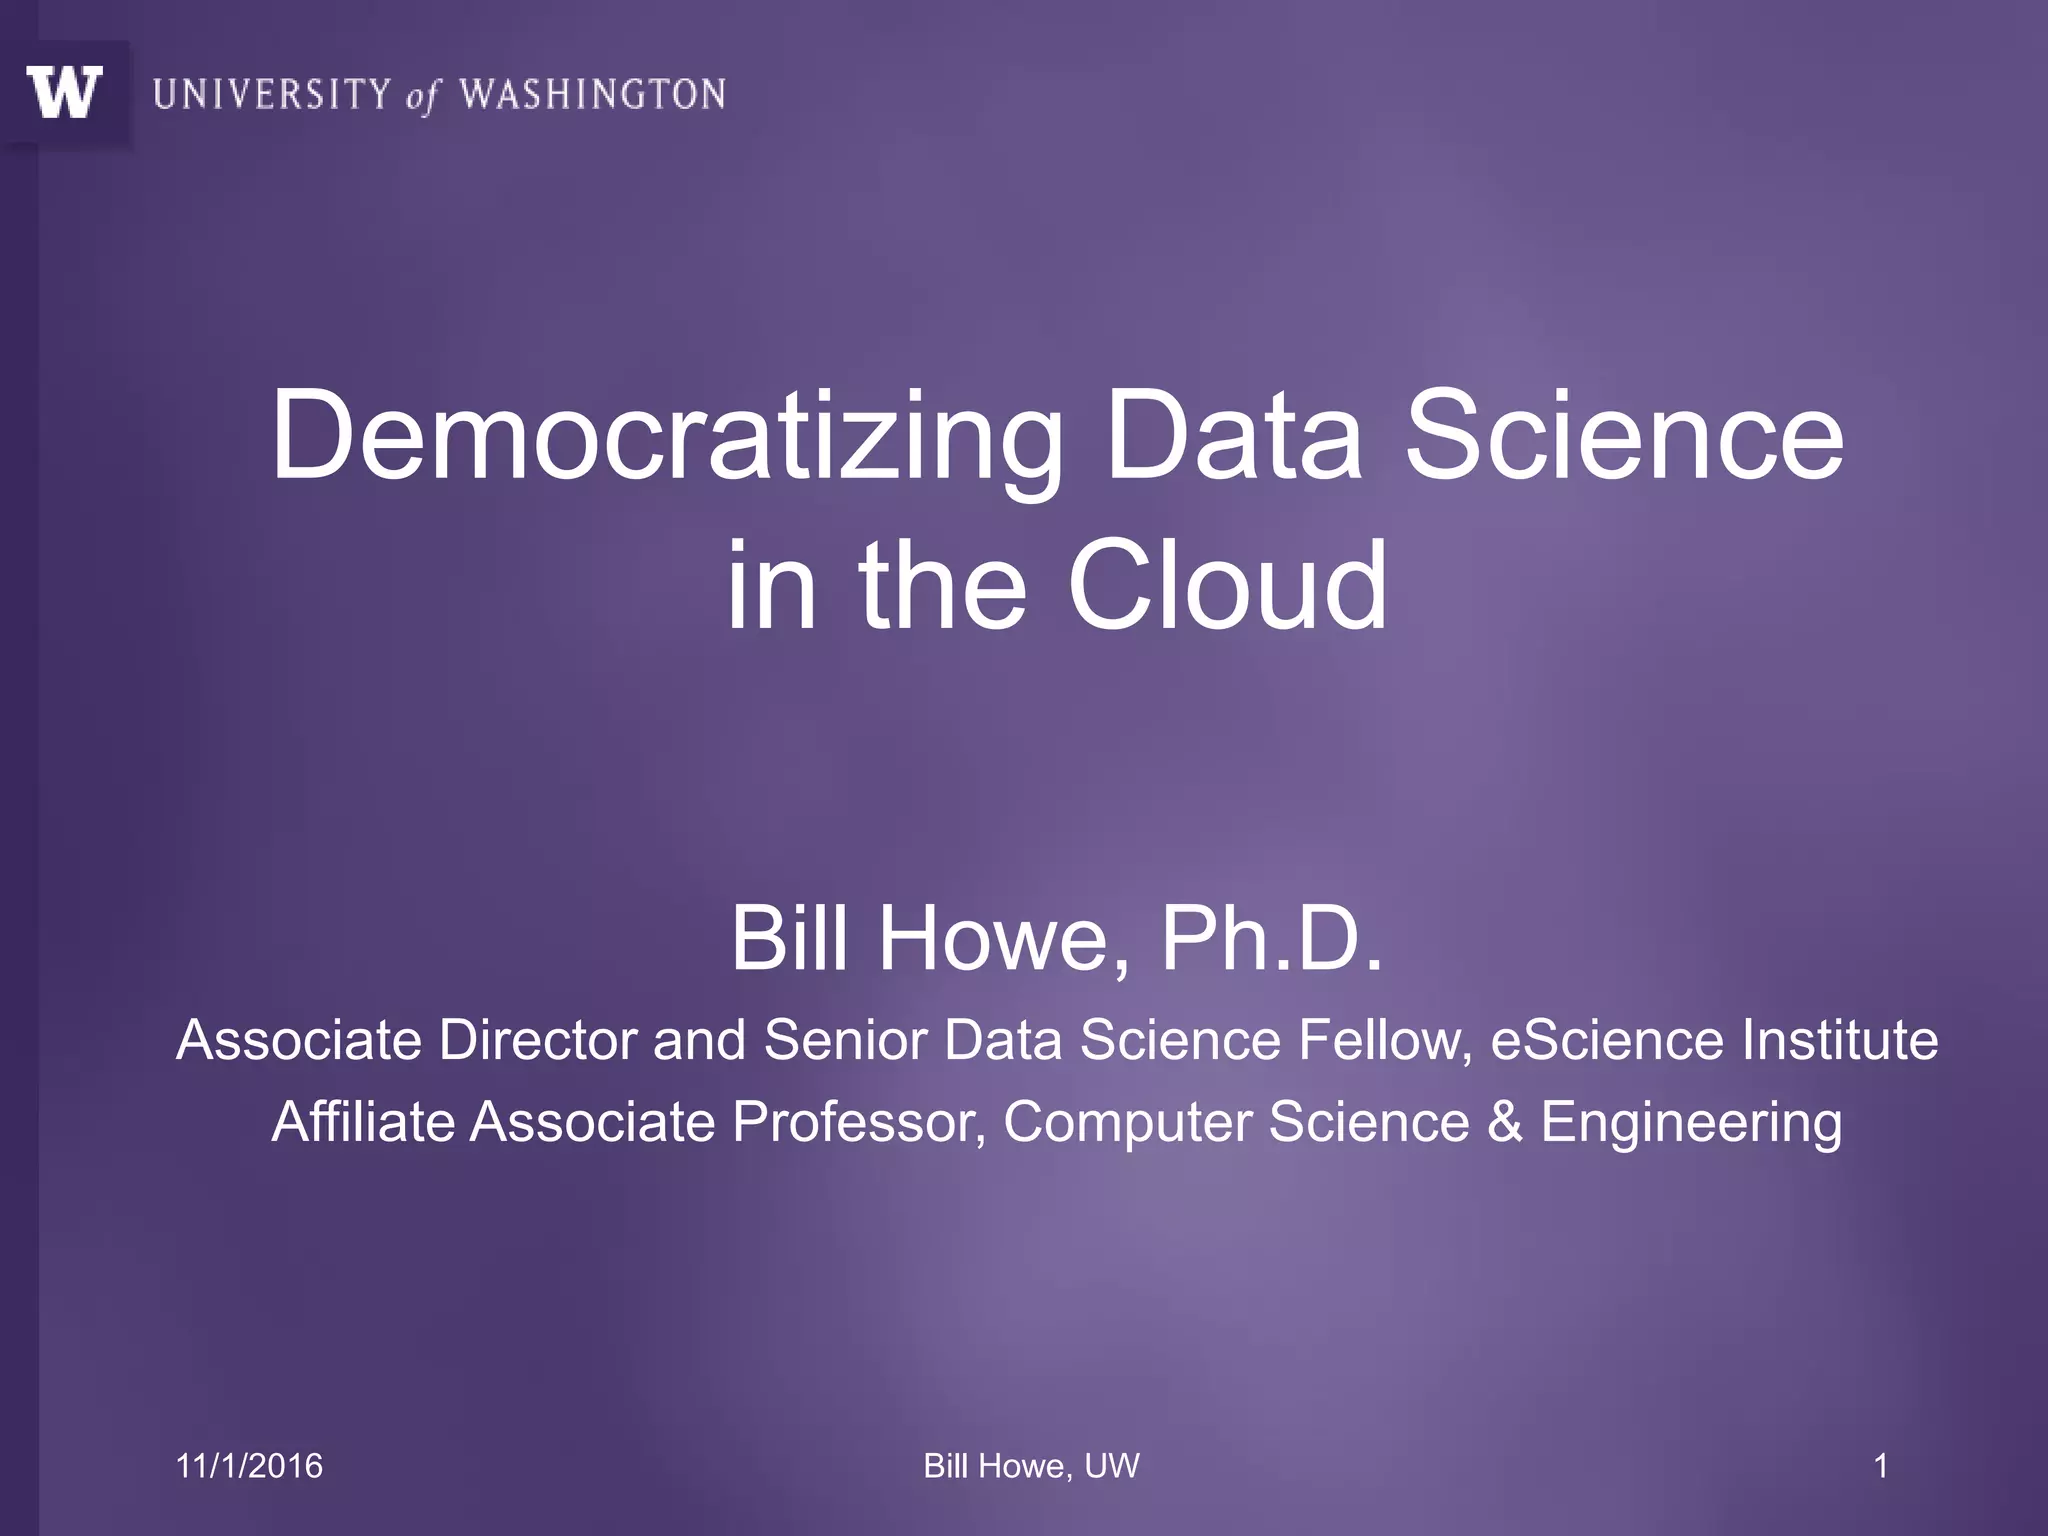
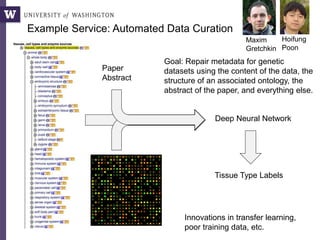
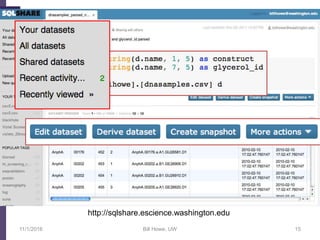
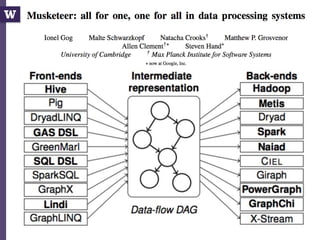
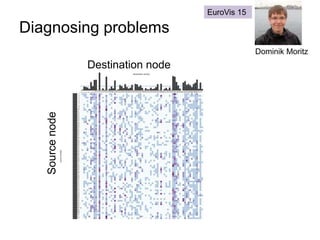
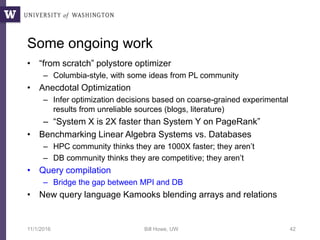
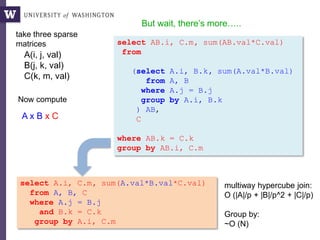
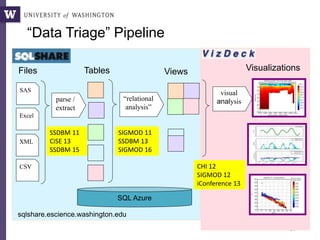
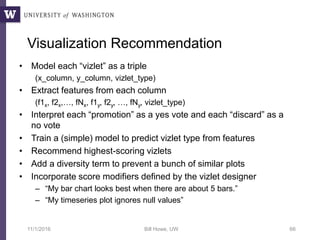
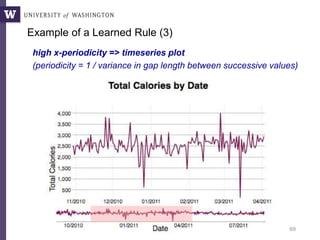
Non-programmers can write very complex queries
(rather than relying on staff programmers)
Example: Computing the overlaps of two sets of blast results
We see thousands of
queries written by
non-programmers](https://image.slidesharecdn.com/clouddm2016howe-161101162858/85/Democratizing-Data-Science-in-the-Cloud-16-320.jpg)
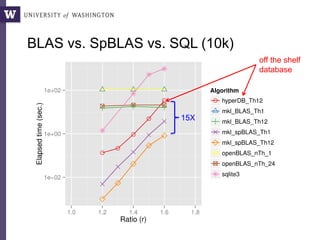
![:
SELECT COUNT(*) FROM [candrzejowiec@yahoo.com].[table_Firearms.txt]
SELECT COUNT (HiLo) FROM [roula.cardaras@gmail.com].[table_MUK.csv]
SELECT count(*) FROM [leslie@westerncatholic.org].[Depth_combined]
select count(Wave_Height) from [christa.kohnert@gmail.com].[Join]
SELECT count(*) FROM [wenjunh@washington.edu].[ecoli_nogaps_1.csv]
SELECT Count(*) FROM [latcron@gmail.com].[TargetTrackFeatures.csv]
SELECT count(*) FROM [billhowe].[sunrise sunset times 2009 - 2011]
SELECT Count(*) FROM [bifxcore@gmail.com].[table_ec_pdb_genus.csv]
SELECT count(*) FROM [whitead@washington.edu].[ecoli_nogaps_1.csv]
SELECT COUNT(*) FROM [ribalet@washington.edu].[Tokyo_0_merged.csv]
SELECT COUNT(*) FROM [dhalperi@washington.edu].[SPID_GOnumber.txt]
SELECT COUNT (species) FROM [bigbananatopdog@gmail.com].[Orthosia]
SELECT COUNT (species) FROM [bigbananatopdog@gmail.com].[Leucania]
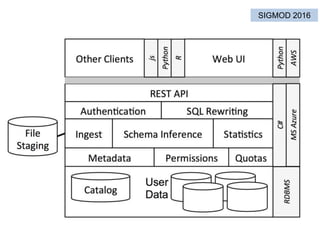
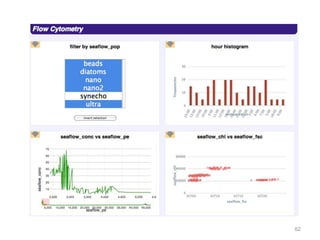
:
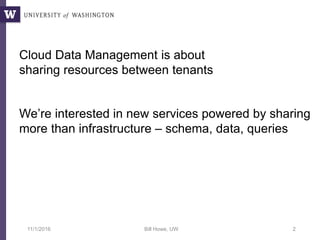
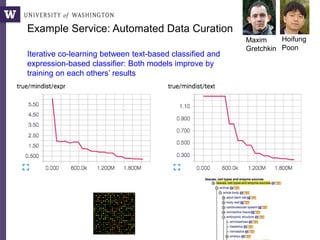
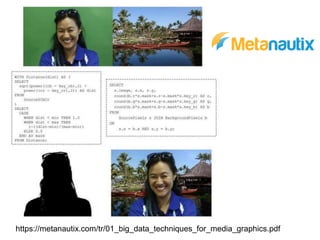
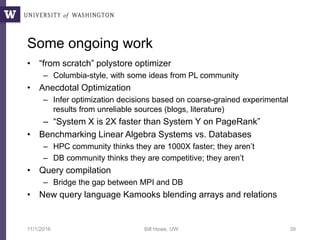
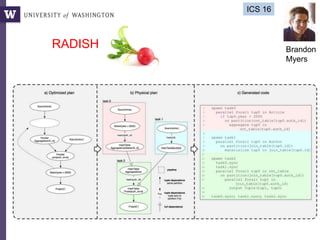
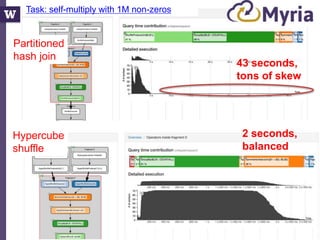
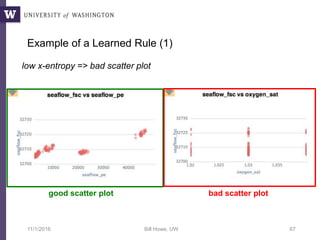
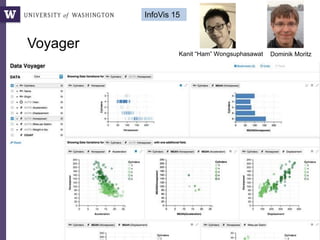
Apply the same trick to the SQLShare corpus, cluster the results
A not-very-interesting cluster:
Latent SQL Idioms](https://image.slidesharecdn.com/clouddm2016howe-161101162858/85/Democratizing-Data-Science-in-the-Cloud-20-320.jpg)
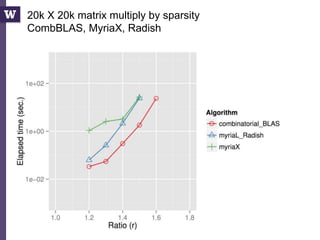
![:
SELECT COUNT(*) FROM [ajw123@washington.edu].[table_proteins.csv] WHERE species LIKE 'Homo sapiens
SELECT count (*) FROM [1029880@apps.nsd.org].[Task 5] where (Hashtags_In_Text) Like '%Phailin%'
SELECT count (*) FROM [1029880@apps.nsd.org].[Task 5] where (Hashtags_In_Text) Like '%Phailin%'
SELECT Count (*) FROM [kzoehayes@gmail.com].[Dated_Join] WHERE Category = 'Warm'
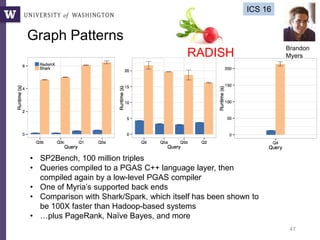
SELECT COUNT (*) FROM [ethanknight08@gmail.com].[table_PopulationV2.txt] WHERE Column1='Country'
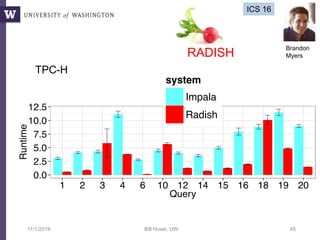
SELECT COUNT(*) FROM [missmelupton@gmail.com].[table_pHWaterTemp] WHERE TempCategory='normal'
SELECT COUNT(*) FROM [1004387@apps.nsd.org].[no retweete] WHERE hashtags_in_text LIKE '%#odisha
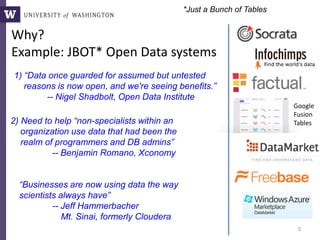
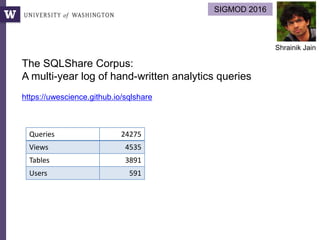
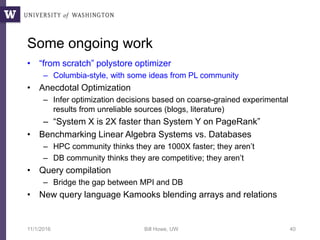
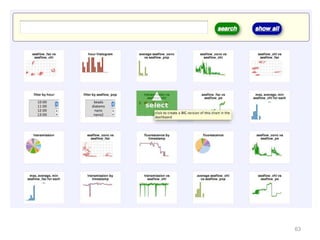
:
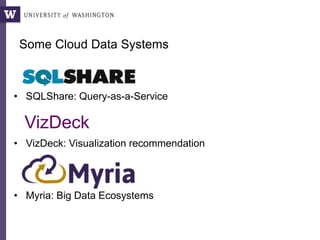
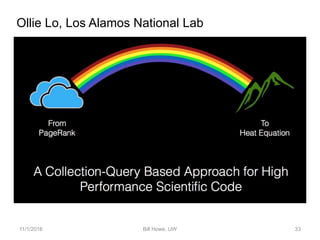
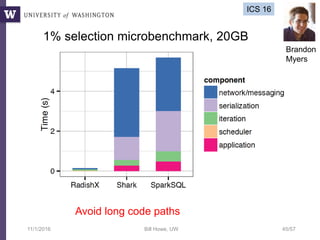
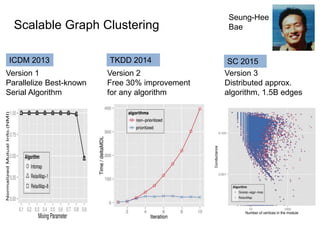
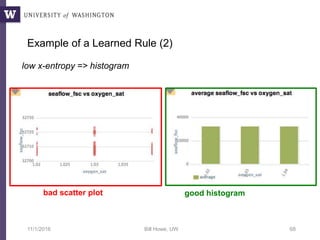
Another not-very-interesting cluster:
We see other clusters that seem to capture more basics: “union,”
“group by with one grouping column,” “left outer join,” “string
manipulation,” etc.
Latent SQL Idioms](https://image.slidesharecdn.com/clouddm2016howe-161101162858/85/Democratizing-Data-Science-in-the-Cloud-21-320.jpg)
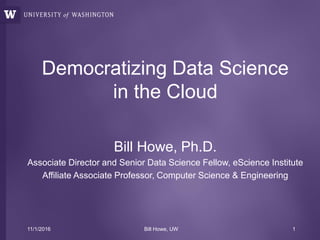
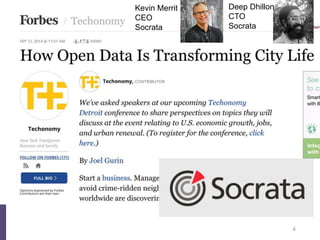
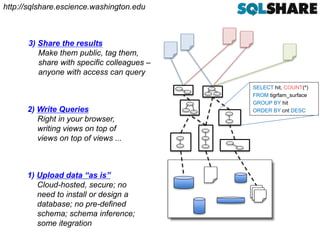
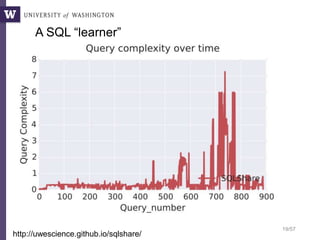
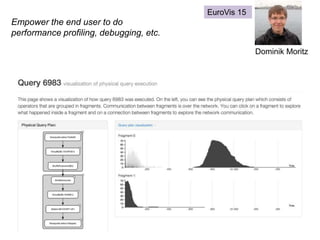
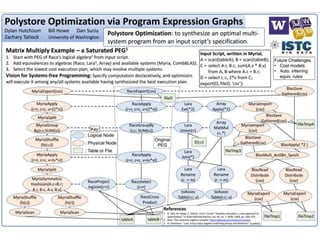
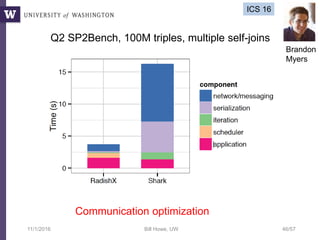
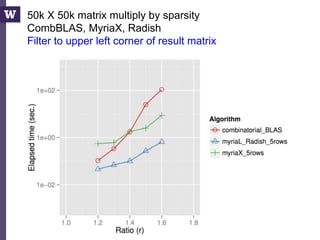
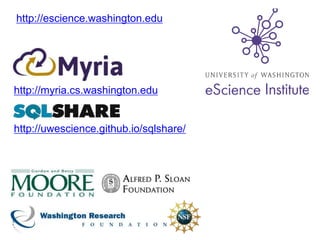
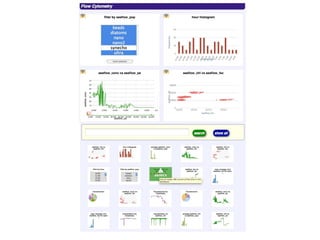
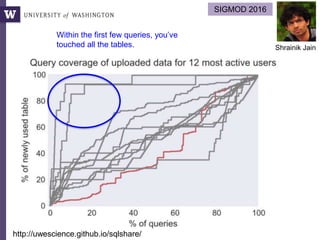
![Latent SQL Idioms
More interesting examples:
select floor(latitude/0.7)*0.7 as latbin
, floor(longitude/0.7)*0.7 as lonbin
, species
FROM [koenigk92@gmail.com].[All3col]
select distinct case when patindex('%[0-9]%', [protein]) = 1 -- first char is number
and charindex(',', [protein]) = 0 -- and no comma present
then [protein]
else substring([protein], patindex('%[0-9]%', [protein]),
charindex(',', [protein])-patindex('%[0-9]%', [protein]))
end as [protein d1124],
[tot indep spectra] as [tot spectra d1124]
from [emmats@washington.edu].[d1_file124.txt]
Parsing a common
bioinformatics file format
Expressions for binning
space and time columns](https://image.slidesharecdn.com/clouddm2016howe-161101162858/85/Democratizing-Data-Science-in-the-Cloud-22-320.jpg)
![34
CurGood = SCAN(public:adhoc:sc_points);
DO
mean = [FROM CurGood EMIT val=AVG(v)];
std = [FROM CurGood EMIT val=STDEV(v)];
NewBad = [FROM Good WHERE ABS(Good.v - mean) > 2 * std EMIT *];
CurGood = CurGood - NewBad;
continue = [FROM NewBad EMIT COUNT(NewBad.v) > 0];
WHILE continue;
DUMP(CurGood);
Sigma-clipping, V0](https://image.slidesharecdn.com/clouddm2016howe-161101162858/85/Democratizing-Data-Science-in-the-Cloud-33-320.jpg)
![35
CurGood = P
sum = [FROM CurGood EMIT SUM(val)];
sumsq = [FROM CurGood EMIT SUM(val*val)]
cnt = [FROM CurGood EMIT CNT(*)];
NewBad = []
DO
sum = sum – [FROM NewBad EMIT SUM(val)];
sumsq = sum – [FROM NewBad EMIT SUM(val*val)];
cnt = sum - [FROM NewBad EMIT CNT(*)];
mean = sum / cnt
std = sqrt(1/(cnt*(cnt-1)) * (cnt * sumsq - sum*sum))
NewBad = FILTER([ABS(val-mean)>std], CurGood)
CurGood = CurGood - NewBad
WHILE NewBad != {}
Sigma-clipping, V1: Incremental](https://image.slidesharecdn.com/clouddm2016howe-161101162858/85/Democratizing-Data-Science-in-the-Cloud-34-320.jpg)
![36
Points = SCAN(public:adhoc:sc_points);
aggs = [FROM Points EMIT _sum=SUM(v), sumsq=SUM(v*v), cnt=COUNT(v)];
newBad = []
bounds = [FROM Points EMIT lower=MIN(v), upper=MAX(v)];
DO
new_aggs = [FROM newBad EMIT _sum=SUM(v), sumsq=SUM(v*v), cnt=COUNT(v)];
aggs = [FROM aggs, new_aggs EMIT _sum=aggs._sum - new_aggs._sum,
sumsq=aggs.sumsq - new_aggs.sumsq, cnt=aggs.cnt - new_aggs.cnt];
stats = [FROM aggs EMIT mean=_sum/cnt,
std=SQRT(1.0/(cnt*(cnt-1)) * (cnt * sumsq - _sum * _sum))];
newBounds = [FROM stats EMIT lower=mean - 2 * std, upper=mean + 2 * std];
tooLow = [FROM Points, bounds, newBounds WHERE newBounds.lower > v
AND v >= bounds.lower EMIT v=Points.v];
tooHigh = [FROM Points, bounds, newBounds WHERE newBounds.upper < v
AND v <= bounds.upper EMIT v=Points.v];
newBad = UNIONALL(tooLow, tooHigh);
bounds = newBounds;
continue = [FROM newBad EMIT COUNT(v) > 0];
WHILE continue;
output = [FROM Points, bounds WHERE Points.v > bounds.lower AND
Points.v < bounds.upper EMIT v=Points.v];
DUMP(output);
Sigma-clipping, V2](https://image.slidesharecdn.com/clouddm2016howe-161101162858/85/Democratizing-Data-Science-in-the-Cloud-35-320.jpg)
![Query compilation for distributed processing
pipeline
as
parallel
code
parallel compiler
machine
code
[Myers ’14]
pipeline
fragment
code
pipeline
fragment
code
sequential
compiler
machine
code
[Crotty ’14, Li ’14, Seo ’14, Murray ‘11]
sequential
compiler](https://image.slidesharecdn.com/clouddm2016howe-161101162858/85/Democratizing-Data-Science-in-the-Cloud-42-320.jpg)


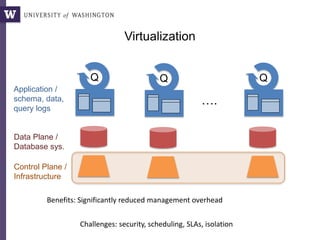
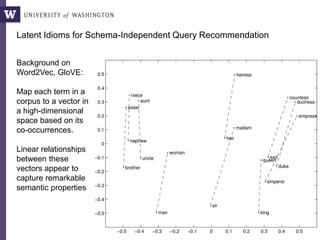
This document discusses democratizing data science in the cloud. It describes how cloud data management involves sharing resources like infrastructure, schema, data, and queries between tenants. This sharing enables new query-as-a-service systems that can provide smart cross-tenant services by learning from metadata, queries, and data across all users. Examples of possible services discussed include automated data curation, query recommendation, data discovery, and semi-automatic data integration. The document also describes some cloud data systems developed at the University of Washington like SQLShare and Myria that aim to realize this vision.