Download as PDF, PPTX

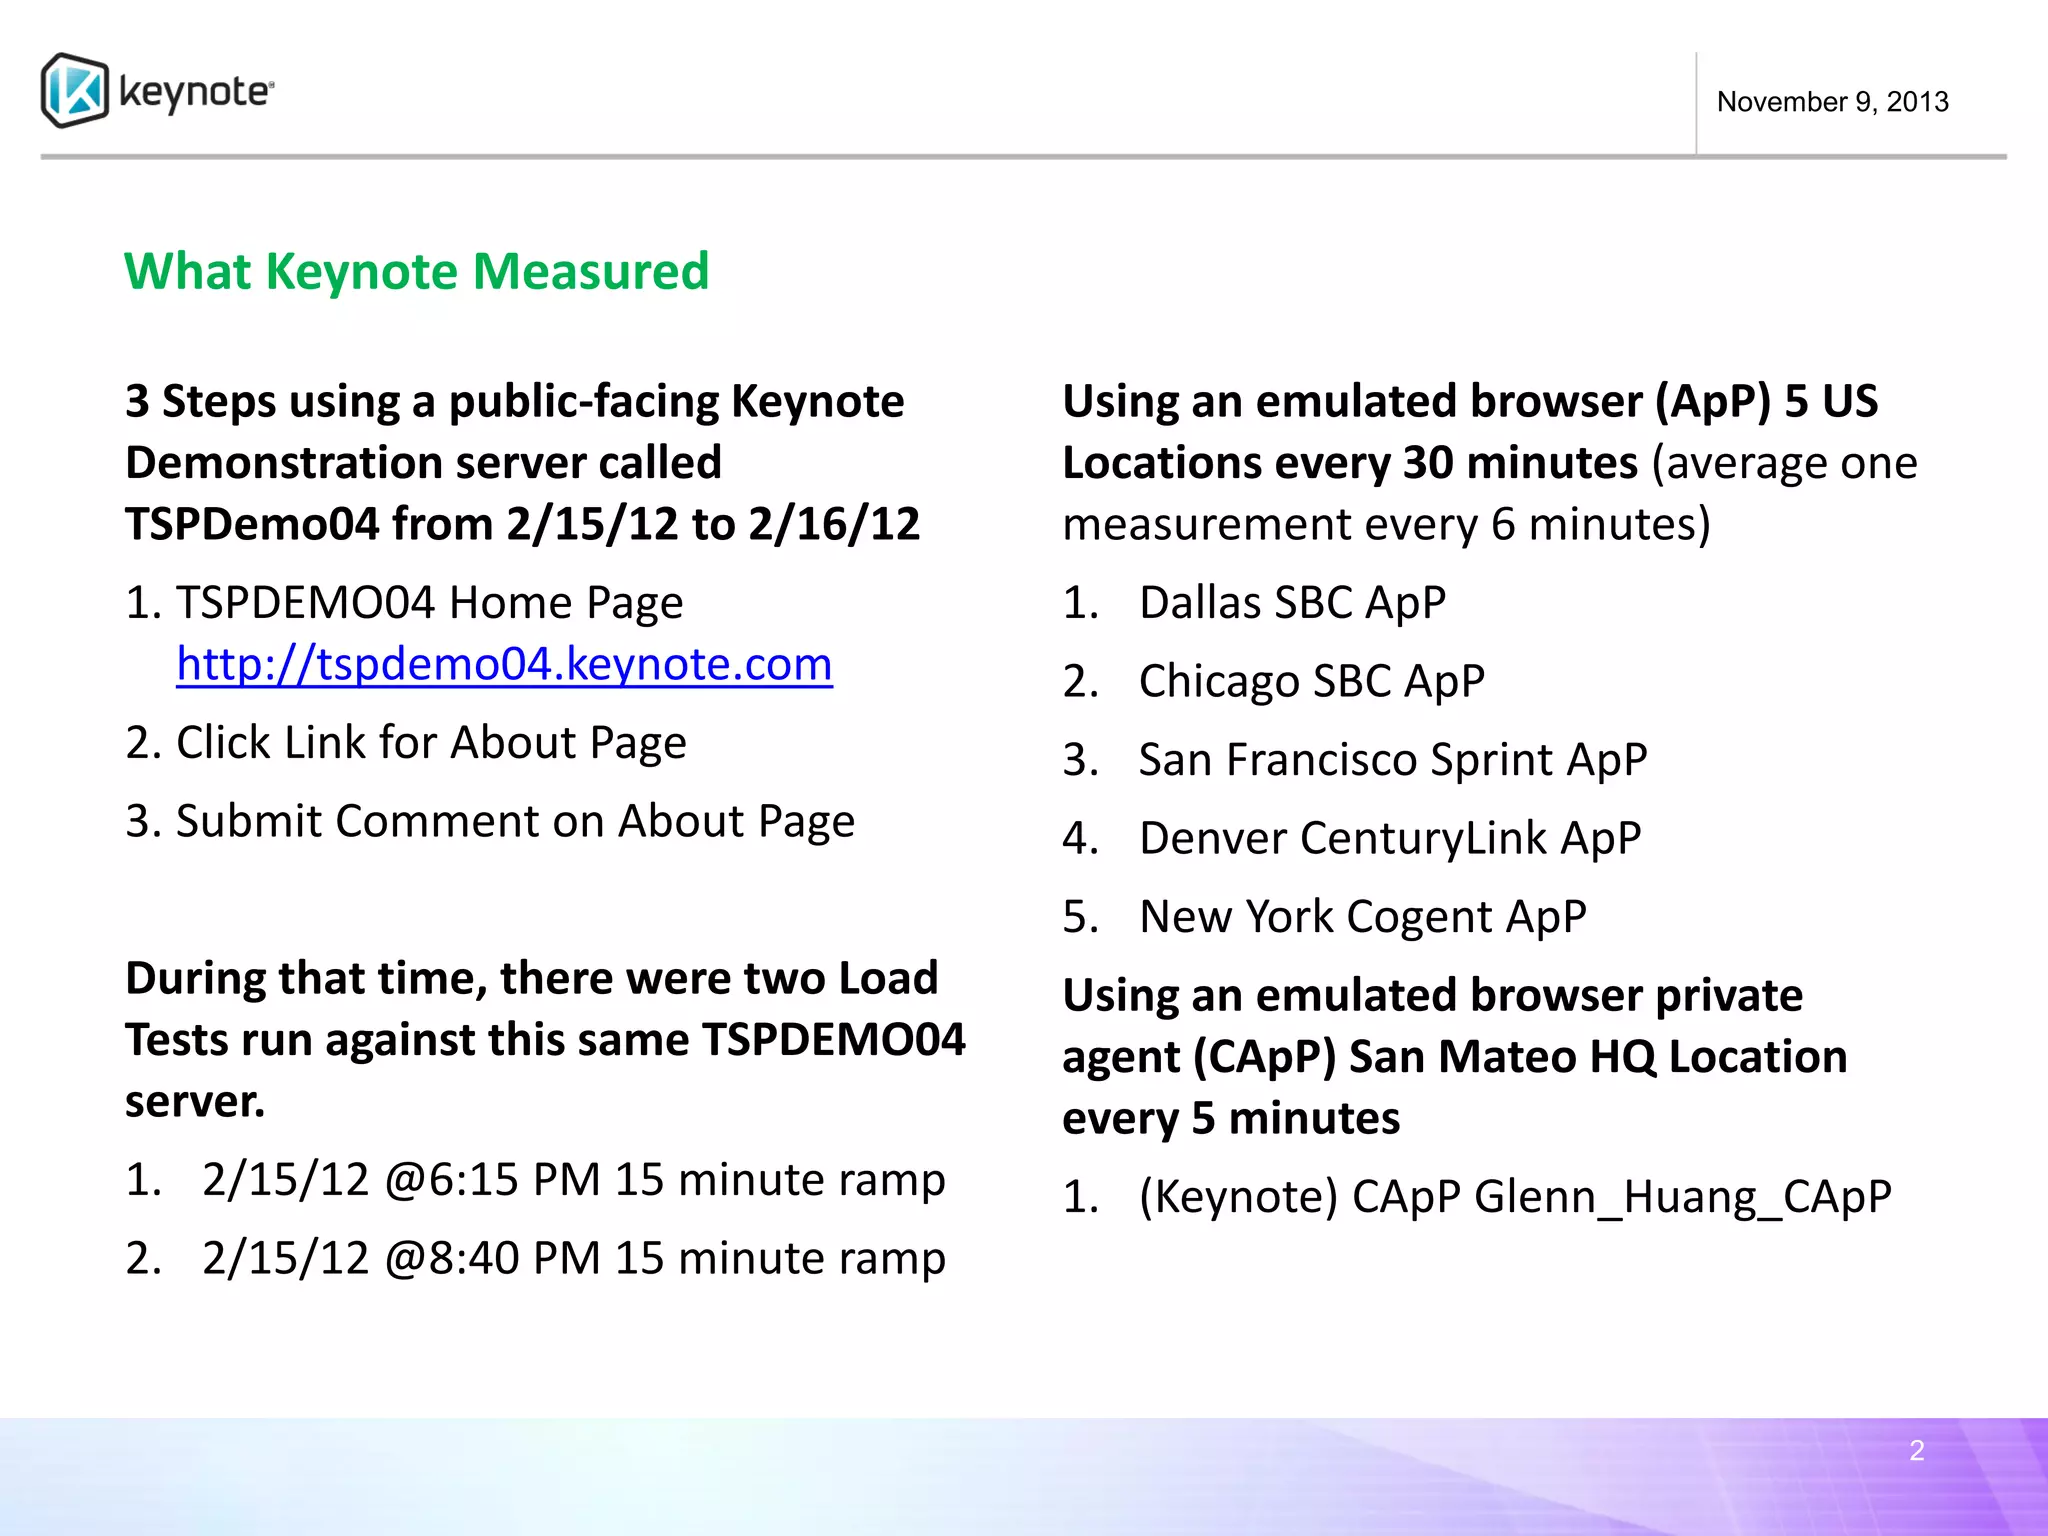
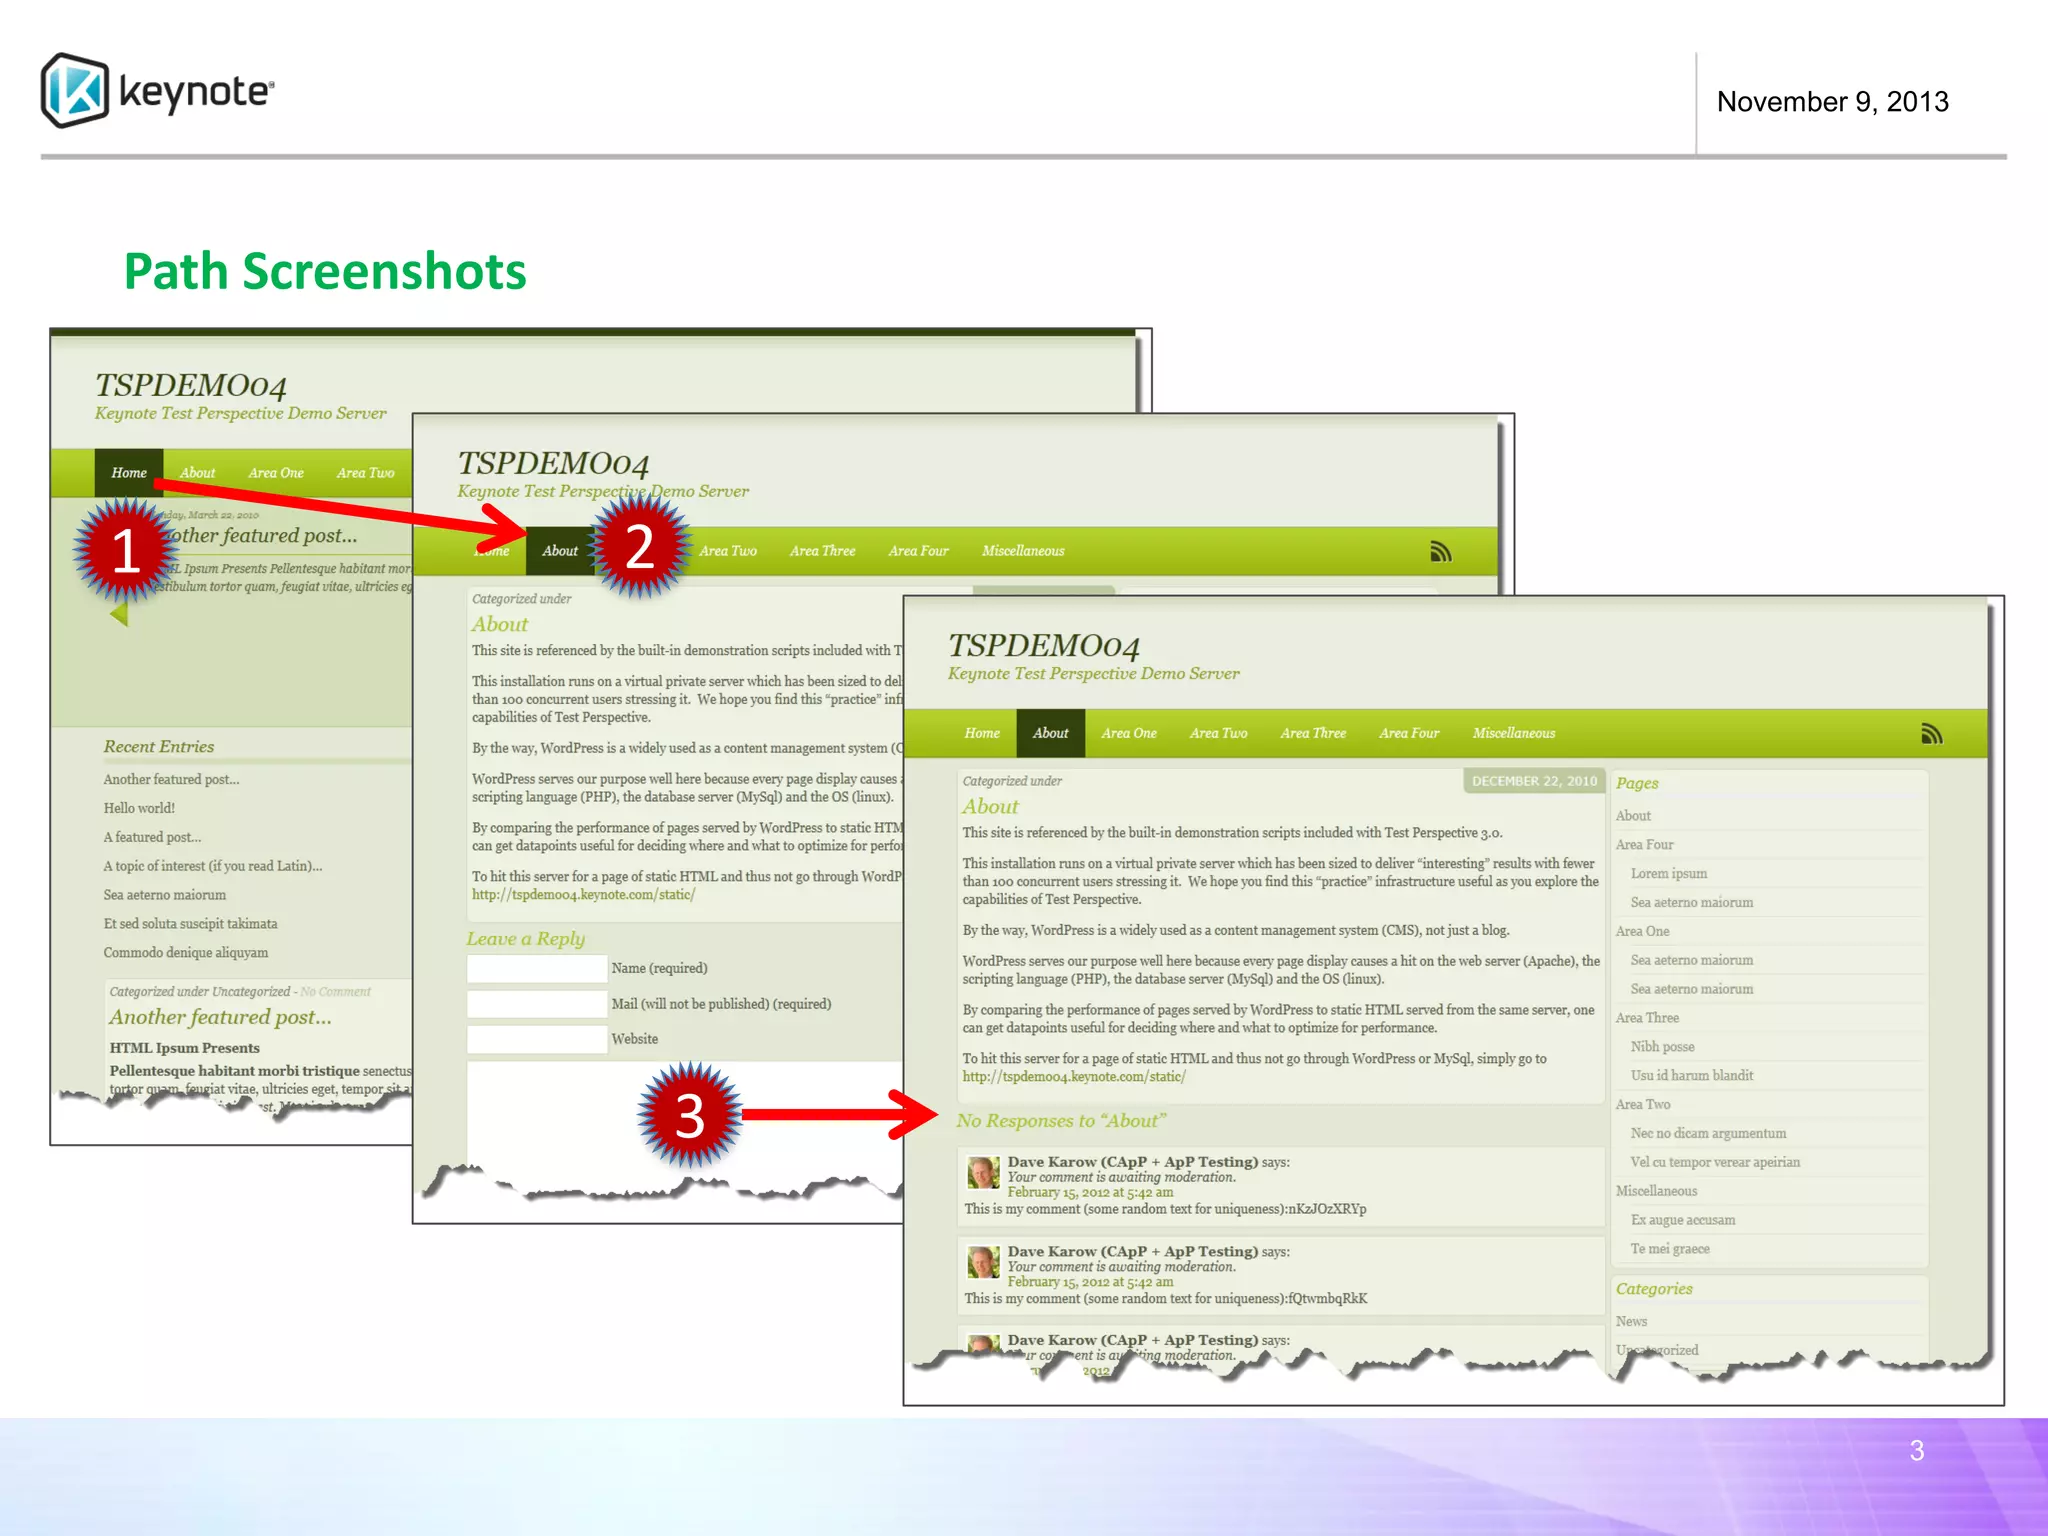
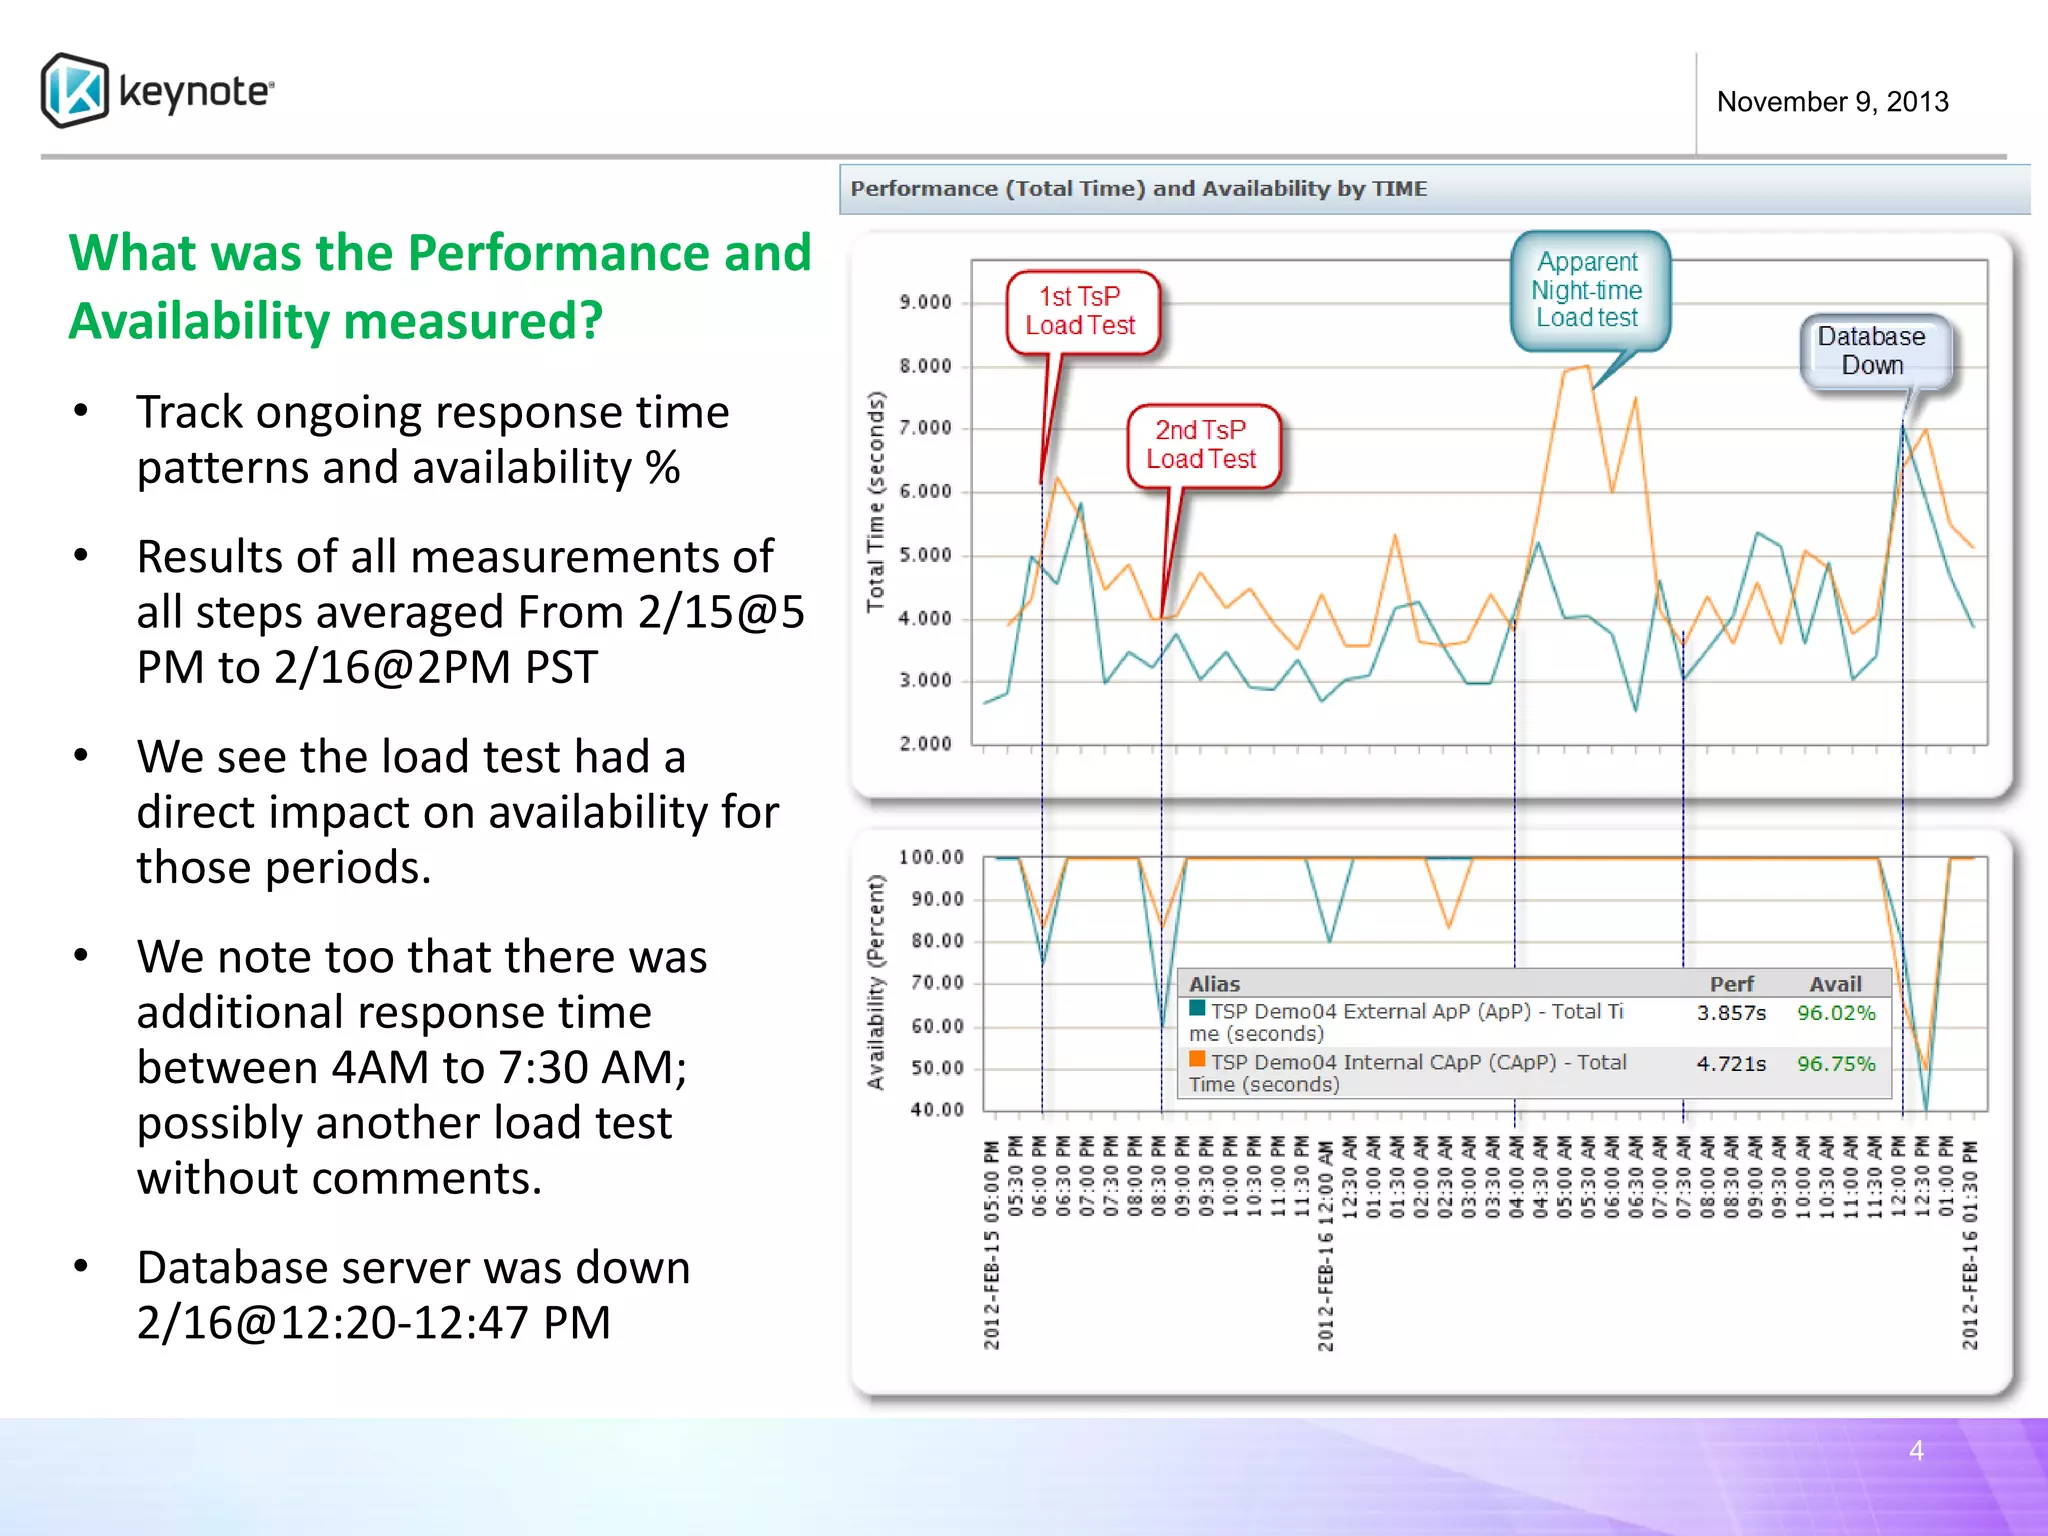
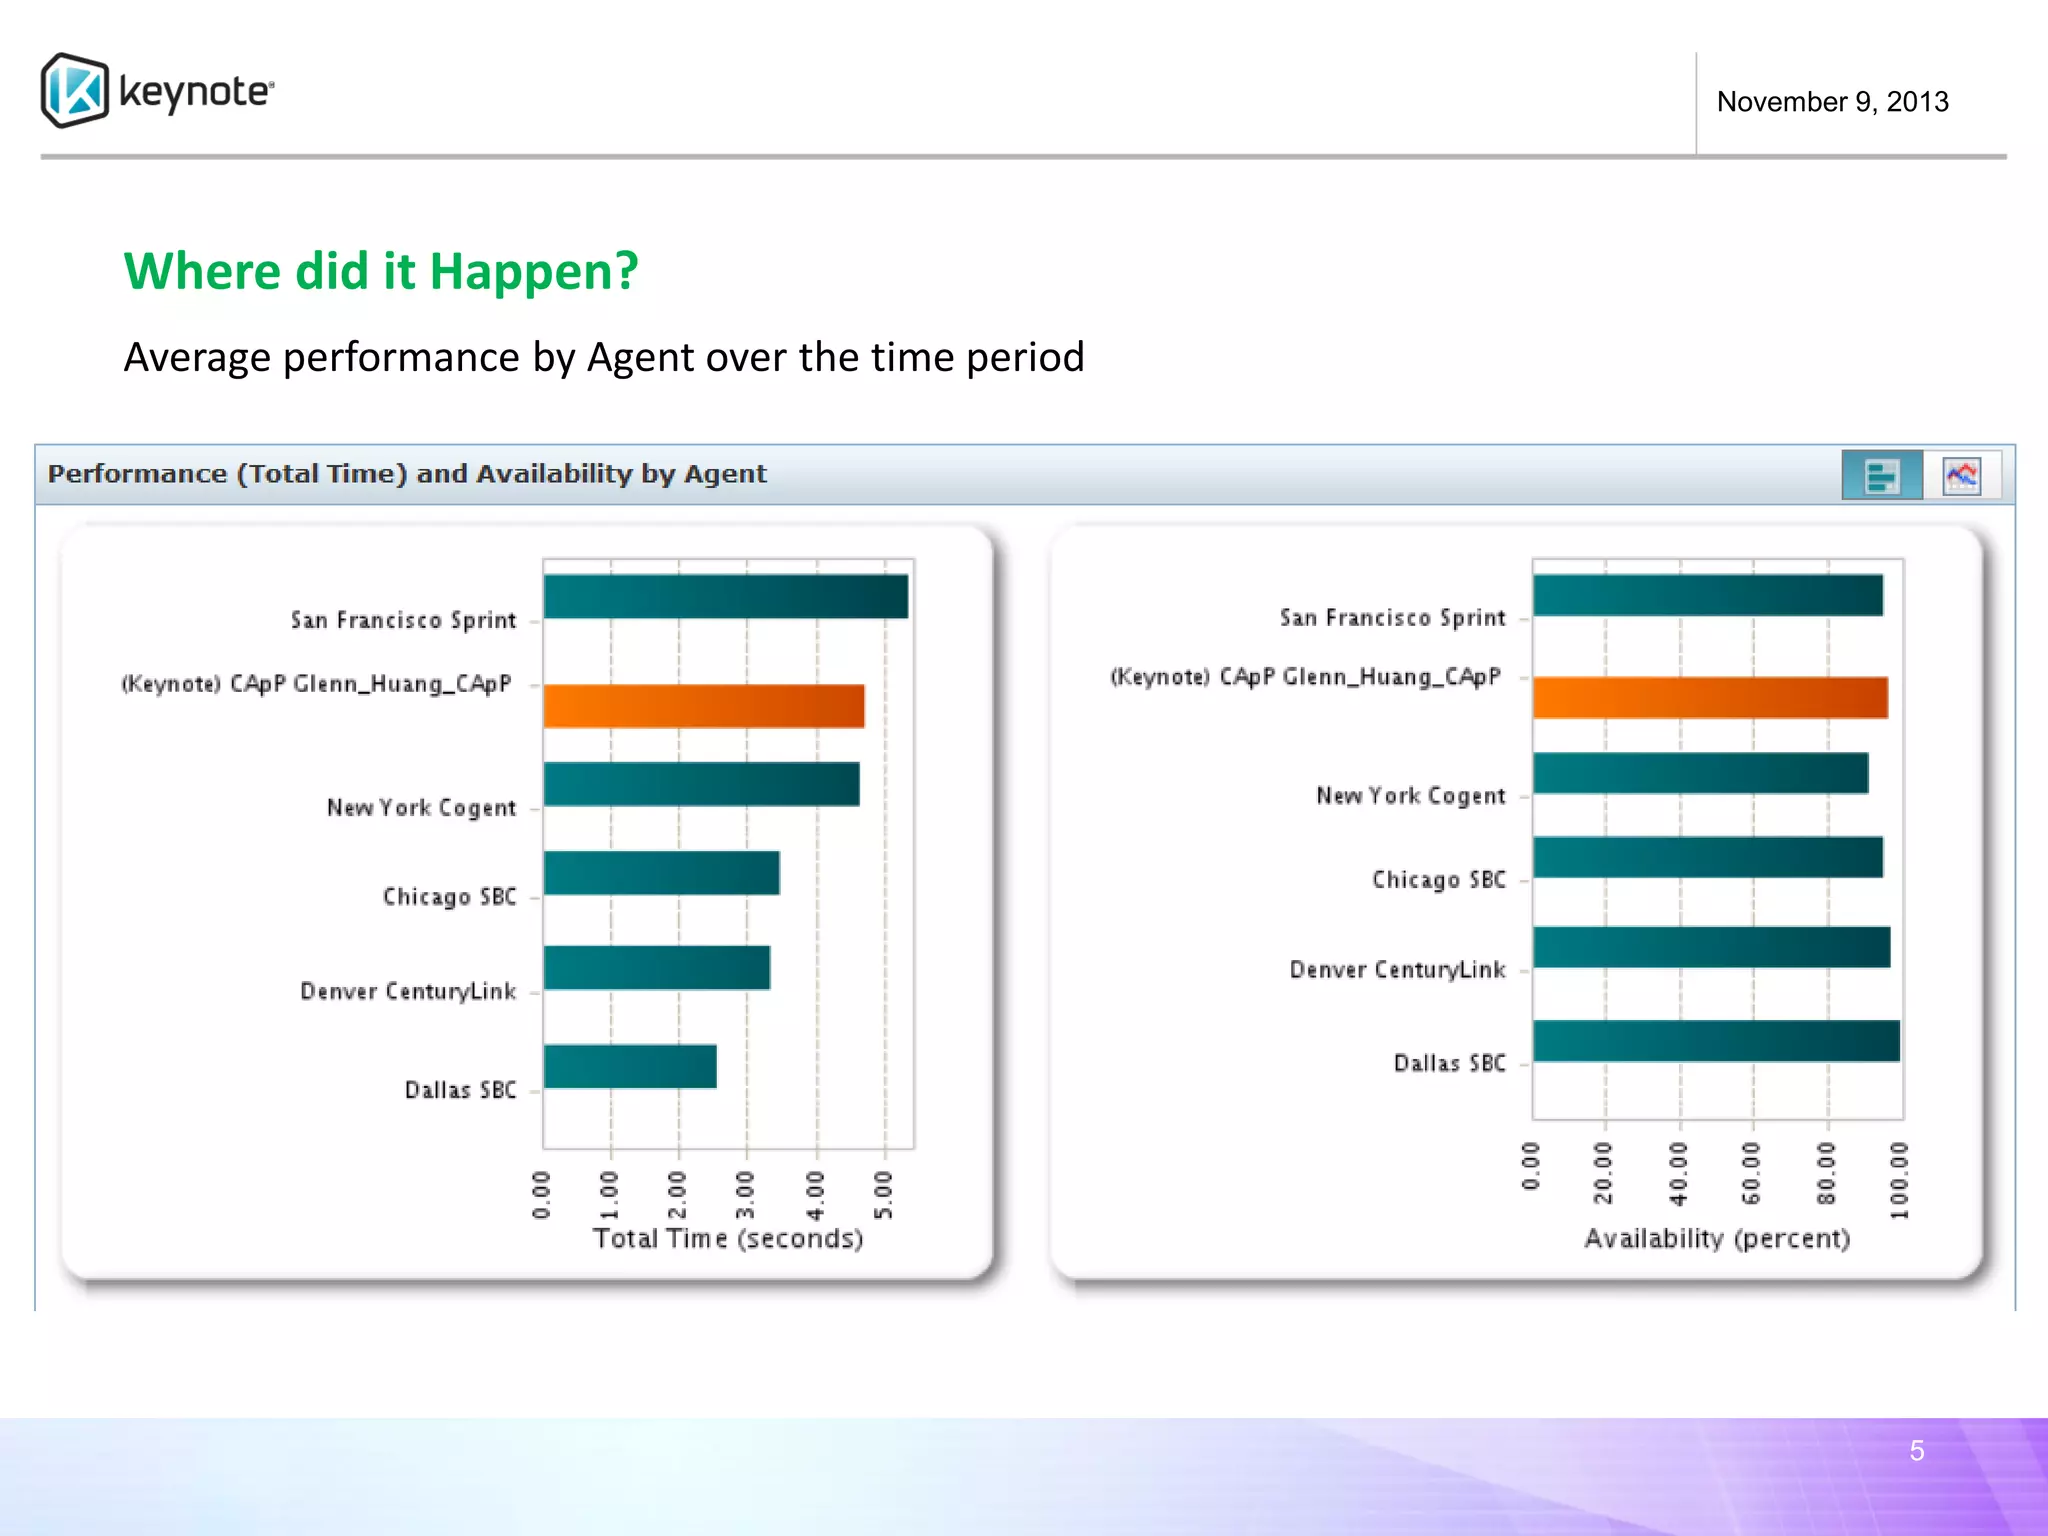
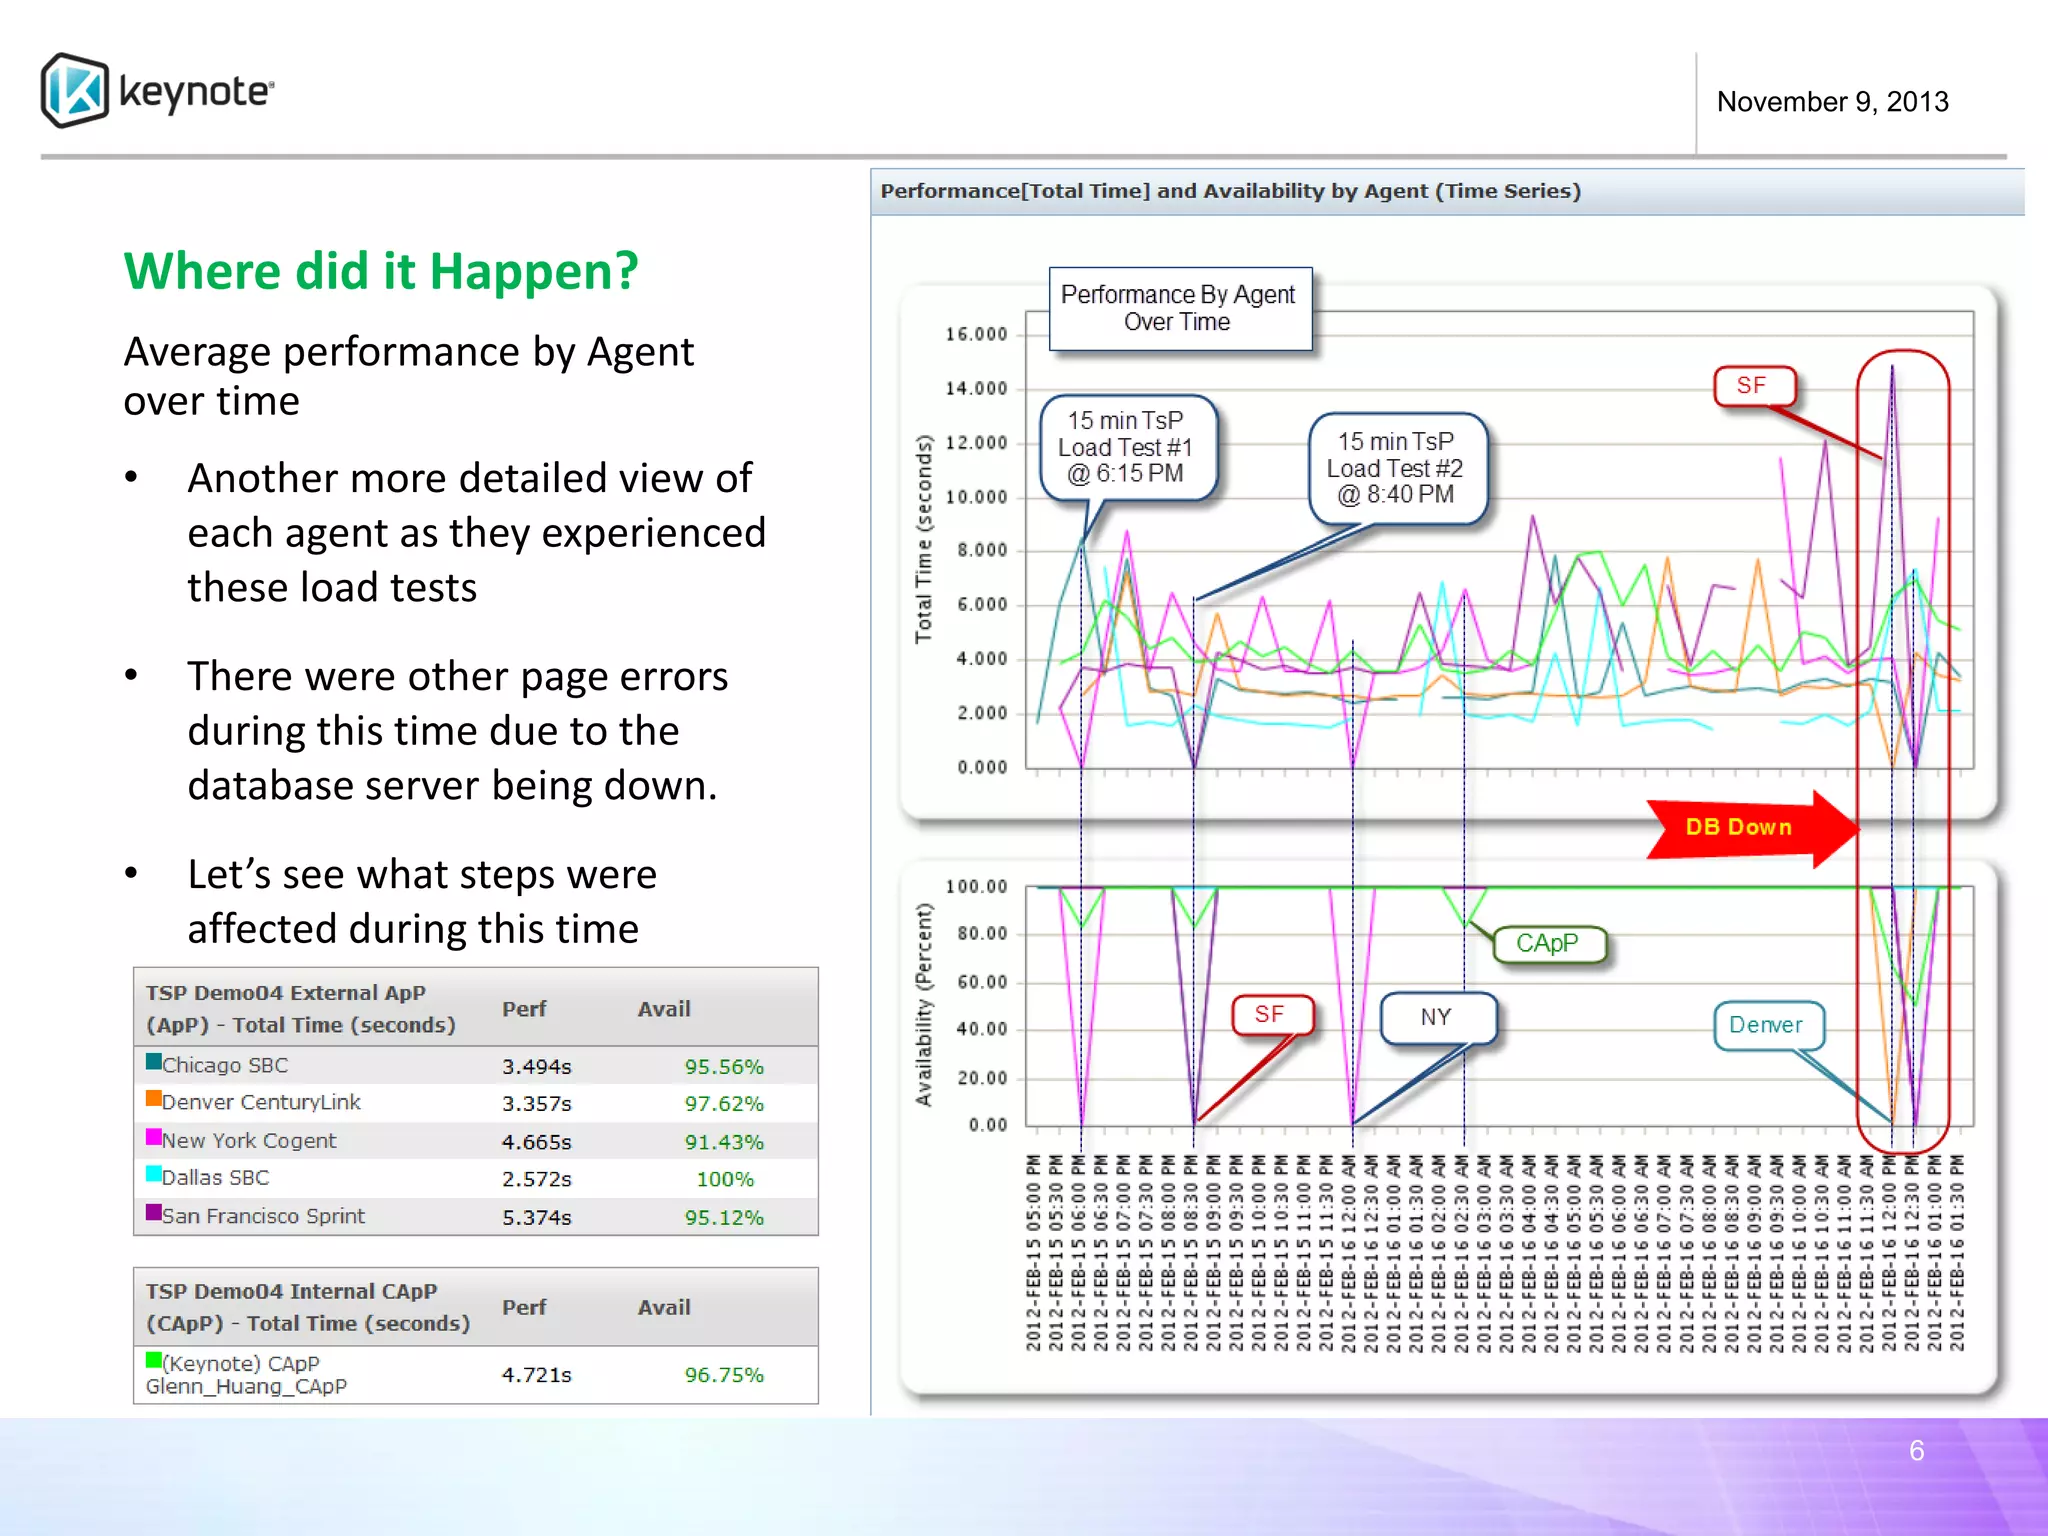
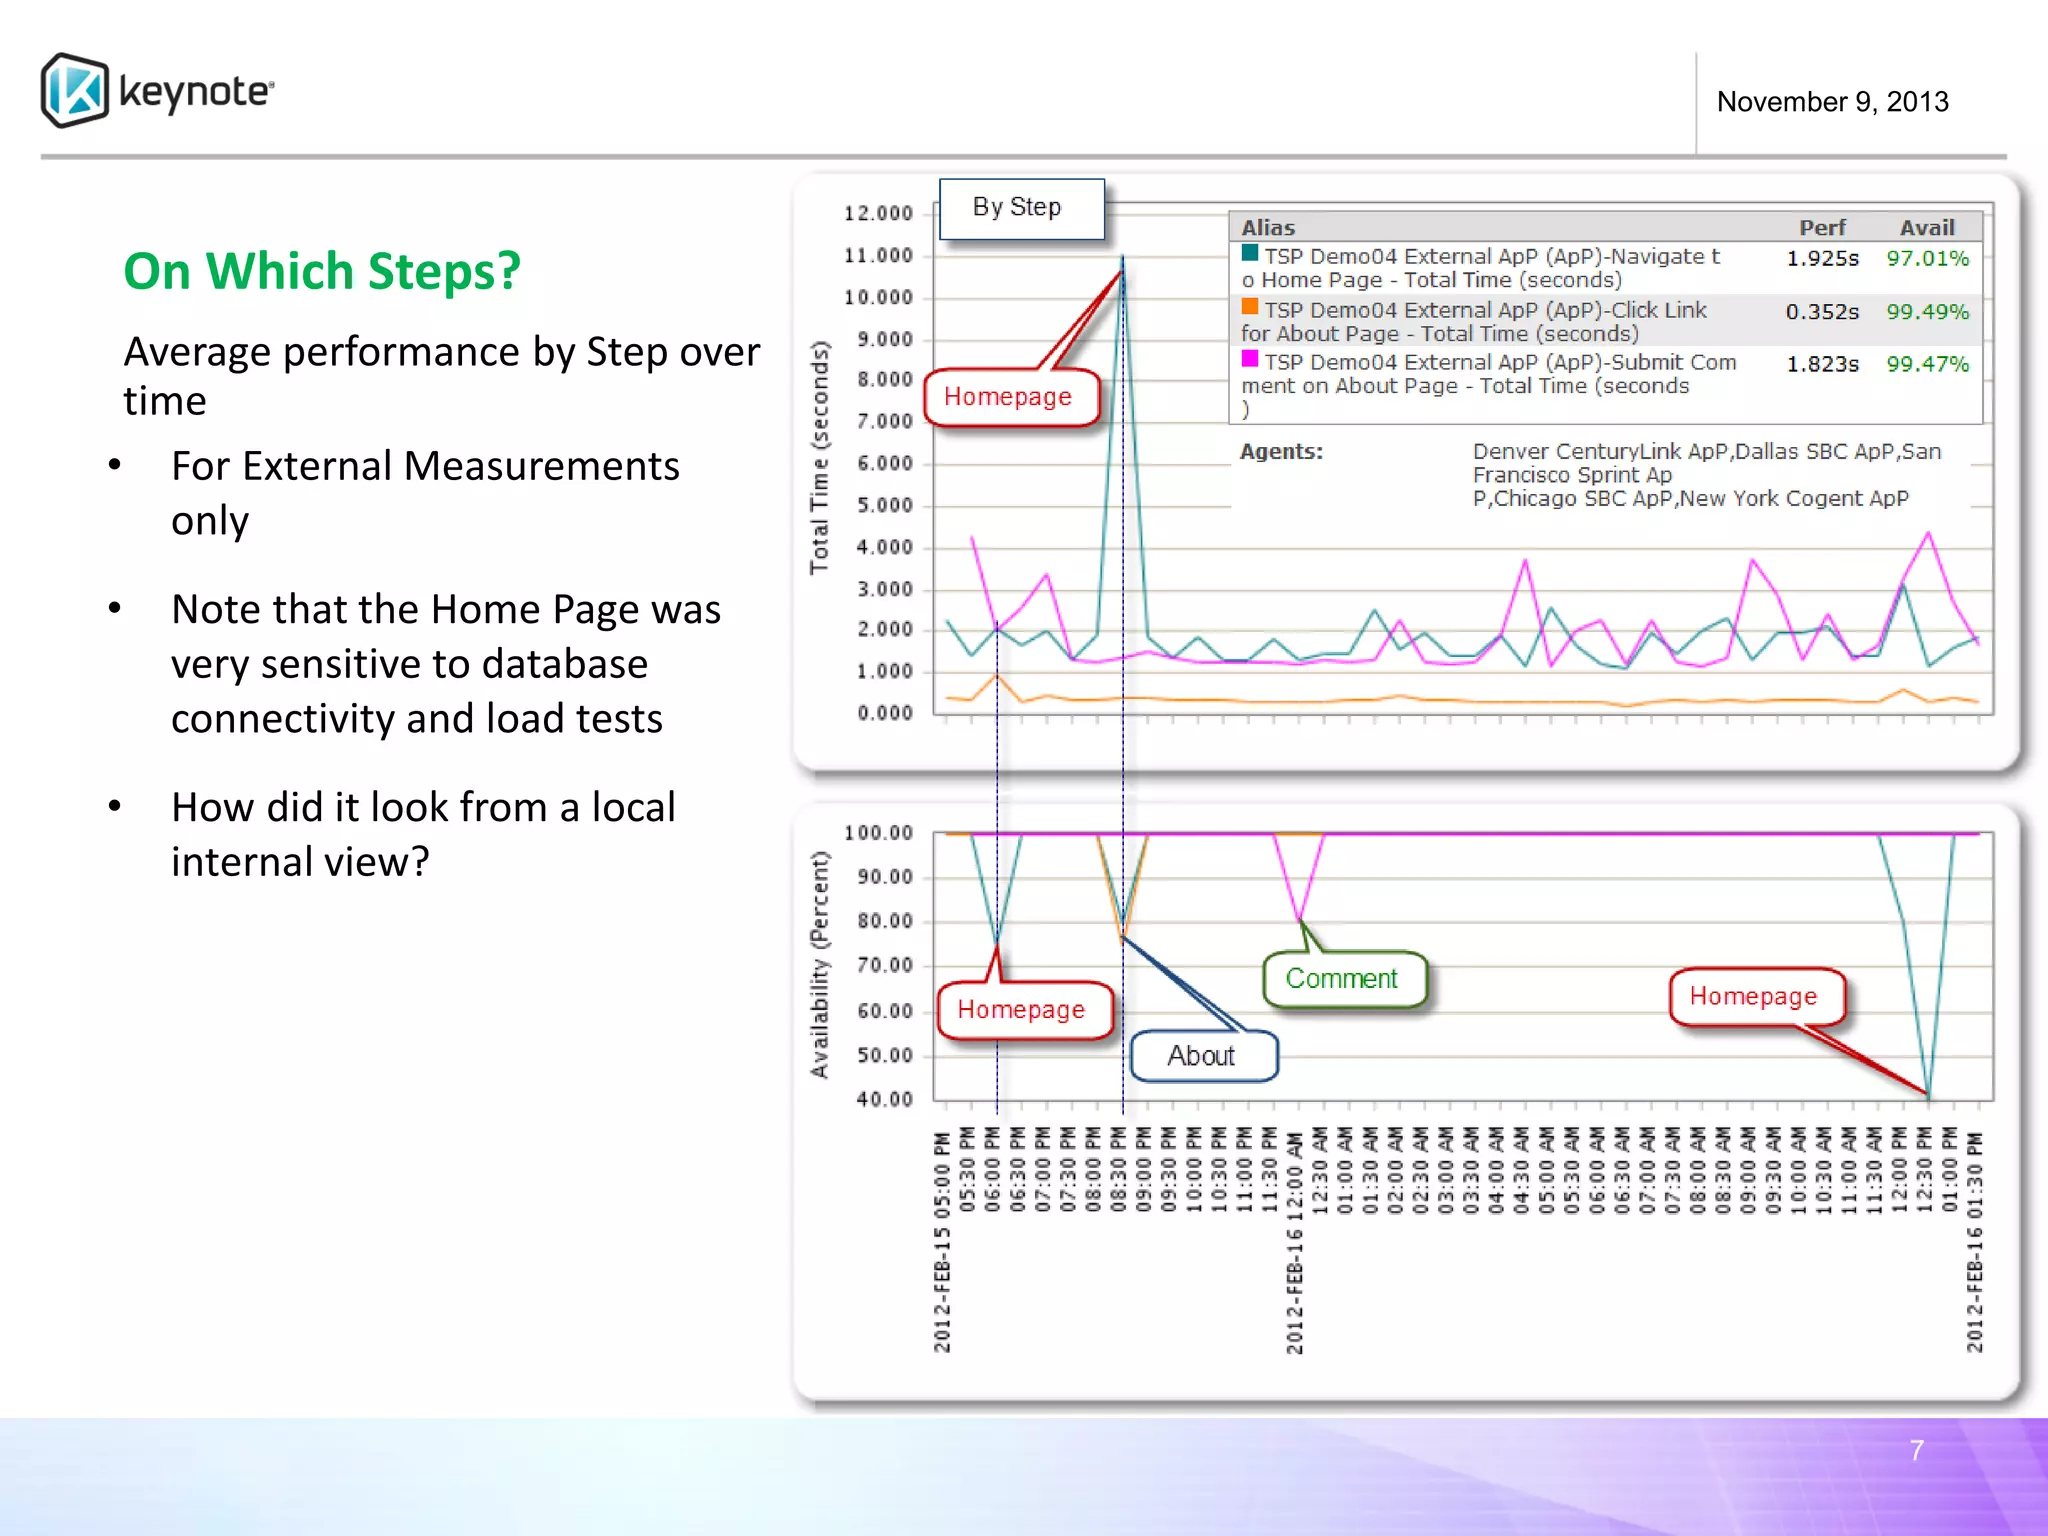
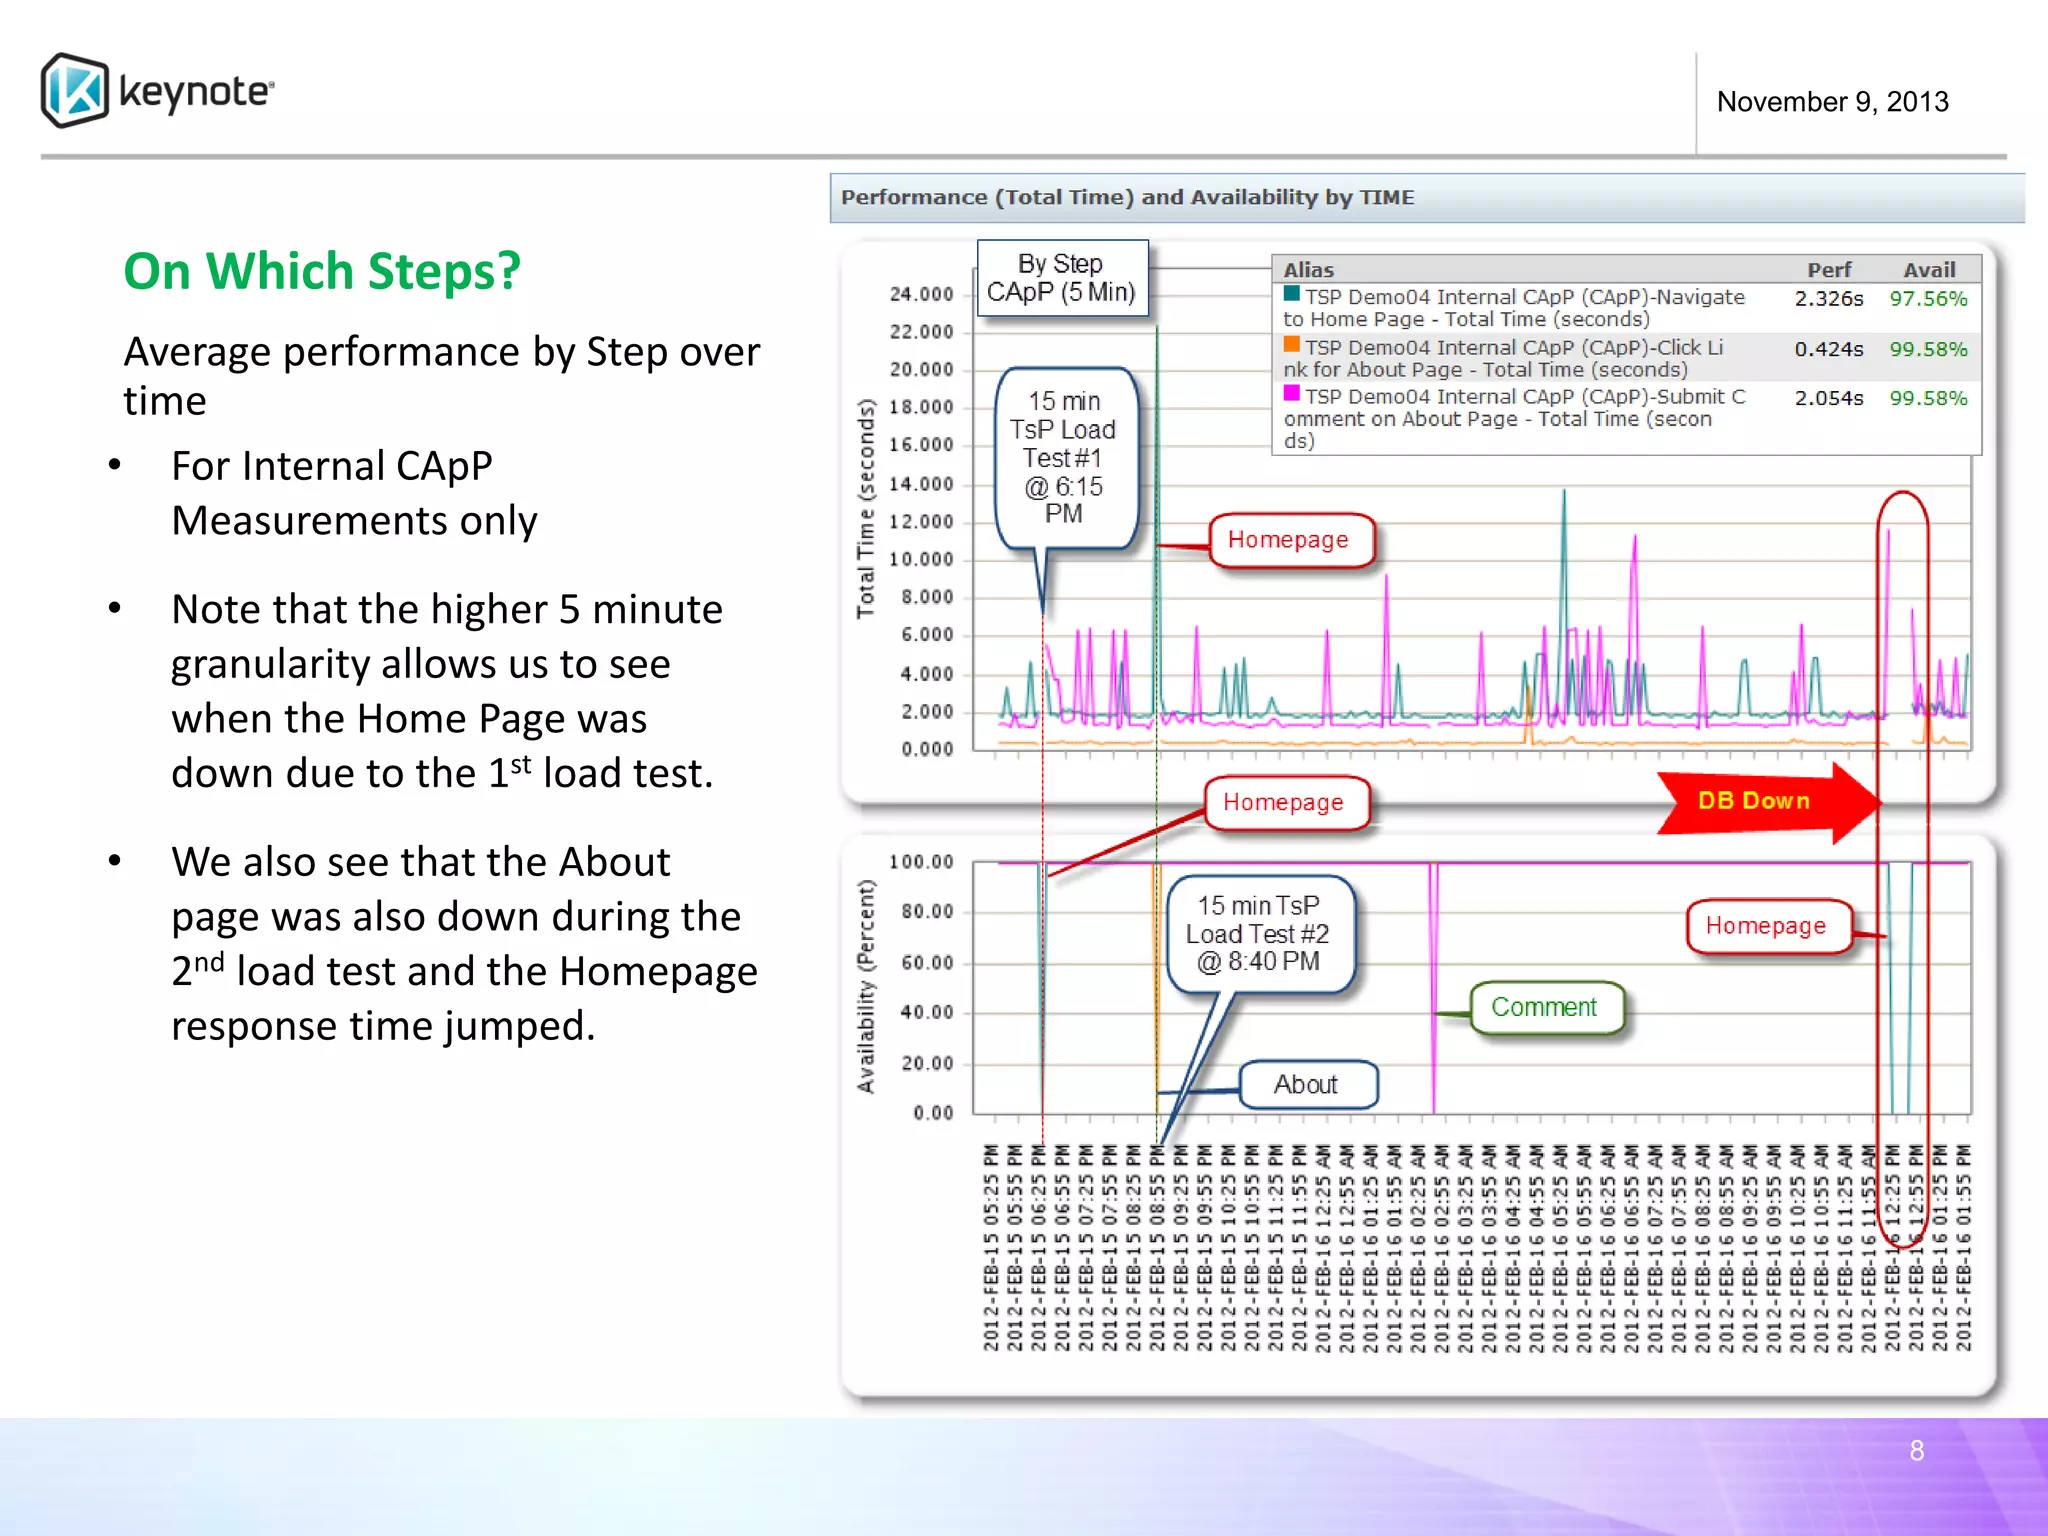
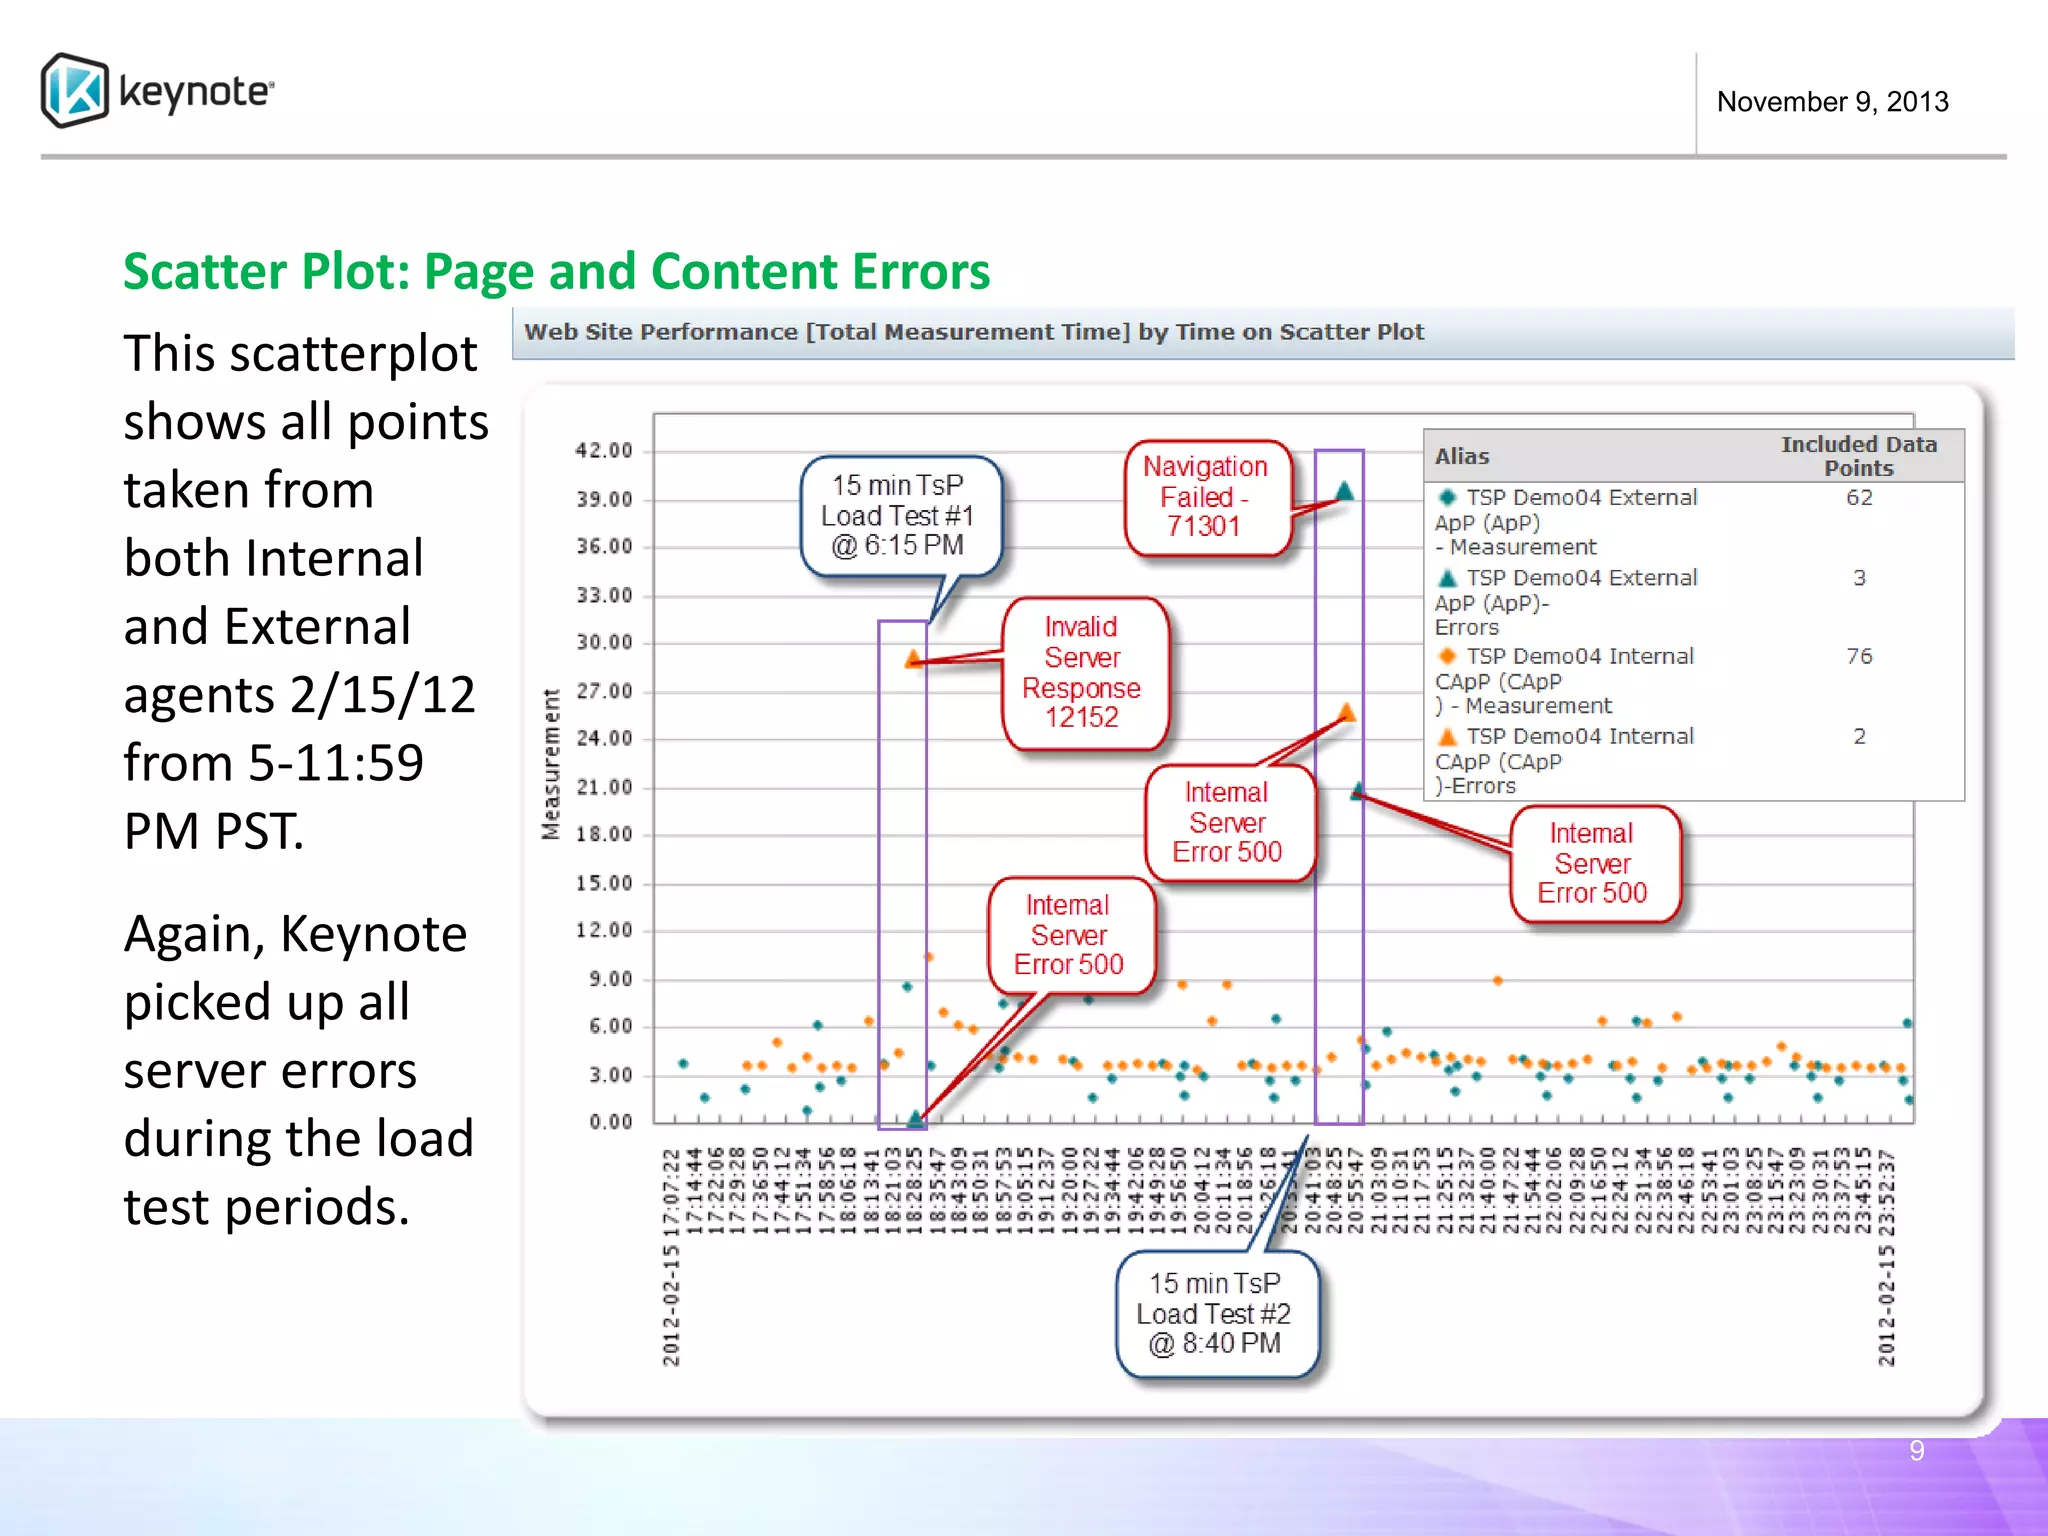
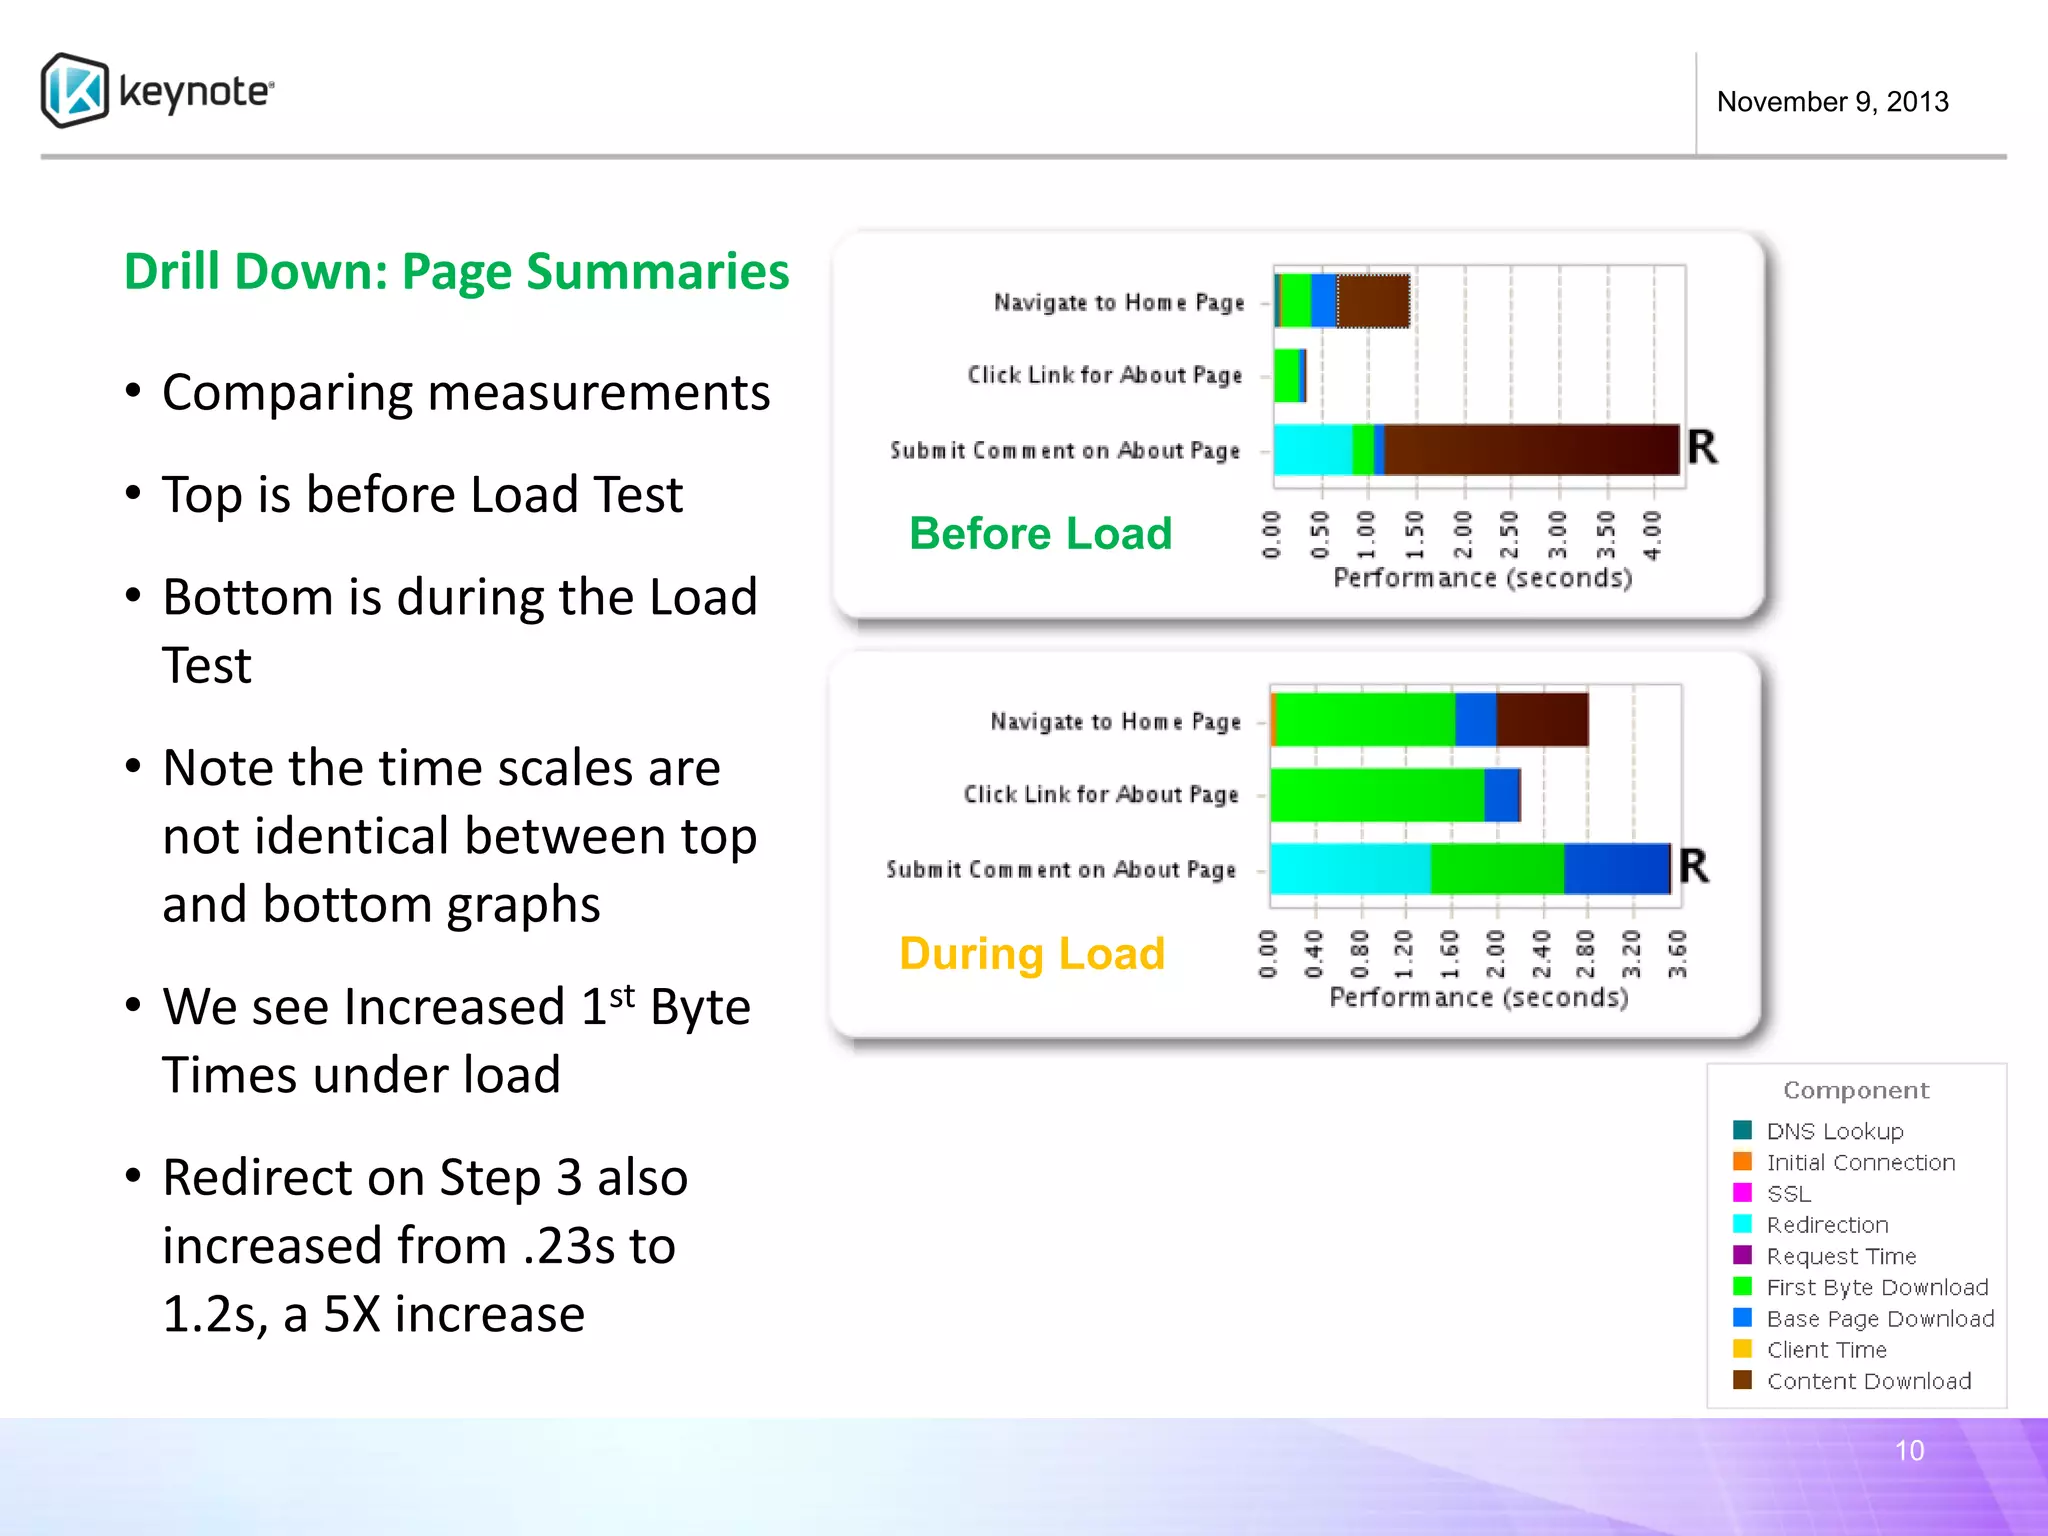
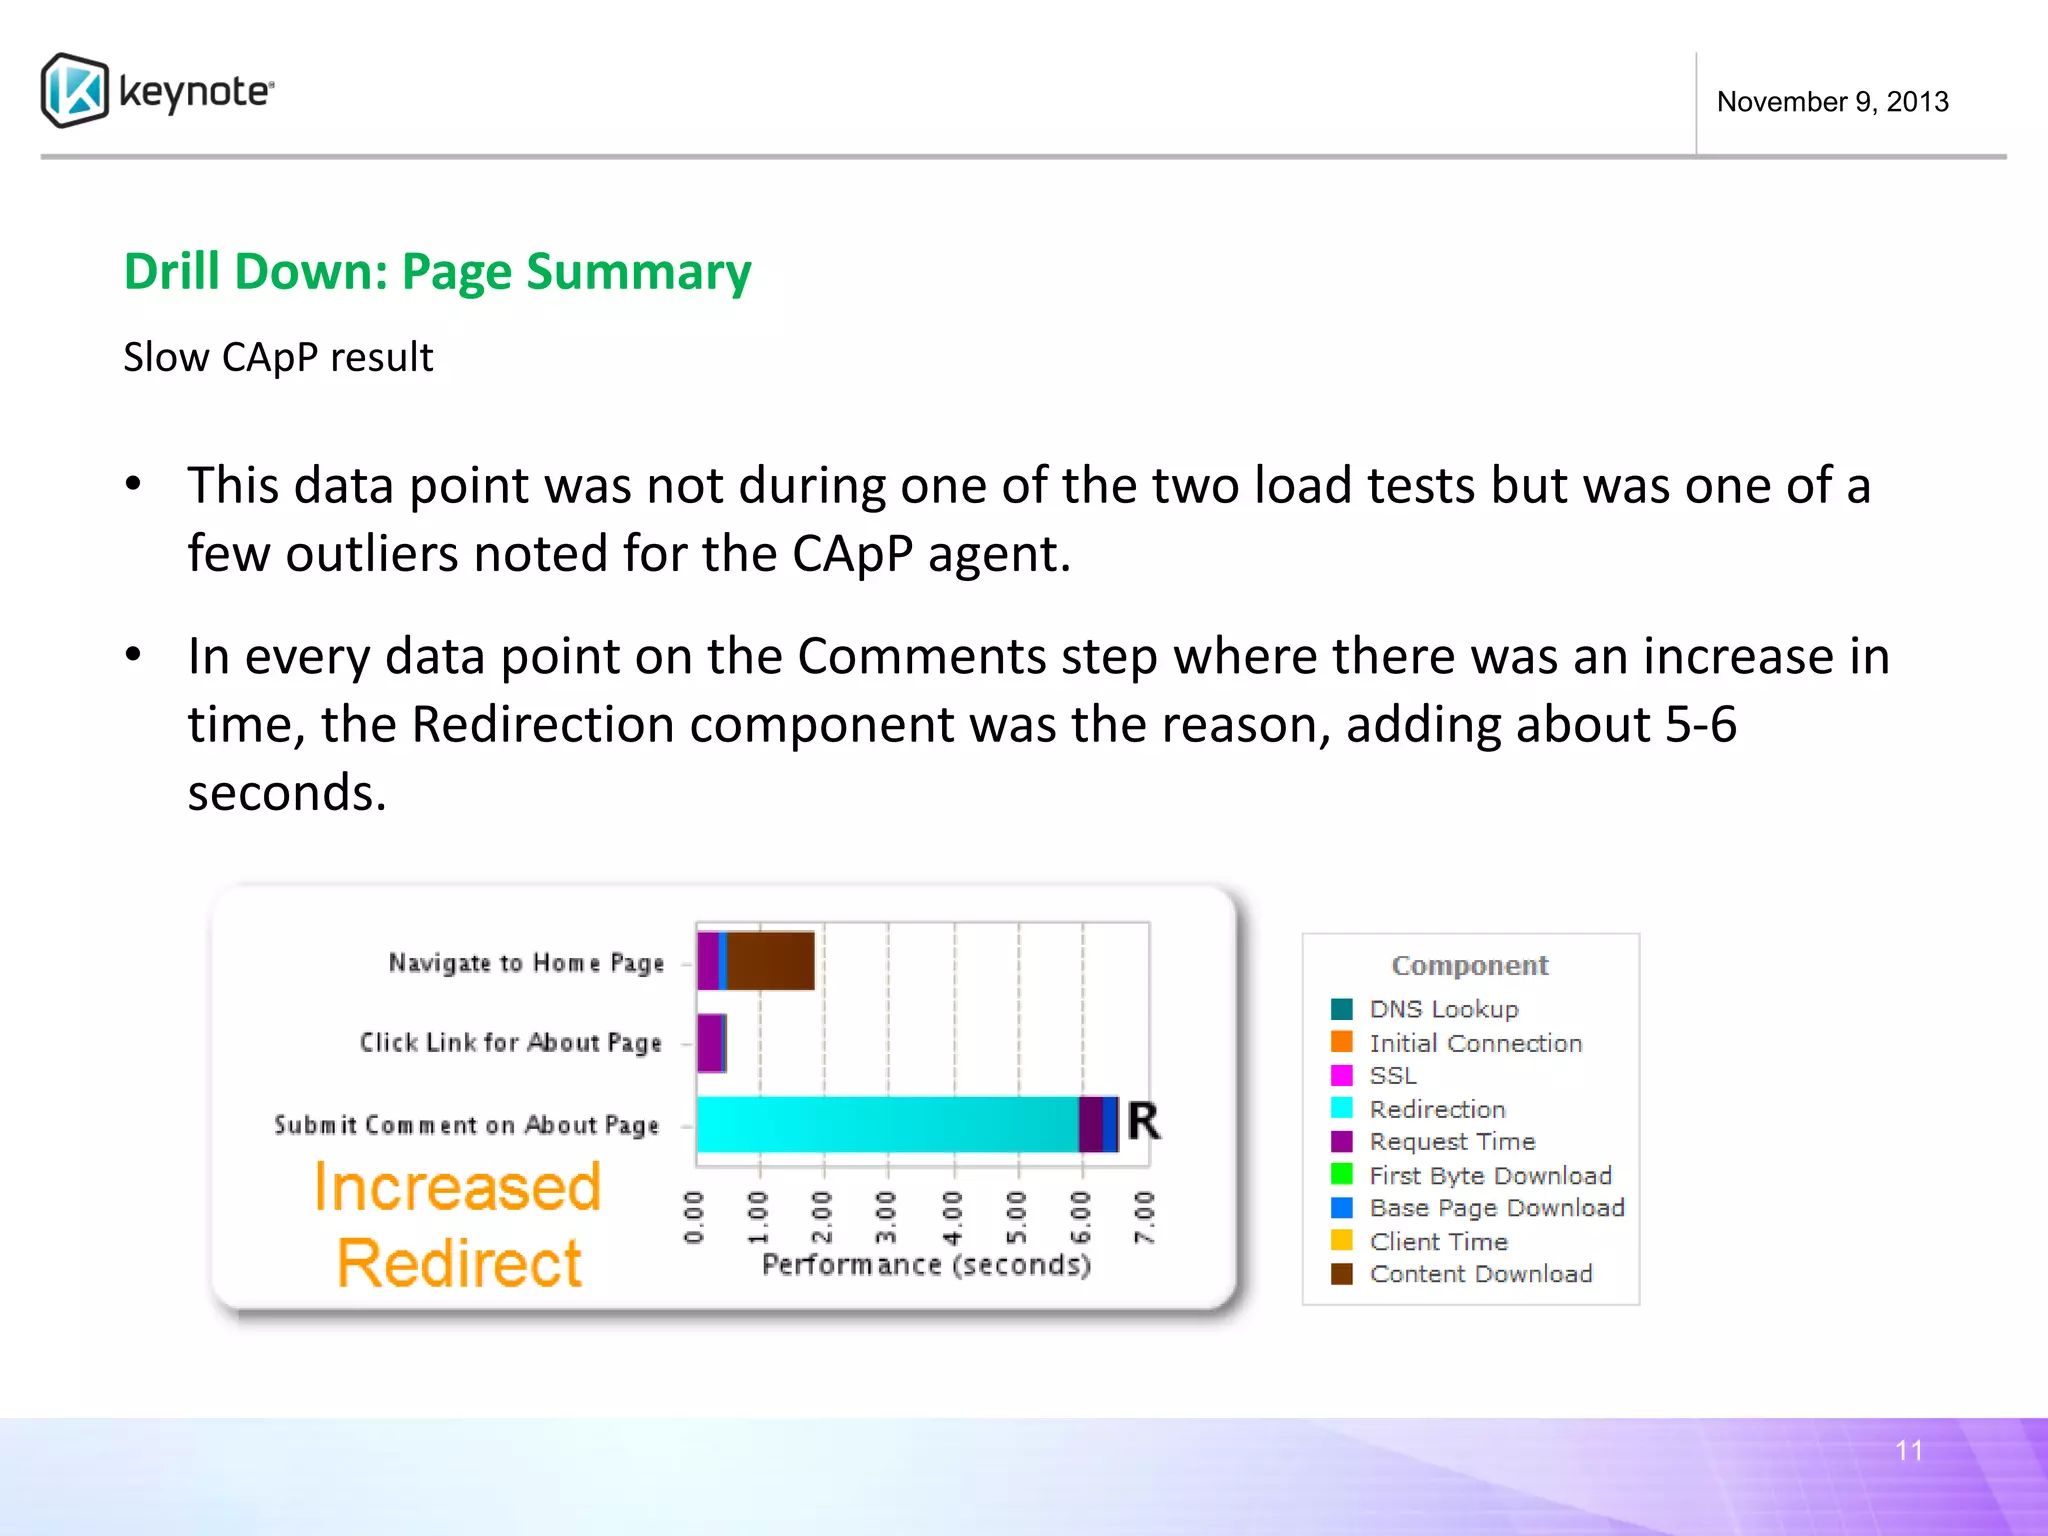
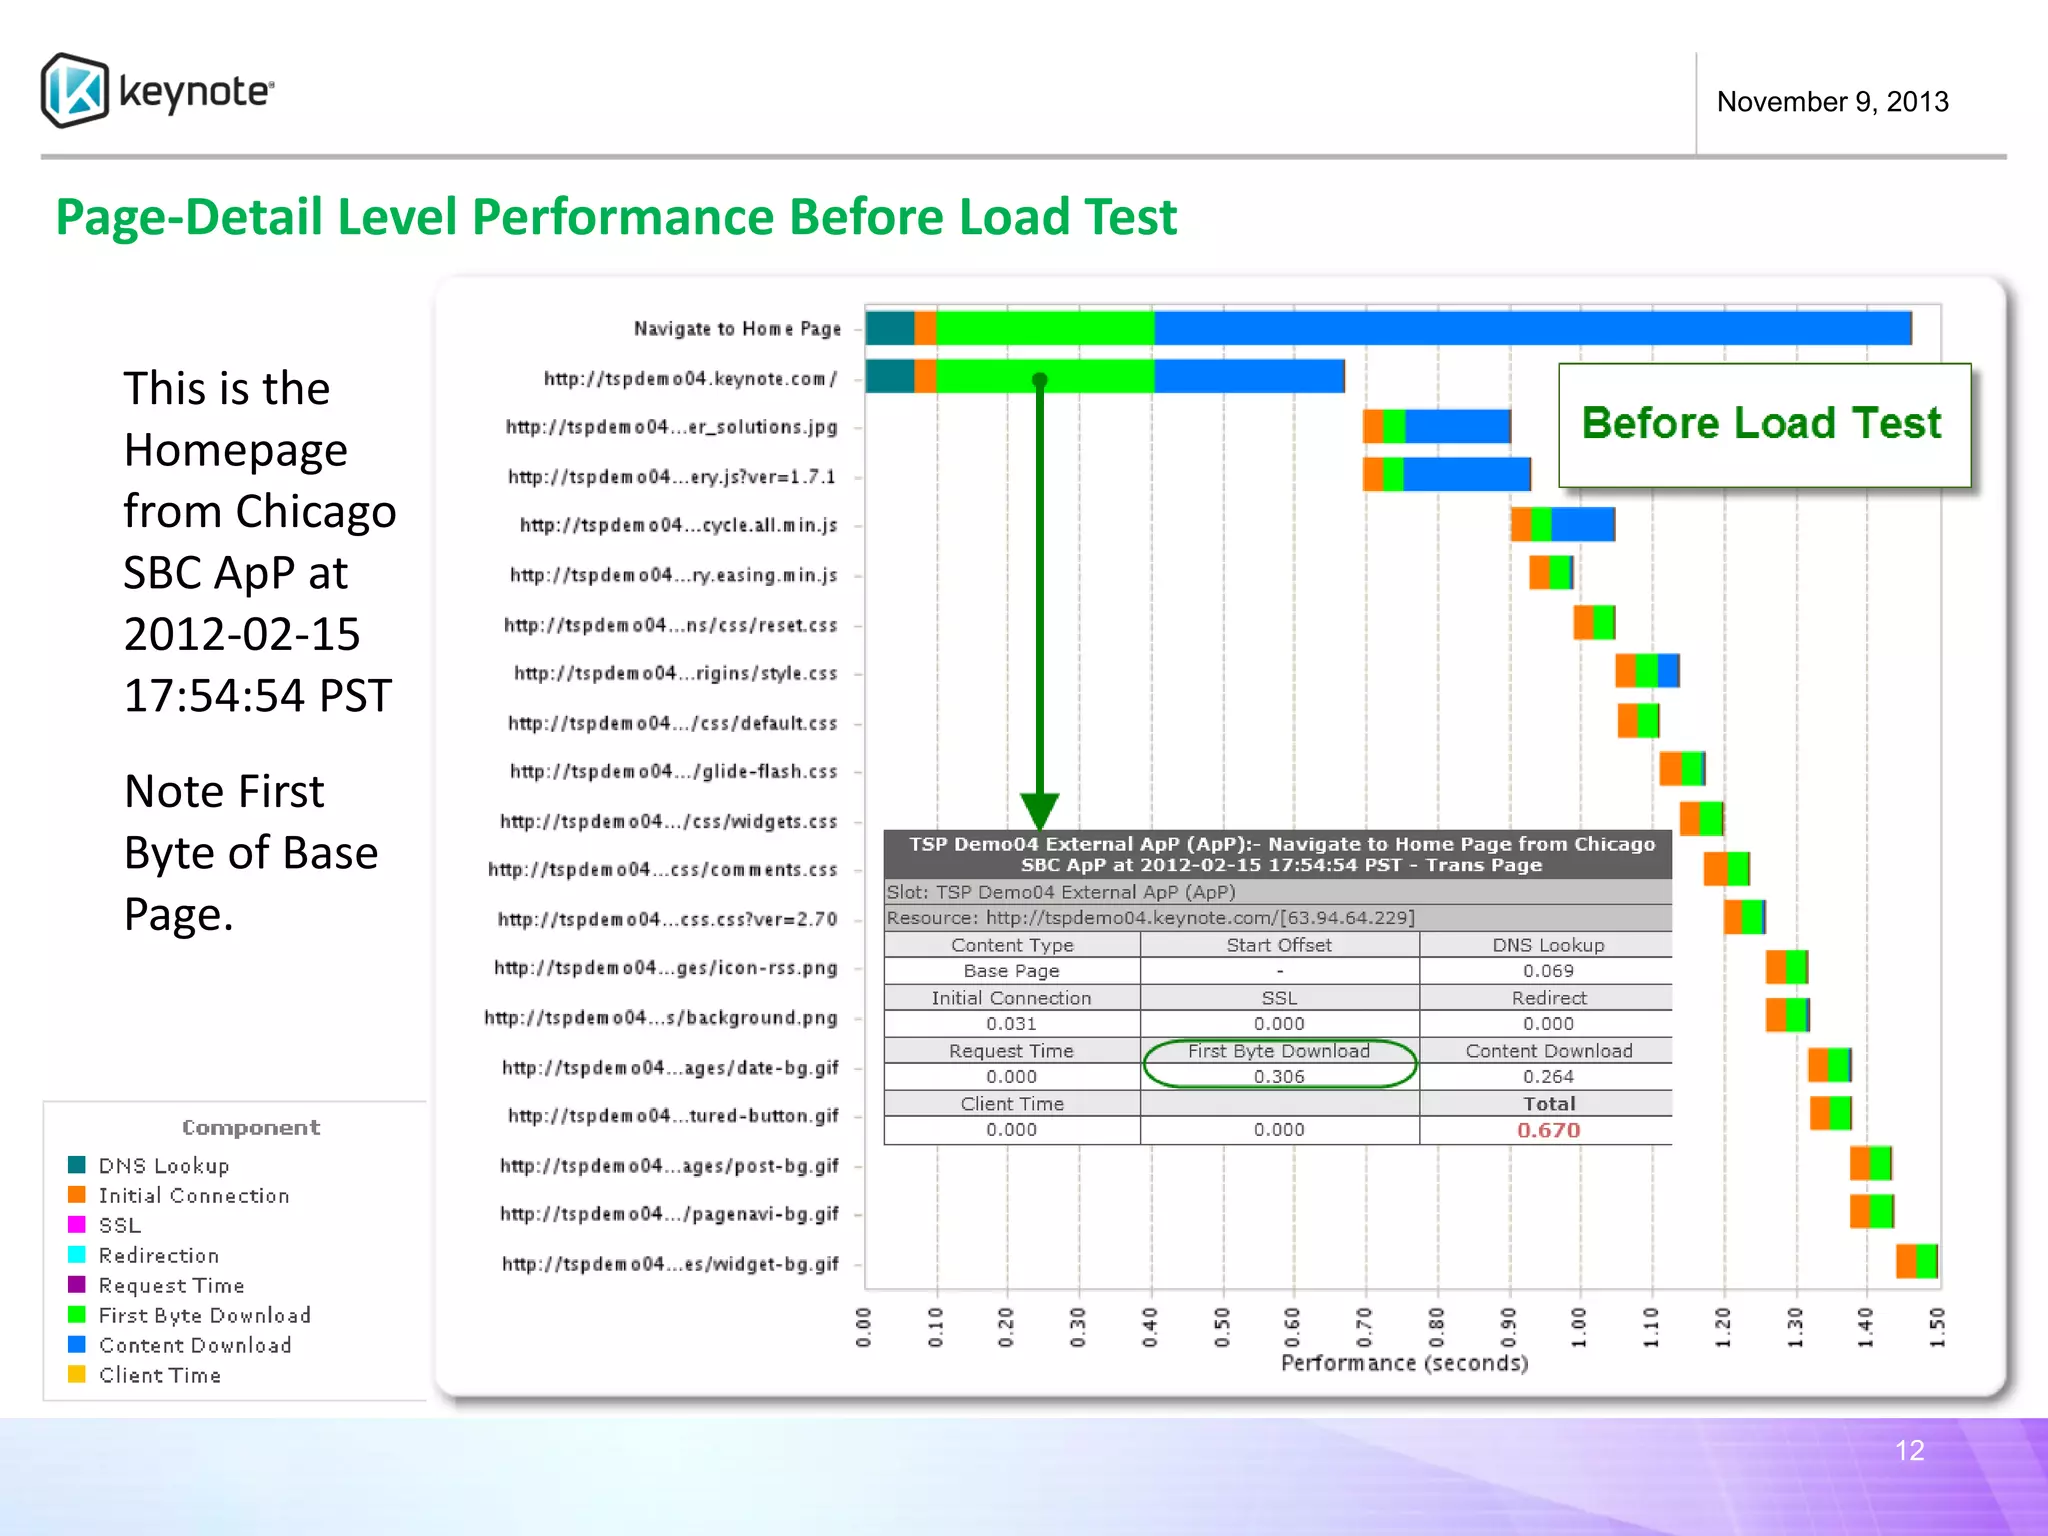
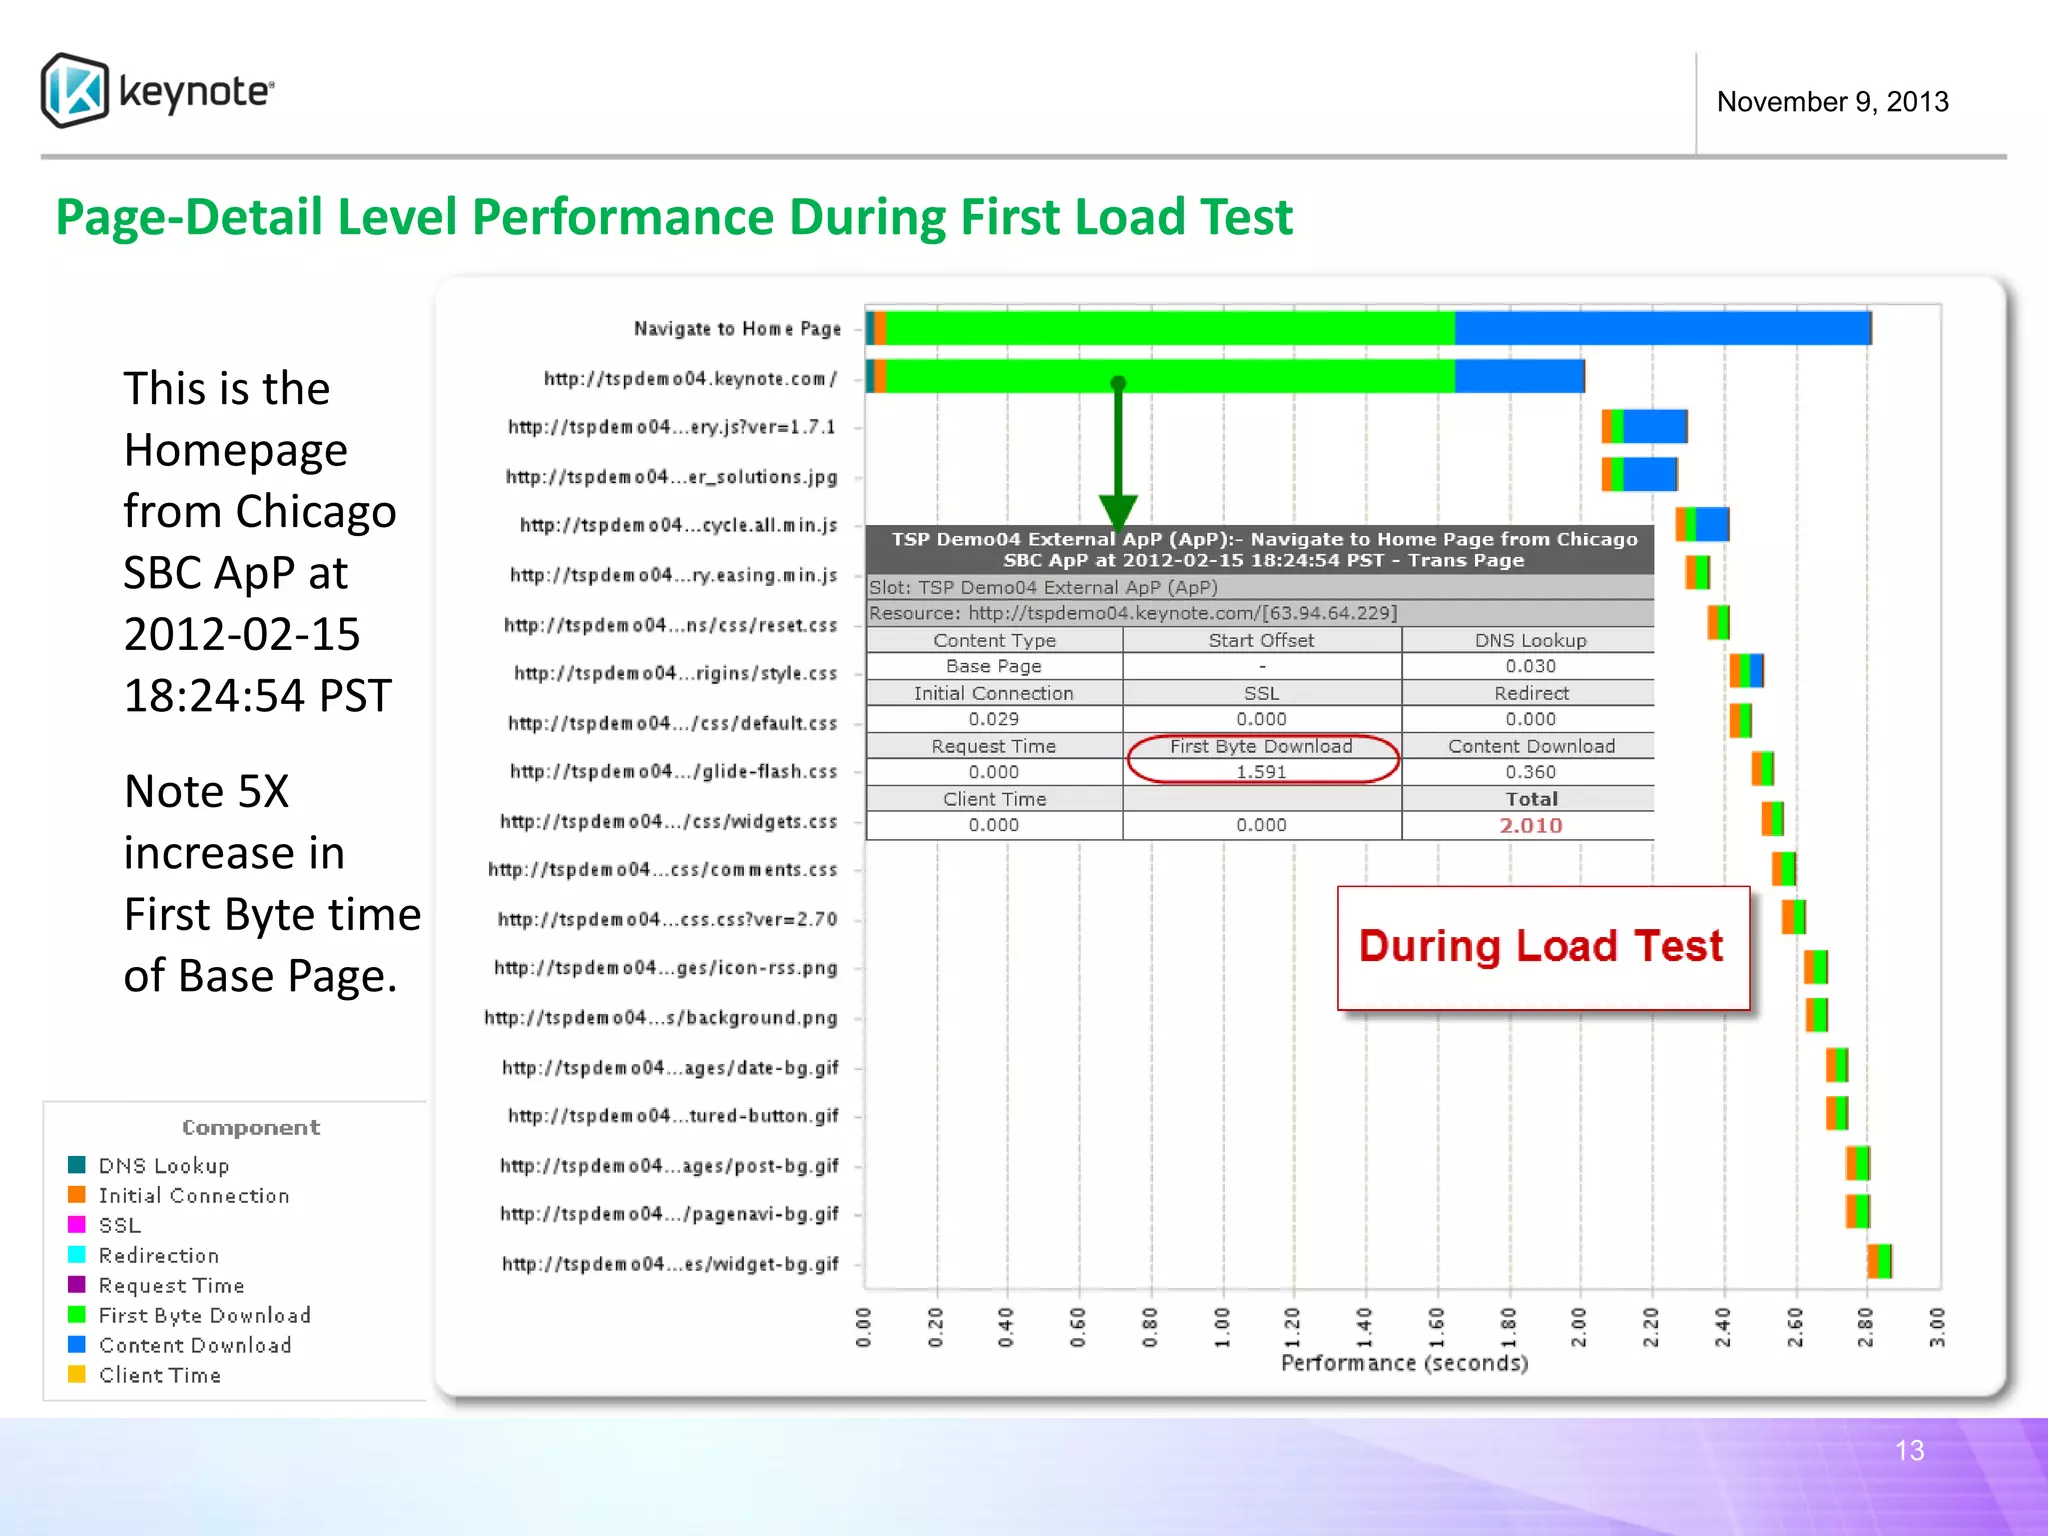

This document summarizes keynote monitoring of a demo server over two days. It measured response times and availability from 5 US locations every 30 minutes, and internally every 5 minutes. There were two load tests run against the server that decreased availability and increased response times, particularly for the home page. The internal measurements showed specific steps like the about page being impacted. Overall, the monitoring identified performance issues during the load tests and provided detailed response time data down to the page level.


![]project-open[ OSS Project Mangement](https://cdn.slidesharecdn.com/ss_thumbnails/poprojectmangement080522-1211906174541304-8-thumbnail.jpg?width=640&height=640&fit=bounds)


