Download as PDF, PPTX


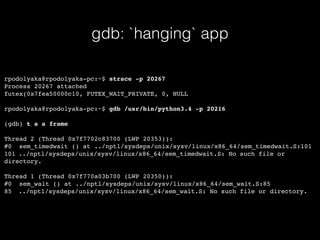
![Typical environment
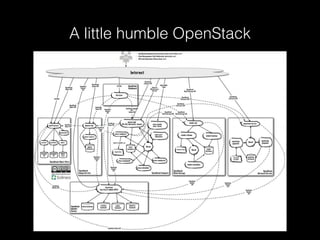
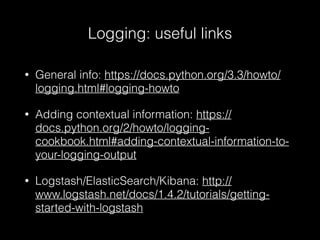
• CentOS 6 or Ubuntu 14.04
• CPython 2.6 or 2.7
• eventlet-based concurrency model for Python
services
• MySQL (Galera), memcache [, MongoDB]
• RabbitMQ](https://image.slidesharecdn.com/kharkivpy-debugging-161002140852/85/Debugging-of-C-Python-applications-4-320.jpg)
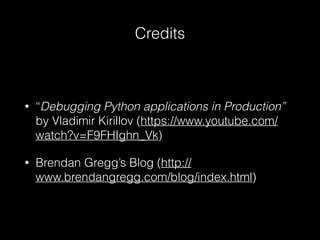

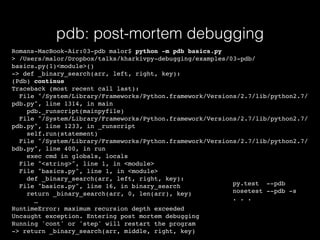
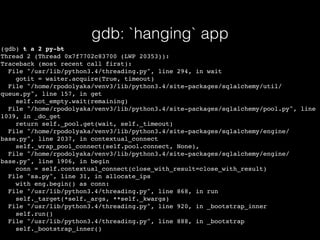
![printf() debugging: python-memcache
def _get_server(self, key):
if isinstance(key, tuple):
serverhash, key = key
else:
serverhash = serverHashFunction(key)
if not self.buckets:
return None, None
for i in range(Client._SERVER_RETRIES):
server = self.buckets[serverhash % len(self.buckets)]
if server.connect():
# print("(using server %s)" % server,)
return server, key
serverhash = serverHashFunction(str(serverhash) + str(i))
return None, None](https://image.slidesharecdn.com/kharkivpy-debugging-161002140852/85/Debugging-of-C-Python-applications-7-320.jpg)
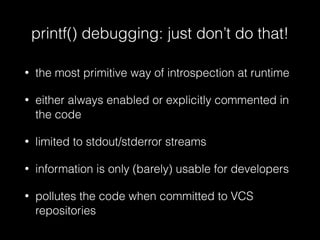

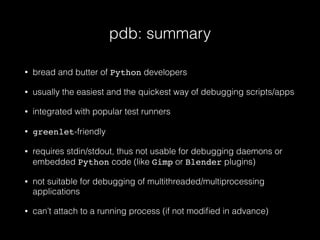
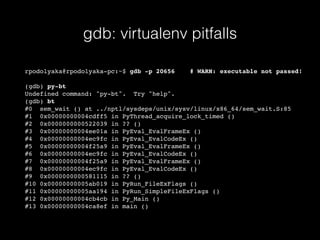
![Logging: log levels
if is_pid_cmdline_correct(pid, conffile.split('/')[-1]):
try:
_execute('kill', '-HUP', pid, run_as_root=True)
_add_dnsmasq_accept_rules(dev)
return
except Exception as exc:
LOG.error(_LE('kill -HUP dnsmasq threw %s'), exc)
else:
LOG.debug('Pid %d is stale, relaunching dnsmasq', pid)
Level Numeric value
CRITICAL 50
ERROR 40
WARNING 30
INFO 20
DEBUG 10
NOTSET 0](https://image.slidesharecdn.com/kharkivpy-debugging-161002140852/85/Debugging-of-C-Python-applications-11-320.jpg)
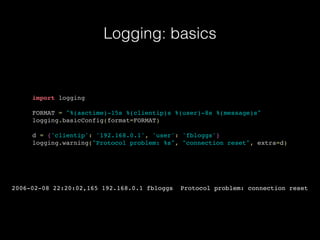
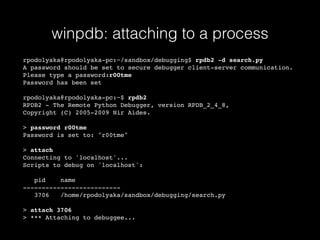
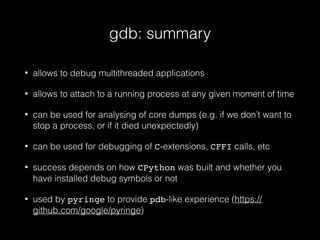
![Logging: context matters
cfg.StrOpt('logging_context_format_string',
default='%(asctime)s.%(msecs)03d %(process)d %(levelname)s '
'%(name)s [%(request_id)s %(user_identity)s] '
‘%(instance)s%(message)s’)
2015-06-10 12:42:00.765 27516 INFO nova.osapi_compute.wsgi.server [req-58f233ab-
f2b6-452f-b4fe-0c781ce8f8d0 None] 192.168.0.1 "GET /v2/
fc7f78f1c53d4443976514d2fd16e5cb/images/det
ail HTTP/1.1" status: 200 len: 905 time: 0.1043971
2015-06-10 12:41:57.004 2760 AUDIT nova.virt.block_device
[req-209db629-0d06-4f81-92ad-b910f1a72b36 None] [instance: a0d1c6ef-1fa8-46f9-a19d-
f8fb7d2df6a2] Booting with volume 8bad9533-9d6f-4be8-939d-b7a28a536a1a at /dev/vda](https://image.slidesharecdn.com/kharkivpy-debugging-161002140852/85/Debugging-of-C-Python-applications-13-320.jpg)

![pdb: basics
def _binary_search(arr, left, right, key):
if left == right:
return -1
middle = left + (right - left) / 2
if key == arr[middle]:
return middle
elif key > arr[middle]:
return _binary_search(arr, middle, right, key)
else:
return _binary_search(arr, left, middle, key)
def binary_search(arr, key):
return _binary_search(arr, 0, len(arr), key)
l = list(range(10))
assert binary_search(l, 5) == 5
assert binary_search(l, 0) == 0
assert binary_search(l, 9) == 9
assert binary_search(l, 10) == -1
assert binary_search(l, -5) == -1](https://image.slidesharecdn.com/kharkivpy-debugging-161002140852/85/Debugging-of-C-Python-applications-19-320.jpg)
![pdb: basics
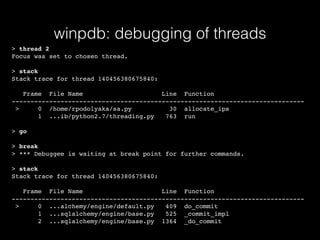
Romans-MacBook-Air:03-pdb malor$ python -m pdb basics.py
> /Users/malor/Dropbox/talks/kharkivpy-debugging/examples/03-pdb/
basics.py(1)<module>()
-> def _binary_search(arr, left, right, key):
(Pdb) break binary_search
Breakpoint 1 at /Users/malor/Dropbox/talks/kharkivpy-debugging/examples/03-pdb/
basics.py:15
(Pdb) continue
> /Users/malor/Dropbox/talks/kharkivpy-debugging/examples/03-pdb/
basics.py(16)binary_search()
-> return _binary_search(arr, 0, len(arr), key)
(Pdb) args
arr = [0, 1, 2, 3, 4, 5, 6, 7, 8, 9]
key = 5
(Pdb) step
--Call--
> /Users/malor/Dropbox/talks/kharkivpy-debugging/examples/03-pdb/
basics.py(1)_binary_search()
-> def _binary_search(arr, left, right, key):
(Pdb) next
> /Users/malor/Dropbox/talks/kharkivpy-debugging/examples/03-pdb/
basics.py(2)_binary_search()
-> if left == right:](https://image.slidesharecdn.com/kharkivpy-debugging-161002140852/85/Debugging-of-C-Python-applications-20-320.jpg)
![pdb: basics
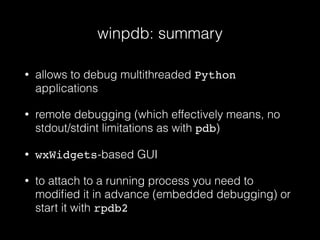
(Pdb) list
1 def _binary_search(arr, left, right, key):
2 -> if left == right:
3 return -1
4
5 middle = left + (right - left) / 2
6
7 if key == arr[middle]:
8 return middle
9 elif key > arr[middle]:
10 return _binary_search(arr, middle, right, key)
11 else:
(Pdb) where
/System/Library/Frameworks/Python.framework/Versions/2.7/lib/python2.7/
bdb.py(400)run()
-> exec cmd in globals, locals
<string>(1)<module>()
/Users/malor/Dropbox/talks/kharkivpy-debugging/examples/03-pdb/
basics.py(20)<module>()
-> assert binary_search(l, 5) == 5
/Users/malor/Dropbox/talks/kharkivpy-debugging/examples/03-pdb/
basics.py(16)binary_search()
-> return _binary_search(arr, 0, len(arr), key)
> /Users/malor/Dropbox/talks/kharkivpy-debugging/examples/03-pdb/
basics.py(2)_binary_search()
-> if left == right:](https://image.slidesharecdn.com/kharkivpy-debugging-161002140852/85/Debugging-of-C-Python-applications-21-320.jpg)
![pdb: commands
(Pdb) break
Num Type Disp Enb Where
1 breakpoint keep yes at /Users/malor/Dropbox/talks/kharkivpy-debugging/
examples/03-pdb/basics.py:15
breakpoint already hit 2 times
(Pdb) commands 1
(com) args
(com) where
(com) end
(Pdb) continue
arr = [0, 1, 2, 3, 4, 5, 6, 7, 8, 9]
key = 5
/System/Library/Frameworks/Python.framework/Versions/2.7/lib/python2.7/
bdb.py(400)run()
-> exec cmd in globals, locals
<string>(1)<module>()
/Users/malor/Dropbox/talks/kharkivpy-debugging/examples/03-pdb/
basics.py(20)<module>()
-> assert binary_search(l, 5) == 5
> /Users/malor/Dropbox/talks/kharkivpy-debugging/examples/03-pdb/
basics.py(16)binary_search()
-> return _binary_search(arr, 0, len(arr), key)
> /Users/malor/Dropbox/talks/kharkivpy-debugging/examples/03-pdb/
basics.py(16)binary_search()
-> return _binary_search(arr, 0, len(arr), key)](https://image.slidesharecdn.com/kharkivpy-debugging-161002140852/85/Debugging-of-C-Python-applications-23-320.jpg)
![pdb: conditional break points
(Pdb) break binary_search
Breakpoint 1 at /Users/malor/Dropbox/talks/kharkivpy-debugging/examples/03-pdb/
basics.py:15
(Pdb) break
Num Type Disp Enb Where
1 breakpoint keep yes at /Users/malor/Dropbox/talks/kharkivpy-debugging/
examples/03-pdb/basics.py:15
(Pdb) condition 1 key == 10
(Pdb) continue
> /Users/malor/Dropbox/talks/kharkivpy-debugging/examples/03-pdb/
basics.py(16)binary_search()
-> return _binary_search(arr, 0, len(arr), key)
(Pdb) args
arr = [0, 1, 2, 3, 4, 5, 6, 7, 8, 9]
key = 10](https://image.slidesharecdn.com/kharkivpy-debugging-161002140852/85/Debugging-of-C-Python-applications-24-320.jpg)


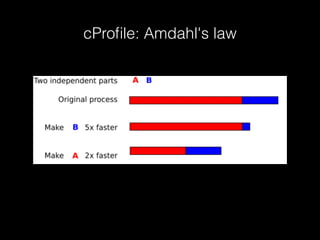
![cProfile: basics
def count_freq(stream):
res = {}
for i in iter(lambda: stream.read(1), ''):
try:
res[i] += 1
except KeyError:
res[i] = 1
return res
def build_tree(stream):
queue = [Node(freq=v, symb=k) for k, v in count_freq(stream).items()]
while len(queue) > 1:
queue.sort(key=lambda k: k.freq)
first = queue.pop(0)
second = queue.pop(0)
queue.append(
Node(freq=(first.freq + second.freq), left=first, right=second)
)
return queue[0]](https://image.slidesharecdn.com/kharkivpy-debugging-161002140852/85/Debugging-of-C-Python-applications-35-320.jpg)

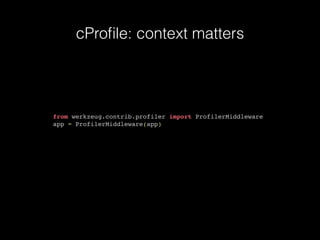
![cProfile: context matters
import cProfile as profiler
import gc, pstats, time
def profile(fn):
def wrapper(*args, **kw):
elapsed, stat_loader, result = _profile(“out.prof”, fn, *args, **kw)
stats = stat_loader()
stats.sort_stats('cumulative')
stats.print_stats()
return result
return wrapper
def _profile(filename, fn, *args, **kw):
load_stats = lambda: pstats.Stats(filename)
gc.collect()
began = time.time()
profiler.runctx('result = fn(*args, **kw)', globals(), locals(),
filename=filename)
ended = time.time()
return ended - began, load_stats, locals()['result']](https://image.slidesharecdn.com/kharkivpy-debugging-161002140852/85/Debugging-of-C-Python-applications-39-320.jpg)
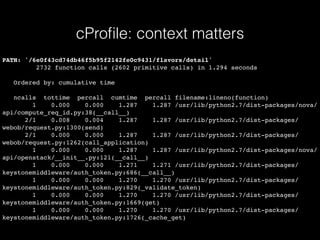


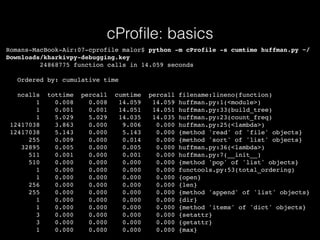
![objgraph: basics
In [1]: import objgraph
In [2]: objgraph.show_most_common_types()
function 4530
dict 2483
tuple 1428
wrapper_descriptor 1260
weakref 981
list 911
builtin_function_or_method 897
method_descriptor 705
getset_descriptor 531
type 473](https://image.slidesharecdn.com/kharkivpy-debugging-161002140852/85/Debugging-of-C-Python-applications-44-320.jpg)
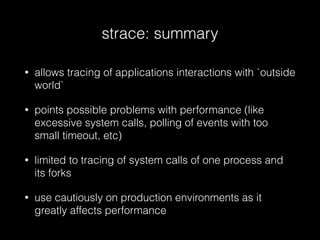
![objgraph: basics
In [3]: objgraph.show_growth()
function 4530 +4530
dict 2412 +2412
tuple 1353 +1353
wrapper_descriptor 1272 +1272
weakref 985 +985
list 904 +904
builtin_function_or_method 897 +897
method_descriptor 706 +706
getset_descriptor 535 +535
type 473 +473
In [4]: objgraph.show_growth()
weakref 986 +1
list 905 +1
tuple 1354 +1](https://image.slidesharecdn.com/kharkivpy-debugging-161002140852/85/Debugging-of-C-Python-applications-45-320.jpg)
![objgraph: graphs
>>> x = []
>>> y = [x, [x], {‘x’: x}]
>>> objgraph.show_refs([y], filename='sample-graph.png')](https://image.slidesharecdn.com/kharkivpy-debugging-161002140852/85/Debugging-of-C-Python-applications-46-320.jpg)

![strace: tracing syscalls
rpodolyaka@rpodolyaka-pc:~$ strace -e network python sa.py
. . .
socket(PF_INET6, SOCK_STREAM, IPPROTO_IP) = 5
setsockopt(5, SOL_TCP, TCP_NODELAY, [1], 4) = 0
setsockopt(5, SOL_SOCKET, SO_KEEPALIVE, [1], 4) = 0
connect(5, {sa_family=AF_INET6, sin6_port=htons(5432), inet_pton(AF_INET6, "::1",
&sin6_addr), sin6_flowinfo=0, sin6_scope_id=0}, 28) = -1 EINPROGRESS (Operation now
in progress)
getsockopt(5, SOL_SOCKET, SO_ERROR, [0], [4]) = 0
getsockname(5, {sa_family=AF_INET6, sin6_port=htons(36894), inet_pton(AF_INET6, "::
1", &sin6_addr), sin6_flowinfo=0, sin6_scope_id=0}, [28]) = 0
sendto(5, "00010432226/", 8, MSG_NOSIGNAL, NULL, 0) = 8
recvfrom(5, "S", 16384, 0, NULL, NULL) = 1
. . .](https://image.slidesharecdn.com/kharkivpy-debugging-161002140852/85/Debugging-of-C-Python-applications-48-320.jpg)
![strace: tracing syscalls
root@node-13:~# strace -p 1508 -s 4096 -tt
. . .
16:53:29.532770 epoll_wait(7, {}, 1023, 0) = 0
16:53:29.532832 epoll_wait(7, {}, 1023, 0) = 0
16:53:29.532892 epoll_wait(7, {}, 1023, 0) = 0
16:53:29.532953 epoll_wait(7, {}, 1023, 0) = 0
16:53:29.533022 epoll_wait(7, {{EPOLLIN, {u32=9, u64=39432335262744585}}}, 1023,
915) = 1
16:53:29.596409 epoll_ctl(7, EPOLL_CTL_DEL, 9, {EPOLLRDNORM|EPOLLWRBAND|EPOLLMSG|
0x28c45820, {u32=32644, u64=22396489217113988}}) = 0
16:53:29.596494 accept(9, 0x7ffe1ef32b10, [16]) = -1 EAGAIN (Resource temporarily
unavailable)
16:53:29.596638 epoll_ctl(7, EPOLL_CTL_ADD, 9, {EPOLLIN|EPOLLPRI|EPOLLERR|EPOLLHUP,
{u32=9, u64=39432335262744585}}) = 0
16:53:29.596747 epoll_wait(7, {{EPOLLIN, {u32=9, u64=39432335262744585}}}, 1023,
851) = 1
16:53:29.611852 epoll_ctl(7, EPOLL_CTL_DEL, 9, {EPOLLRDNORM|EPOLLWRBAND|EPOLLMSG|
0x28c45820, {u32=32644, u64=22396489217113988}}) = 0
16:53:29.611937 accept(9, 0x7ffe1ef32b10, [16]) = -1 EAGAIN (Resource temporarily
unavailable)
. . .](https://image.slidesharecdn.com/kharkivpy-debugging-161002140852/85/Debugging-of-C-Python-applications-49-320.jpg)

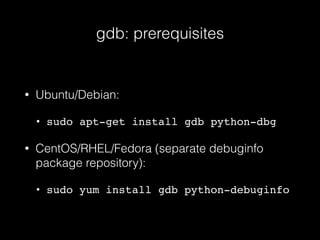


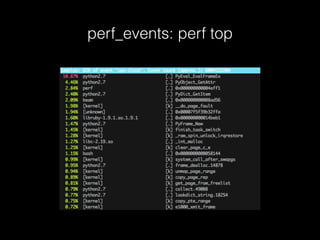
![perf_events: perf trace
254.663 ( 0.001 ms): sshd/22802 clock_gettime(which_clock: 7, tp: 0x7ffd0e807970
) = 0
254.666 ( 0.003 ms): sshd/22802 read(fd: 14</dev/ptmx>, buf: 0x7ffd0e8038b0,
count: 16384 ) = 4095
254.672 ( 0.243 ms): chrome/11973 epoll_wait(epfd: 16, events: 0x6a6a1b73480,
maxevents: 32, timeout: 4294967295) = 1
254.678 ( 0.003 ms): chrome/11973 read(fd: 24<socket:[147806]>, buf:
0x6a6a2d5b018, count: 4096 ) = 32
254.685 ( 0.003 ms): chrome/11973 write(fd: 11<pipe:[147797]>, buf:
0x7f940dfa55e7, count: 1 ) = 1
254.688 ( 0.001 ms): chrome/11973 read(fd: 24<socket:[147806]>, buf:
0x6a6a2d5b018, count: 4096 ) = -1 EAGAIN Resource temporarily unavailable
254.691 ( 0.001 ms): chrome/11973 epoll_wait(epfd: 16, events: 0x6a6a1b73480,
maxevents: 32 ) = 0
254.693 ( 0.001 ms): chrome/11973 epoll_wait(epfd: 16, events: 0x6a6a1b73480,
maxevents: 32 ) = 0](https://image.slidesharecdn.com/kharkivpy-debugging-161002140852/85/Debugging-of-C-Python-applications-67-320.jpg)


The document discusses debugging techniques for (c)Python applications, emphasizing the importance of stable and scalable open-source platforms like OpenStack. It compares various debugging methods, including printf debugging, logging, and using the Python Debugger (pdb), highlighting their functionalities and limitations. Additionally, tools such as Winpdb for remote debugging and handling multithreaded applications are introduced, along with best practices for logging and post-mortem debugging.