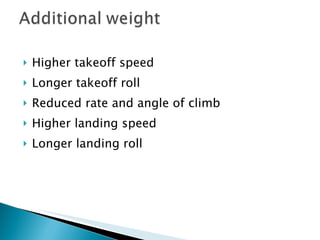
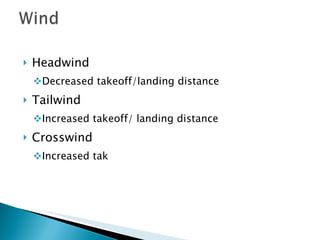
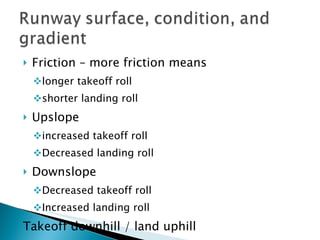
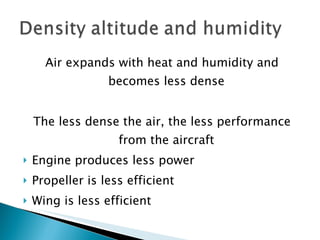
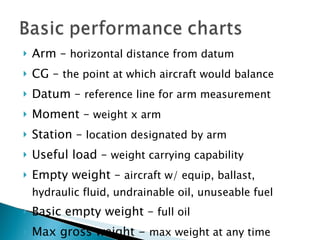
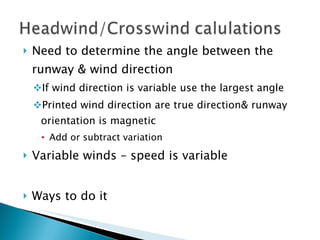
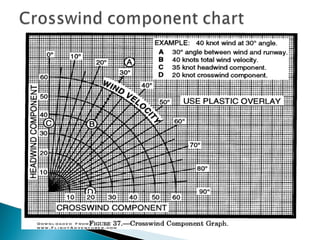
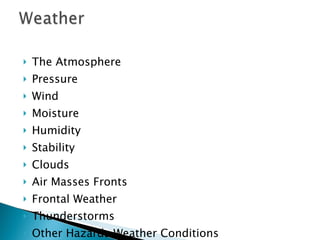
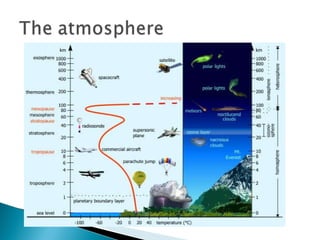
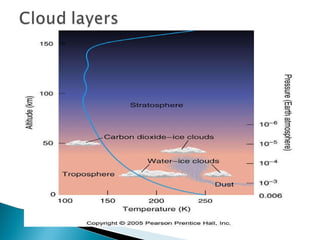
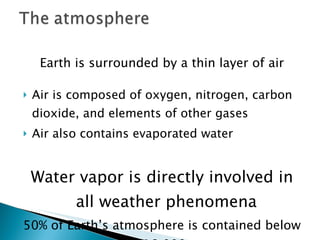
Aircraft Performance Weather Weather Reports and Forecasts Weather Reports and Forecasts Emergencies FAR/AIM, NTSB 830, PTS, and Logbooks
Factors Affecting Performance Takeoff Data Card Airplane Weight and Balance Basic Performance Charts Headwind/Crosswind Calculations
Additional weight Wind Runway surface and condition Runway gradient Density altitude and humidity Pilot technique
Higher takeoff speed Longer takeoff roll Reduced rate and angle of climb Higher landing speed  Longer landing roll
Headwind Decreased takeoff/landing distance Tailwind Increased takeoff/ landing distance Crosswind Increased tak
Friction – more friction means  longer takeoff roll  shorter landing roll Upslope  increased takeoff roll  Decreased landing roll Downslope Decreased takeoff roll Increased landing roll Takeoff downhill / land uphill
Air expands with heat and humidity and becomes less dense The less dense the air, the less performance from the aircraft Engine produces less power Propeller is less efficient Wing is less efficient
Calculated based on Air pressure (barometric) Air temperature High density altitude Low density of the air (high altitude) Low density altitude High density of the air (low altitued)
 
 
Failure to compute and appropriate weight and balance could cause injury or death 14 CFR 91.103(b)(2) “…other reliable information appropriate to the aircraft, relating to aircraft performance under expected values of airport elevation and runway slope, aircraft gross weight, and wind and temperature
Higher takeoff speed Longer takeoff roll Reduced rate & angle of climb Lower maximum altitude Shorter range (used more fuel) Lower cruise speed Less maneuverability Higher stall speed Longer landing roll Additional stress on landing gear & structure
Gross weight – aircraft may not fly Angle of attack may not be able to create enough lift to fly the aircraft Aft Better cruise performance, less stability, difficulty recovering from stalls Forward / aft GC Forward – degraded cruise & climb performance and more difficult to rotate and flare due to larger taildown  force requirement


Arm –  horizontal distance from datum CG –  the point at which aircraft would balance Datum –  reference line for arm measurement Moment –  weight x arm Station –  location designated by arm Useful load –  weight carrying capability Empty weight –  aircraft w/ equip, ballast, hydraulic fluid, undrainable oil, unuseable fuel Basic empty weight –  full oil Max gross weight -  max weight at any time Maximum takeoff -  max weight for takeoff Maximum landing –  max weight for landing
Need to determine the angle between the runway & wind direction If wind direction is variable use the largest angle Printed wind direction are true direction& runway orientation is magnetic Add or subtract variation Variable winds – speed is variable Ways to do it
 
The Atmosphere Pressure Wind Moisture Humidity Stability Clouds Air Masses Fronts Frontal Weather Thunderstorms Other Hazards Weather Conditions
 
 
Earth is surrounded by a thin layer of air Air is composed of oxygen, nitrogen, carbon dioxide, and elements of other gases Air also contains evaporated water Water vapor is directly involved in all weather phenomena 50% of Earth’s atmosphere is contained below 18,000
Every physical process of weather is accompanied by, or is the result of heat exchanges Unequal heating of the Earth’s surface causes differences in pressure Wind is the flow of air from high pressure to low pressure areas Tendency of the atmosphere is to flow from the poles to the equator, heat up, rise and flow back to the poles Coriolis force deflects wind to the right in the (northern hemisphere) Surface friction influences wind flow
 
Force caused by spinning of the earth  Varies in strength with latitude Zero at the equator Strongest at poles Responsible for changing north-south tendency of atmosphere into west-east pattern in the mid latitudes
 
Heating and cooling of air causes it to change pressure Hot air rises and expands, causing lower surface pressure Cold air descends and contracts, causing higher surface pressure
Wind is created as air moves from areas of high pressure to areas of low pressure Coriolis force causes air flowing into or out of a pressure system to rotate Rotates clockwise around a high Rotates counterclockwise around a low Air flows counterclockwise, up, and into a low Air flows clockwise , down, and out of a high
 
 
Earth’s atmosphere contains 1%-4% water vapor Water vapor interacting with the heat exchange, is responsible for all weather Moisture also slows down the standard lapse rate Standard lapse rate  = 2 degrees C per 1000ft Moist-air lapse rate = 1degree C per 1000ft Moisture influences “dew point” Dew point = temperature to which air must be cooled to become saturated by water vapor already present in the air Low temperature dew point spread = high humidity
Water vapor content of the air May be expressed as: Relative humidity – the ratio of the existing amount of water vapor in the air at a given temperature to the maximum amount that could exist at that temperature; usually expressed as a percent Mixing ratio – the ration by weight of the amount of water vapor in a volume of air to the amount of dry air; usually expressed as grams/kilograms Specific humidity – the ration by weight of water vapor in a sample of air to the combined weight of water vapor and dry air
Stability is the tendency of the atmosphere to resist upward movement Instability  - (upward movement ) causes Heating from below – convective current (heat rises) Low pressure – because of its lifting tendency Cold air aloft – greater than normal lapse rate When air rises, it cools at a rate of 2 degrees C per 1000ft Greater differential between hot and cold air Humidity – due to its slower lapse rate
Characteristics of stable air Smooth air Poor visibility Continuous precipitation (if any) Stratus clouds Characteristics of unstable are Turbulence  Good visibility Showery precipitation (if any) Cumulus clouds
A temperature inversion is an increase in temperature as altitude increases Air beneath inversion is very stable Low visibility “ Capping” effect on pollution Develop near the ground on cool, clear nights
Four families – based on height High- cirrus Middle – alto Low – (no prefix) Extensive vertical development-  towering cumulus (turbulent) Grouped according to appearance Cumulus=ragged or puffy;  good indication of instability Stratus = smooth and even;  good indication of stability
Combined description examples Cirrostratus – high stratus Altostratus – medium stratus Stratus – low stratus Towering cumulus have extensive vertical development Can quickly develop into thunderstorms Visual indicator of heavy turbulence Rain clouds Rain clouds denoted by “nimbus” Thunderstorms are called cumulonimbus and contain the greatest turbulence
Large areas of air that are formed over specific Earth regions Polar regions Tropical regions The oceans Air masses are constantly changing Heating or cooling from below Lifting or subsiding Absorbing or losing moisture Its temperature is measured in relation to the temperature of the surface over which it is passing
A cold air mass has a colder temperature than the surface Warmed from below, convection currents will be set up, causing turbulence Improved visibility Unstable Types of clouds-  cumulus and cumulus nimbus Ceilings – generally unlimited Precipitation –occasional local thunderstorms or showers
A warm air mass has a warmer temperature than the surface No tendency for convection currents to form, resulting in smooth air Poor visibility Stable Types of clouds – stratus and stratus cumulus Ceilings –generally low Types of precipitation – drizzle
Dissimilar air massed don’t readily mix and set up boundaries called frontal zones The colder air mass project under the warmer air mass The warmer air rises over the colder air mass 4 types of fronts Warm front Cold front Occluded front Stationary front
Warmer air is overtaking and replacing the colder air Cold air is more dense (heavier) than warm air-the cold air hugs the ground The warm air slides up and over the cold air The cold air is slow to retreat in advance of the warm air This slowness of air to retreat produced a more gradual frontal slope than the one in the cold air front Thus, a warm front, at the surface, is seldom as well marked as cold fronts The move about half as fast
 
The cold air is overtaking and replacing the warmer air They move at about the speed of the wind component perpendicular to the front just above the frictional layer
 
Occluded front - when a cold front catches up with a warm front the two collide- where they collide is called an occluded front Warm air trapped between the two air masses, is forced aloft The weather is a combination of both the warm and the colds fronts Warm - lowered ceilings, lowered visibility, precipitation Cold – squalls, turbulence, thunderstorms
Stationary front - when neither air mass is replacing the other, the front is stationary The opposing forces of the two air masses nullify one another and very little motion occurs The surface winds tend to blow parallel to the frontal zone The slope of the stationary front is shallow
 
600 miles prior  –  bright skies, unlimited  visibility and ceilings 400 miles prior  –  rapidly decreasing  visibilities and ceilings. Rain begins shortly. 200 miles prior  –  ceiling too low for VFR flight and visibilities lowered to almost zero. As the front is approached there is a gradual temperature increase and an increase in dew point, and atmospheric pressure would lessen
Beginning  the flight in the warm air mass, sky likely overcast, stratocumulus clouds, smooth air, and relatively low ceilings and visibilities until the flight was approaching the front If flight continues into the frontal area, a few altostratus clouds and a dark layer of nimbostratus (rain clouds) would likely be seen Gusty wind and wind shifts Possibility of squalls and cumulonimbus clouds Too high to fly over, unsafe below them, and nearly impossible to fly through them
The worst weather for a pilot A combination of the warm front and cold front conditions As it approaches , the warm front conditions are prevalent Lowering ceilings, lowering visibilities, and precipitation Followed almost immediately by cold front conditions Squalls, turbulence, and thunderstorms
The cumulonimbus cloud – thunderhead Produce strong updrafts, large raindrops, hail, lightning, thunder, downdrafts, and strong turbulence May exceed 50,000 ft in height 3 stages Cumulus stage Updrafts and growth Mature stage Up and downdrafts produce gusty surface winds Precipitation begins Dissipating stage Downdrafts
 
Air mass thunderstorms Often result from surface heating Tend to self-destruct (downdrafts with rain) 20-90 min. life cycle Steady state thunderstorms Associated with a weather system but may be intensified by afternoon heating Tend to grow Can last for hours Physically, in its mature stage, the top of the cloud begins to flatten to an anvil shape and point in the direction the cloud is moving strong updrafts at the leading edge of the cloud Within and directly beneath are updrafts and downdrafts The rear generates strong downdrafts
Freezing rain Supercooled water droplets adhere rapidly on the surface of the aircraft and the windshield Can obscure vision – reverse flight path Icing (other than freezing rain)  only occurs in the clouds There is no reason for the VFR pilot to be in this situation Ground fog  can form rapidly with the right conditions – especially dangerous for takeoff and landing
Fog can form By cooling air to its dew point Beware when the temperature/dew point spread is within 3 degrees of each other – as night approaches Adding moisture to the air near the ground Frost on the wings can cause the aircraft to stall at a higher speed than normal  Frost can disrupt the smooth flow of air over the wing’s surface – do not fly with frost on lifting surfaces Clear air turbulence occurs outside of clouds Jet stream Large thunderstorms – cumulonimbus clouds Mountain waves
Surface Analysis Charts Weather Depiction Charts Low-Level Prognostic Charts Area Forecasts (FA) TAFs METARs Wind and Temperature Aloft (FB) Pilot Reports Obtaining a Weather Briefing FSS/DUAT Standard/Abbreviated/Outlook Briefings AWOS/ASOS/AWSS reports


Zulu time Greenwich mean time 24hr clock A standard reference to eliminate time-zone confusion Standard time to UTC Eastern  + 5  hr = UTC Central + 6  hr = UTC Mountain + 7  hr = UTC Pacific + 8  hr = UTC Alaskan + 9  hr = UTC Hawaii + 10 hr = UTC
SLCC FA 14105 SYNOPSIS AND VFR CLDS/WX SYNOPSIS VALID UNTIL 150500 CLDS/WX VALID UNTIL 142300…OTLK VALID 142300-150500 ID MT NV UT WY CO AZ NM SEE AIRMET SEIRRA FOR IFR CONDS AND MTN OBSCN. TSTMS IMPLY PSBL SVR OR GTR TURBC SVR ICG LLWS IFR CONDS. NON MSL HGTS ARE DENOTED BY AGL OR CIG. SYNOPSIS…HIGH PRES OVR NERN MT CONTG EWD GRDLY. LOW PRES OVR AZ NM AND WRN TX RMNG GENLY STNRY. ALF…TROF EXTENDS FROM WRN MT INTO SRN AZ RMNG STNRY.
Terminal aerodrome forecast Weather forecast for selected airports TAF – routine forecast TAF AMD – amended forecast Issued four times daily Issued at 0000,0600,1200, 1800 (UTC) Valid for 24 or 30 hours, depending on station There is some overlap between forecasts
TAF AMD YSBK 241854Z 2008 VRB03KT CAVOK FM23 02010KT 9999 SCT040 BKN100 PROB30 2023 2000 MIST INTER 0608 7000 LIGHT SHOWERS OF RAIN BKN020 T 17 21 19 15 Q 1016 1014 1013 1013
Example METAR YSBK 0230Z 31008KT //// 19/04 Q1015 RMK RF00.1/012.0 CLD:SCT025 VIS:9999 Aviation routine weather report Use abbreviations similar to TAF’s Report of condition at time of observation METAR = regular hourly report SPECI = special report necessitated by rapidly changing weather conditions
DATA BASED ON 010000Z VALID 010600Z FOR USE 0500-0900Z TEMP NEG ABOVE 24000 FT  3000 6000 9000 MKC 2426 2726-09 2826-14 ABQ 1912+15
Winds  aloft are forecast for specific locations in the US Four-digit group used to represent wind direction and speed 2525 = from 250 at 25kts 0315 = from 030 at 15kts Six-digit group is wind and temperature aloft 353515 = 350degrees at 35kts, temp = 15c Wind speed over 100kts, forecaster adds 50 to direction and subtracts 100 from the speed 7302-49 = 230 at106kts, temp -49c Winds less than 5kts is coded as 9900
Report given to FSS by pilots in flight Can be a source of real-time information Drawbacks Not everyone reports everything In really bad weather, no one else has been a trailblazer Age of report can be a factor Applicability depends of aircraft type PIREPS are encouraged if unexpected weather is encountered UA/OV KMRB-KPIT/TM 1600/FL100/TP BE55/SK BKN024-TOP032/BKN-OVC043-TOPUNKN/TA M12/IC LGT-MOD RIME 055-080
Call 1-800 WX-BRIEF When calling make sure the briefer knows you are a pilot (student pilot) Intended route (or “local”) Departure/destination airports VFR/IFR Type of aircraft Departure time (UTC) and time enroute
Standard is given in following order Is there any bad weather happening What’s the big picture Where are the highs, lows, and front What are the current conditions What’s forecast for the near future Any needed data re: airport closures  Outlook briefing – more than 6 hours Abbreviated briefing Supplement available info Update a previous briefing Find out specific info
Self briefing sources DUATS – direct user access terminal www.duats.com  or  www.duat.com Free service supported by FAA Official weather briefings via computer Account available to anyone with valid medical or pilot certificate Computer briefing services DTN, WSI, etc. Web based briefings http://aviation weather.gov www.weather . Com Caution: computer based sources other than DUATS may not be considered an official briefing
Weather reporting systems which may be used for the creation of a METAR or recorded audio report of existing weather Automated weather observing system (AWOS) Automated surface observation system (ASOS) Automated weather sensor system (AWSS)
Radar Wx Reports Severe Wx Reoperts and Forecasts AIRMETs SIGMETs / Convective SIGMETs NOTAMs Wind Shear Reports Wind Shear Recognition and Avoidance Weather Related Aeronautical Decision Making and Judgment
AWOS-A  reports altimeter setting AWOS-1  reports altimeter, wind, temperature, dew point, and density altitud e AWOS-2  provides info from AWOS-1 + visibility AWOS-3  provides info from AWOS-2 +cloud/ceiling data ASOS  provides the info of at least AWOS-3 AWSS  is a follow-on program that provides identical data as ASOS
Radar weather report (SD) Text report regarding areas of precipitation appearing on radar Indicates the type, intensity, location, movement, and height of the echo top All heights are reported above sea level Also referred to as RAREPs Radar summary charts Charts displaying a collection on radar reports Shows tops of clouds, direction of movement Intensity indicated by contours Report combines 6 levels to produce 3 contours
Convective outlook (AC) National forecast of thunderstorms Flight planning tool to avoid thunderstorms Three forecasts: Day 1 convective outlook (first 24hrs) issues at 0600z,1300z,1630z,2000z, an 0100z Day 2 convective outlook (next 24hrs) issued at 0830z (ST)/0730z (DT) update at 1730z Day 3 convective outlook (next 24hrs) issued from day 3 at 1200z to day 4 at 1200z Define areas of risk for severe and general (non-severe) thunderstorms
Winds equal to or greater than 50kts at the surface Hail equal to or greater than ¾ inch in diameter tornadoes
Severe weather watch bulletin (WW) Define areas of possible severe thunderstorm or tornado activity A severe watch describes areas where the threat of tornadoes exists Unscheduled and issued as required Preliminary notification of a watch called the alert weather watch bulletin (AWW) is sent before the WW to alert necessary personnel
Airmen’s meteorological information Issued to warn of weather hazards to small aircraft Moderate icing  Moderate turbulence  IFR conditions Sustained surface winds of more than 30kts Extensive mountain obscuration
Significant meteorological conditions Issued for weather to ALL aircraft  Severe turbulence Severe icing Dust storms, sand storms, or volcanic ash Volcanic eruption Convective SIGMETs Tornadoes  Lines of thunderstorms Severe turbulence Severe icing Embedded thunderstorms
NOTAM (D) – distance NOTAMs Affect cross-country pilots and local airport users Closed airports Navigation aids off the air Grass cutting operations Taxiways closed NOTAM (FDC) – Flight data center Changes in regulations or charts Emergency flight restrictions National airspace closure information (911) Wide-spread traffic delays or closures Pointer NOTAMs – highlight another NOTAM Assist users in cross-referencing important information that may not be found under an airport or NAVAID identifier
Wind shear is a change in wind speed and/or direction in a short distance resulting in a tearing or shearing effect Report  the loss or gain of airspeed and the altitude at which it was encountered Pilots should promptly volunteer report to controllers of wind shear conditions encountered A Controller may issue a wind shear alert based upon information derived from equipment in the control tower
Wind shear can exist in a horizontal or vertical direction and occasionally in both Shows up as a momentary change in airspeed or altitude (or rate of altitude change)  Can be very dangerous at low altitudes
Avoidance Recognize the problem and consider  going elsewhere Understand conditions conducive to development Convective storms (thunderstorms, rain/snow showers) Fronts Strong surface winds Unstable (turbulent) air Strong winds on top of a temperature inversion Listen for reports from other pilots or ATC Watch for confliction wind indications
The best place to make weather related decisions is on the ground Responsibility  Early - instructor Later – student Develop alternative plans for unforecast weather before a decision becomes critical Don’t delay using your alternate plan When in doubt err on the conservative side
Emergency procedures Aviate  Navigate  Communicate Fly the aircraft Review and follow the checklist Stabilize the problem to the extent possible Land as required
14 CFR Part 1 14 CFR Part 61 Recreational/Student Limitations 14 CFR 61 Private/Students Limitations 14 CFR Part 67 14 CFR Part 91 14 CFR Part 141 NTSB 830 AIM Pilot Logbooks Aircraft Logbooks Practical Test Standards FAA Advisory Circulars Aeronautical Decision Making and Judgment 


Day 2

  • 1.
    Aircraft Performance WeatherWeather Reports and Forecasts Weather Reports and Forecasts Emergencies FAR/AIM, NTSB 830, PTS, and Logbooks
  • 2.
    Factors Affecting PerformanceTakeoff Data Card Airplane Weight and Balance Basic Performance Charts Headwind/Crosswind Calculations
  • 3.
    Additional weight WindRunway surface and condition Runway gradient Density altitude and humidity Pilot technique
  • 4.
    Higher takeoff speedLonger takeoff roll Reduced rate and angle of climb Higher landing speed Longer landing roll
  • 5.
    Headwind Decreased takeoff/landingdistance Tailwind Increased takeoff/ landing distance Crosswind Increased tak
  • 6.
    Friction – morefriction means longer takeoff roll shorter landing roll Upslope increased takeoff roll Decreased landing roll Downslope Decreased takeoff roll Increased landing roll Takeoff downhill / land uphill
  • 7.
    Air expands withheat and humidity and becomes less dense The less dense the air, the less performance from the aircraft Engine produces less power Propeller is less efficient Wing is less efficient
  • 8.
    Calculated based onAir pressure (barometric) Air temperature High density altitude Low density of the air (high altitude) Low density altitude High density of the air (low altitued)
  • 9.
  • 10.
  • 11.
    Failure to computeand appropriate weight and balance could cause injury or death 14 CFR 91.103(b)(2) “…other reliable information appropriate to the aircraft, relating to aircraft performance under expected values of airport elevation and runway slope, aircraft gross weight, and wind and temperature
  • 12.
    Higher takeoff speedLonger takeoff roll Reduced rate & angle of climb Lower maximum altitude Shorter range (used more fuel) Lower cruise speed Less maneuverability Higher stall speed Longer landing roll Additional stress on landing gear & structure
  • 13.
    Gross weight –aircraft may not fly Angle of attack may not be able to create enough lift to fly the aircraft Aft Better cruise performance, less stability, difficulty recovering from stalls Forward / aft GC Forward – degraded cruise & climb performance and more difficult to rotate and flare due to larger taildown force requirement
  • 14.
  • 15.
  • 16.
  • 17.
  • 18.
    Arm – horizontal distance from datum CG – the point at which aircraft would balance Datum – reference line for arm measurement Moment – weight x arm Station – location designated by arm Useful load – weight carrying capability Empty weight – aircraft w/ equip, ballast, hydraulic fluid, undrainable oil, unuseable fuel Basic empty weight – full oil Max gross weight - max weight at any time Maximum takeoff - max weight for takeoff Maximum landing – max weight for landing
  • 19.
    Need to determinethe angle between the runway & wind direction If wind direction is variable use the largest angle Printed wind direction are true direction& runway orientation is magnetic Add or subtract variation Variable winds – speed is variable Ways to do it
  • 20.
  • 21.
    The Atmosphere PressureWind Moisture Humidity Stability Clouds Air Masses Fronts Frontal Weather Thunderstorms Other Hazards Weather Conditions
  • 22.
  • 23.
  • 24.
    Earth is surroundedby a thin layer of air Air is composed of oxygen, nitrogen, carbon dioxide, and elements of other gases Air also contains evaporated water Water vapor is directly involved in all weather phenomena 50% of Earth’s atmosphere is contained below 18,000
  • 25.
    Every physical processof weather is accompanied by, or is the result of heat exchanges Unequal heating of the Earth’s surface causes differences in pressure Wind is the flow of air from high pressure to low pressure areas Tendency of the atmosphere is to flow from the poles to the equator, heat up, rise and flow back to the poles Coriolis force deflects wind to the right in the (northern hemisphere) Surface friction influences wind flow
  • 26.
  • 27.
    Force caused byspinning of the earth Varies in strength with latitude Zero at the equator Strongest at poles Responsible for changing north-south tendency of atmosphere into west-east pattern in the mid latitudes
  • 28.
  • 29.
    Heating and coolingof air causes it to change pressure Hot air rises and expands, causing lower surface pressure Cold air descends and contracts, causing higher surface pressure
  • 30.
    Wind is createdas air moves from areas of high pressure to areas of low pressure Coriolis force causes air flowing into or out of a pressure system to rotate Rotates clockwise around a high Rotates counterclockwise around a low Air flows counterclockwise, up, and into a low Air flows clockwise , down, and out of a high
  • 31.
  • 32.
  • 33.
    Earth’s atmosphere contains1%-4% water vapor Water vapor interacting with the heat exchange, is responsible for all weather Moisture also slows down the standard lapse rate Standard lapse rate = 2 degrees C per 1000ft Moist-air lapse rate = 1degree C per 1000ft Moisture influences “dew point” Dew point = temperature to which air must be cooled to become saturated by water vapor already present in the air Low temperature dew point spread = high humidity
  • 34.
    Water vapor contentof the air May be expressed as: Relative humidity – the ratio of the existing amount of water vapor in the air at a given temperature to the maximum amount that could exist at that temperature; usually expressed as a percent Mixing ratio – the ration by weight of the amount of water vapor in a volume of air to the amount of dry air; usually expressed as grams/kilograms Specific humidity – the ration by weight of water vapor in a sample of air to the combined weight of water vapor and dry air
  • 35.
    Stability is thetendency of the atmosphere to resist upward movement Instability - (upward movement ) causes Heating from below – convective current (heat rises) Low pressure – because of its lifting tendency Cold air aloft – greater than normal lapse rate When air rises, it cools at a rate of 2 degrees C per 1000ft Greater differential between hot and cold air Humidity – due to its slower lapse rate
  • 36.
    Characteristics of stableair Smooth air Poor visibility Continuous precipitation (if any) Stratus clouds Characteristics of unstable are Turbulence Good visibility Showery precipitation (if any) Cumulus clouds
  • 37.
    A temperature inversionis an increase in temperature as altitude increases Air beneath inversion is very stable Low visibility “ Capping” effect on pollution Develop near the ground on cool, clear nights
  • 38.
    Four families –based on height High- cirrus Middle – alto Low – (no prefix) Extensive vertical development- towering cumulus (turbulent) Grouped according to appearance Cumulus=ragged or puffy; good indication of instability Stratus = smooth and even; good indication of stability
  • 39.
    Combined description examplesCirrostratus – high stratus Altostratus – medium stratus Stratus – low stratus Towering cumulus have extensive vertical development Can quickly develop into thunderstorms Visual indicator of heavy turbulence Rain clouds Rain clouds denoted by “nimbus” Thunderstorms are called cumulonimbus and contain the greatest turbulence
  • 40.
    Large areas ofair that are formed over specific Earth regions Polar regions Tropical regions The oceans Air masses are constantly changing Heating or cooling from below Lifting or subsiding Absorbing or losing moisture Its temperature is measured in relation to the temperature of the surface over which it is passing
  • 41.
    A cold airmass has a colder temperature than the surface Warmed from below, convection currents will be set up, causing turbulence Improved visibility Unstable Types of clouds- cumulus and cumulus nimbus Ceilings – generally unlimited Precipitation –occasional local thunderstorms or showers
  • 42.
    A warm airmass has a warmer temperature than the surface No tendency for convection currents to form, resulting in smooth air Poor visibility Stable Types of clouds – stratus and stratus cumulus Ceilings –generally low Types of precipitation – drizzle
  • 43.
    Dissimilar air masseddon’t readily mix and set up boundaries called frontal zones The colder air mass project under the warmer air mass The warmer air rises over the colder air mass 4 types of fronts Warm front Cold front Occluded front Stationary front
  • 44.
    Warmer air isovertaking and replacing the colder air Cold air is more dense (heavier) than warm air-the cold air hugs the ground The warm air slides up and over the cold air The cold air is slow to retreat in advance of the warm air This slowness of air to retreat produced a more gradual frontal slope than the one in the cold air front Thus, a warm front, at the surface, is seldom as well marked as cold fronts The move about half as fast
  • 45.
  • 46.
    The cold airis overtaking and replacing the warmer air They move at about the speed of the wind component perpendicular to the front just above the frictional layer
  • 47.
  • 48.
    Occluded front -when a cold front catches up with a warm front the two collide- where they collide is called an occluded front Warm air trapped between the two air masses, is forced aloft The weather is a combination of both the warm and the colds fronts Warm - lowered ceilings, lowered visibility, precipitation Cold – squalls, turbulence, thunderstorms
  • 49.
    Stationary front -when neither air mass is replacing the other, the front is stationary The opposing forces of the two air masses nullify one another and very little motion occurs The surface winds tend to blow parallel to the frontal zone The slope of the stationary front is shallow
  • 50.
  • 51.
    600 miles prior – bright skies, unlimited visibility and ceilings 400 miles prior – rapidly decreasing visibilities and ceilings. Rain begins shortly. 200 miles prior – ceiling too low for VFR flight and visibilities lowered to almost zero. As the front is approached there is a gradual temperature increase and an increase in dew point, and atmospheric pressure would lessen
  • 52.
    Beginning theflight in the warm air mass, sky likely overcast, stratocumulus clouds, smooth air, and relatively low ceilings and visibilities until the flight was approaching the front If flight continues into the frontal area, a few altostratus clouds and a dark layer of nimbostratus (rain clouds) would likely be seen Gusty wind and wind shifts Possibility of squalls and cumulonimbus clouds Too high to fly over, unsafe below them, and nearly impossible to fly through them
  • 53.
    The worst weatherfor a pilot A combination of the warm front and cold front conditions As it approaches , the warm front conditions are prevalent Lowering ceilings, lowering visibilities, and precipitation Followed almost immediately by cold front conditions Squalls, turbulence, and thunderstorms
  • 54.
    The cumulonimbus cloud– thunderhead Produce strong updrafts, large raindrops, hail, lightning, thunder, downdrafts, and strong turbulence May exceed 50,000 ft in height 3 stages Cumulus stage Updrafts and growth Mature stage Up and downdrafts produce gusty surface winds Precipitation begins Dissipating stage Downdrafts
  • 55.
  • 56.
    Air mass thunderstormsOften result from surface heating Tend to self-destruct (downdrafts with rain) 20-90 min. life cycle Steady state thunderstorms Associated with a weather system but may be intensified by afternoon heating Tend to grow Can last for hours Physically, in its mature stage, the top of the cloud begins to flatten to an anvil shape and point in the direction the cloud is moving strong updrafts at the leading edge of the cloud Within and directly beneath are updrafts and downdrafts The rear generates strong downdrafts
  • 57.
    Freezing rain Supercooledwater droplets adhere rapidly on the surface of the aircraft and the windshield Can obscure vision – reverse flight path Icing (other than freezing rain) only occurs in the clouds There is no reason for the VFR pilot to be in this situation Ground fog can form rapidly with the right conditions – especially dangerous for takeoff and landing
  • 58.
    Fog can formBy cooling air to its dew point Beware when the temperature/dew point spread is within 3 degrees of each other – as night approaches Adding moisture to the air near the ground Frost on the wings can cause the aircraft to stall at a higher speed than normal Frost can disrupt the smooth flow of air over the wing’s surface – do not fly with frost on lifting surfaces Clear air turbulence occurs outside of clouds Jet stream Large thunderstorms – cumulonimbus clouds Mountain waves
  • 59.
    Surface Analysis ChartsWeather Depiction Charts Low-Level Prognostic Charts Area Forecasts (FA) TAFs METARs Wind and Temperature Aloft (FB) Pilot Reports Obtaining a Weather Briefing FSS/DUAT Standard/Abbreviated/Outlook Briefings AWOS/ASOS/AWSS reports
  • 60.
  • 61.
  • 62.
  • 63.
    Zulu time Greenwichmean time 24hr clock A standard reference to eliminate time-zone confusion Standard time to UTC Eastern + 5 hr = UTC Central + 6 hr = UTC Mountain + 7 hr = UTC Pacific + 8 hr = UTC Alaskan + 9 hr = UTC Hawaii + 10 hr = UTC
  • 64.
    SLCC FA 14105SYNOPSIS AND VFR CLDS/WX SYNOPSIS VALID UNTIL 150500 CLDS/WX VALID UNTIL 142300…OTLK VALID 142300-150500 ID MT NV UT WY CO AZ NM SEE AIRMET SEIRRA FOR IFR CONDS AND MTN OBSCN. TSTMS IMPLY PSBL SVR OR GTR TURBC SVR ICG LLWS IFR CONDS. NON MSL HGTS ARE DENOTED BY AGL OR CIG. SYNOPSIS…HIGH PRES OVR NERN MT CONTG EWD GRDLY. LOW PRES OVR AZ NM AND WRN TX RMNG GENLY STNRY. ALF…TROF EXTENDS FROM WRN MT INTO SRN AZ RMNG STNRY.
  • 65.
    Terminal aerodrome forecastWeather forecast for selected airports TAF – routine forecast TAF AMD – amended forecast Issued four times daily Issued at 0000,0600,1200, 1800 (UTC) Valid for 24 or 30 hours, depending on station There is some overlap between forecasts
  • 66.
    TAF AMD YSBK241854Z 2008 VRB03KT CAVOK FM23 02010KT 9999 SCT040 BKN100 PROB30 2023 2000 MIST INTER 0608 7000 LIGHT SHOWERS OF RAIN BKN020 T 17 21 19 15 Q 1016 1014 1013 1013
  • 67.
    Example METAR YSBK0230Z 31008KT //// 19/04 Q1015 RMK RF00.1/012.0 CLD:SCT025 VIS:9999 Aviation routine weather report Use abbreviations similar to TAF’s Report of condition at time of observation METAR = regular hourly report SPECI = special report necessitated by rapidly changing weather conditions
  • 68.
    DATA BASED ON010000Z VALID 010600Z FOR USE 0500-0900Z TEMP NEG ABOVE 24000 FT 3000 6000 9000 MKC 2426 2726-09 2826-14 ABQ 1912+15
  • 69.
    Winds aloftare forecast for specific locations in the US Four-digit group used to represent wind direction and speed 2525 = from 250 at 25kts 0315 = from 030 at 15kts Six-digit group is wind and temperature aloft 353515 = 350degrees at 35kts, temp = 15c Wind speed over 100kts, forecaster adds 50 to direction and subtracts 100 from the speed 7302-49 = 230 at106kts, temp -49c Winds less than 5kts is coded as 9900
  • 70.
    Report given toFSS by pilots in flight Can be a source of real-time information Drawbacks Not everyone reports everything In really bad weather, no one else has been a trailblazer Age of report can be a factor Applicability depends of aircraft type PIREPS are encouraged if unexpected weather is encountered UA/OV KMRB-KPIT/TM 1600/FL100/TP BE55/SK BKN024-TOP032/BKN-OVC043-TOPUNKN/TA M12/IC LGT-MOD RIME 055-080
  • 71.
    Call 1-800 WX-BRIEFWhen calling make sure the briefer knows you are a pilot (student pilot) Intended route (or “local”) Departure/destination airports VFR/IFR Type of aircraft Departure time (UTC) and time enroute
  • 72.
    Standard is givenin following order Is there any bad weather happening What’s the big picture Where are the highs, lows, and front What are the current conditions What’s forecast for the near future Any needed data re: airport closures Outlook briefing – more than 6 hours Abbreviated briefing Supplement available info Update a previous briefing Find out specific info
  • 73.
    Self briefing sourcesDUATS – direct user access terminal www.duats.com or www.duat.com Free service supported by FAA Official weather briefings via computer Account available to anyone with valid medical or pilot certificate Computer briefing services DTN, WSI, etc. Web based briefings http://aviation weather.gov www.weather . Com Caution: computer based sources other than DUATS may not be considered an official briefing
  • 74.
    Weather reporting systemswhich may be used for the creation of a METAR or recorded audio report of existing weather Automated weather observing system (AWOS) Automated surface observation system (ASOS) Automated weather sensor system (AWSS)
  • 75.
    Radar Wx ReportsSevere Wx Reoperts and Forecasts AIRMETs SIGMETs / Convective SIGMETs NOTAMs Wind Shear Reports Wind Shear Recognition and Avoidance Weather Related Aeronautical Decision Making and Judgment
  • 76.
    AWOS-A reportsaltimeter setting AWOS-1 reports altimeter, wind, temperature, dew point, and density altitud e AWOS-2 provides info from AWOS-1 + visibility AWOS-3 provides info from AWOS-2 +cloud/ceiling data ASOS provides the info of at least AWOS-3 AWSS is a follow-on program that provides identical data as ASOS
  • 77.
    Radar weather report(SD) Text report regarding areas of precipitation appearing on radar Indicates the type, intensity, location, movement, and height of the echo top All heights are reported above sea level Also referred to as RAREPs Radar summary charts Charts displaying a collection on radar reports Shows tops of clouds, direction of movement Intensity indicated by contours Report combines 6 levels to produce 3 contours
  • 78.
    Convective outlook (AC)National forecast of thunderstorms Flight planning tool to avoid thunderstorms Three forecasts: Day 1 convective outlook (first 24hrs) issues at 0600z,1300z,1630z,2000z, an 0100z Day 2 convective outlook (next 24hrs) issued at 0830z (ST)/0730z (DT) update at 1730z Day 3 convective outlook (next 24hrs) issued from day 3 at 1200z to day 4 at 1200z Define areas of risk for severe and general (non-severe) thunderstorms
  • 79.
    Winds equal toor greater than 50kts at the surface Hail equal to or greater than ¾ inch in diameter tornadoes
  • 80.
    Severe weather watchbulletin (WW) Define areas of possible severe thunderstorm or tornado activity A severe watch describes areas where the threat of tornadoes exists Unscheduled and issued as required Preliminary notification of a watch called the alert weather watch bulletin (AWW) is sent before the WW to alert necessary personnel
  • 81.
    Airmen’s meteorological informationIssued to warn of weather hazards to small aircraft Moderate icing Moderate turbulence IFR conditions Sustained surface winds of more than 30kts Extensive mountain obscuration
  • 82.
    Significant meteorological conditionsIssued for weather to ALL aircraft Severe turbulence Severe icing Dust storms, sand storms, or volcanic ash Volcanic eruption Convective SIGMETs Tornadoes Lines of thunderstorms Severe turbulence Severe icing Embedded thunderstorms
  • 83.
    NOTAM (D) –distance NOTAMs Affect cross-country pilots and local airport users Closed airports Navigation aids off the air Grass cutting operations Taxiways closed NOTAM (FDC) – Flight data center Changes in regulations or charts Emergency flight restrictions National airspace closure information (911) Wide-spread traffic delays or closures Pointer NOTAMs – highlight another NOTAM Assist users in cross-referencing important information that may not be found under an airport or NAVAID identifier
  • 84.
    Wind shear isa change in wind speed and/or direction in a short distance resulting in a tearing or shearing effect Report the loss or gain of airspeed and the altitude at which it was encountered Pilots should promptly volunteer report to controllers of wind shear conditions encountered A Controller may issue a wind shear alert based upon information derived from equipment in the control tower
  • 85.
    Wind shear canexist in a horizontal or vertical direction and occasionally in both Shows up as a momentary change in airspeed or altitude (or rate of altitude change) Can be very dangerous at low altitudes
  • 86.
    Avoidance Recognize theproblem and consider going elsewhere Understand conditions conducive to development Convective storms (thunderstorms, rain/snow showers) Fronts Strong surface winds Unstable (turbulent) air Strong winds on top of a temperature inversion Listen for reports from other pilots or ATC Watch for confliction wind indications
  • 87.
    The best placeto make weather related decisions is on the ground Responsibility Early - instructor Later – student Develop alternative plans for unforecast weather before a decision becomes critical Don’t delay using your alternate plan When in doubt err on the conservative side
  • 88.
    Emergency procedures Aviate Navigate Communicate Fly the aircraft Review and follow the checklist Stabilize the problem to the extent possible Land as required
  • 89.
    14 CFR Part1 14 CFR Part 61 Recreational/Student Limitations 14 CFR 61 Private/Students Limitations 14 CFR Part 67 14 CFR Part 91 14 CFR Part 141 NTSB 830 AIM Pilot Logbooks Aircraft Logbooks Practical Test Standards FAA Advisory Circulars Aeronautical Decision Making and Judgment 
  • 90.
  • 91.
  • 92.
  • 93.
  • 94.
  • 95.
  • 96.
  • 97.
  • 98.
  • 99.
  • 100.
  • 101.
  • 102.
  • 103.