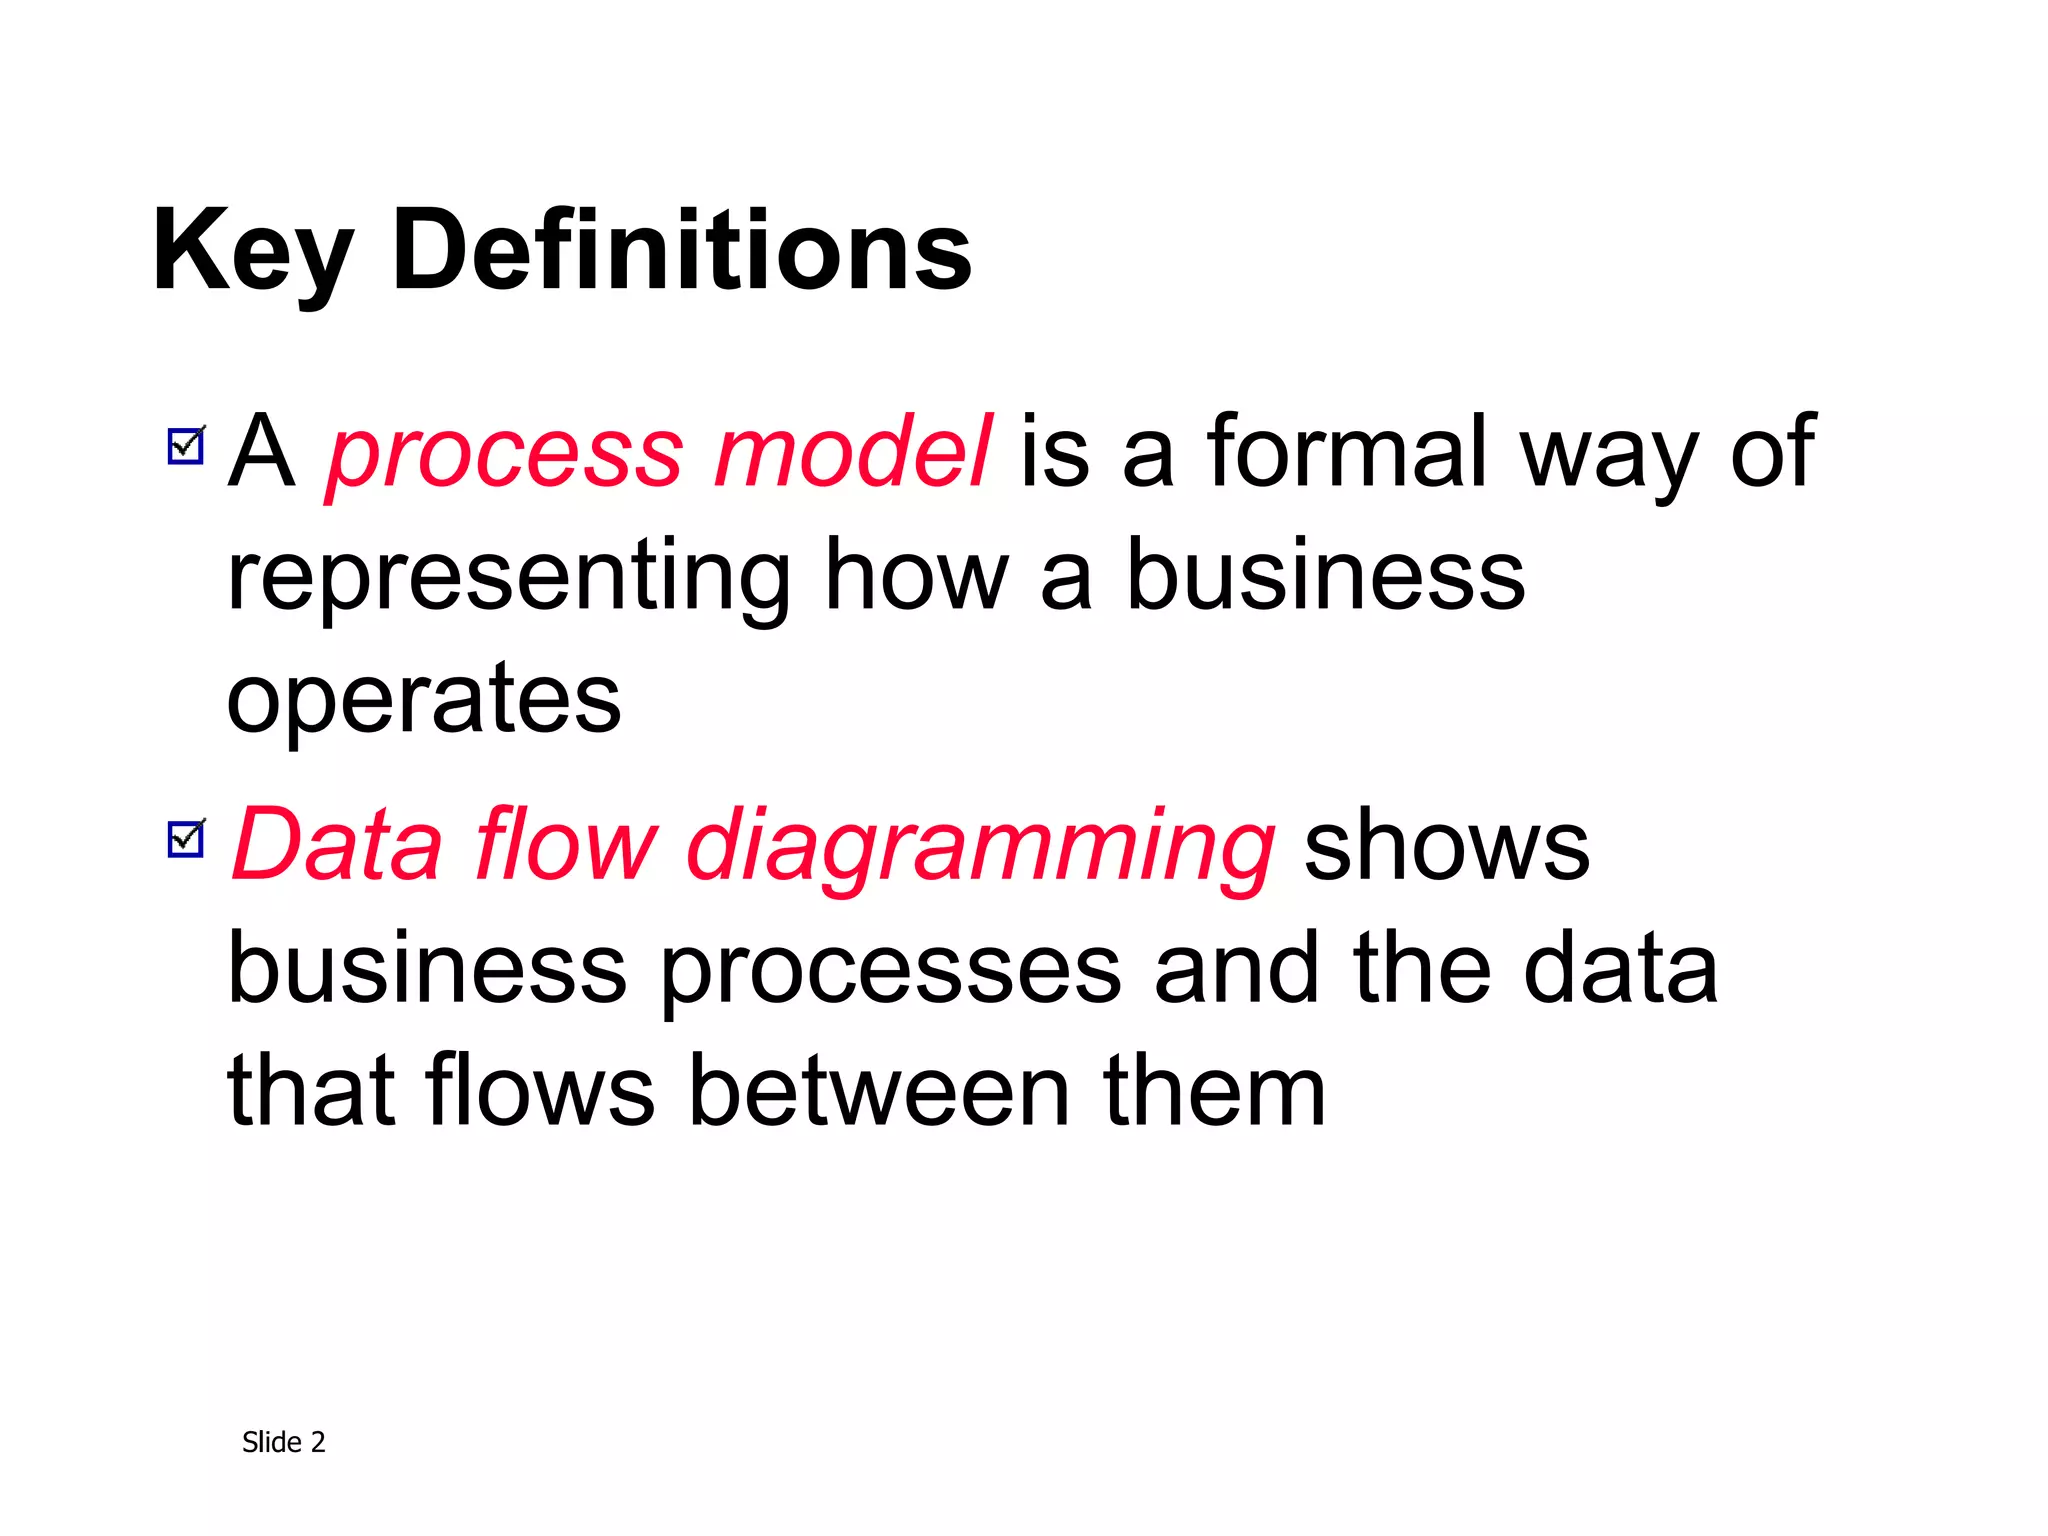
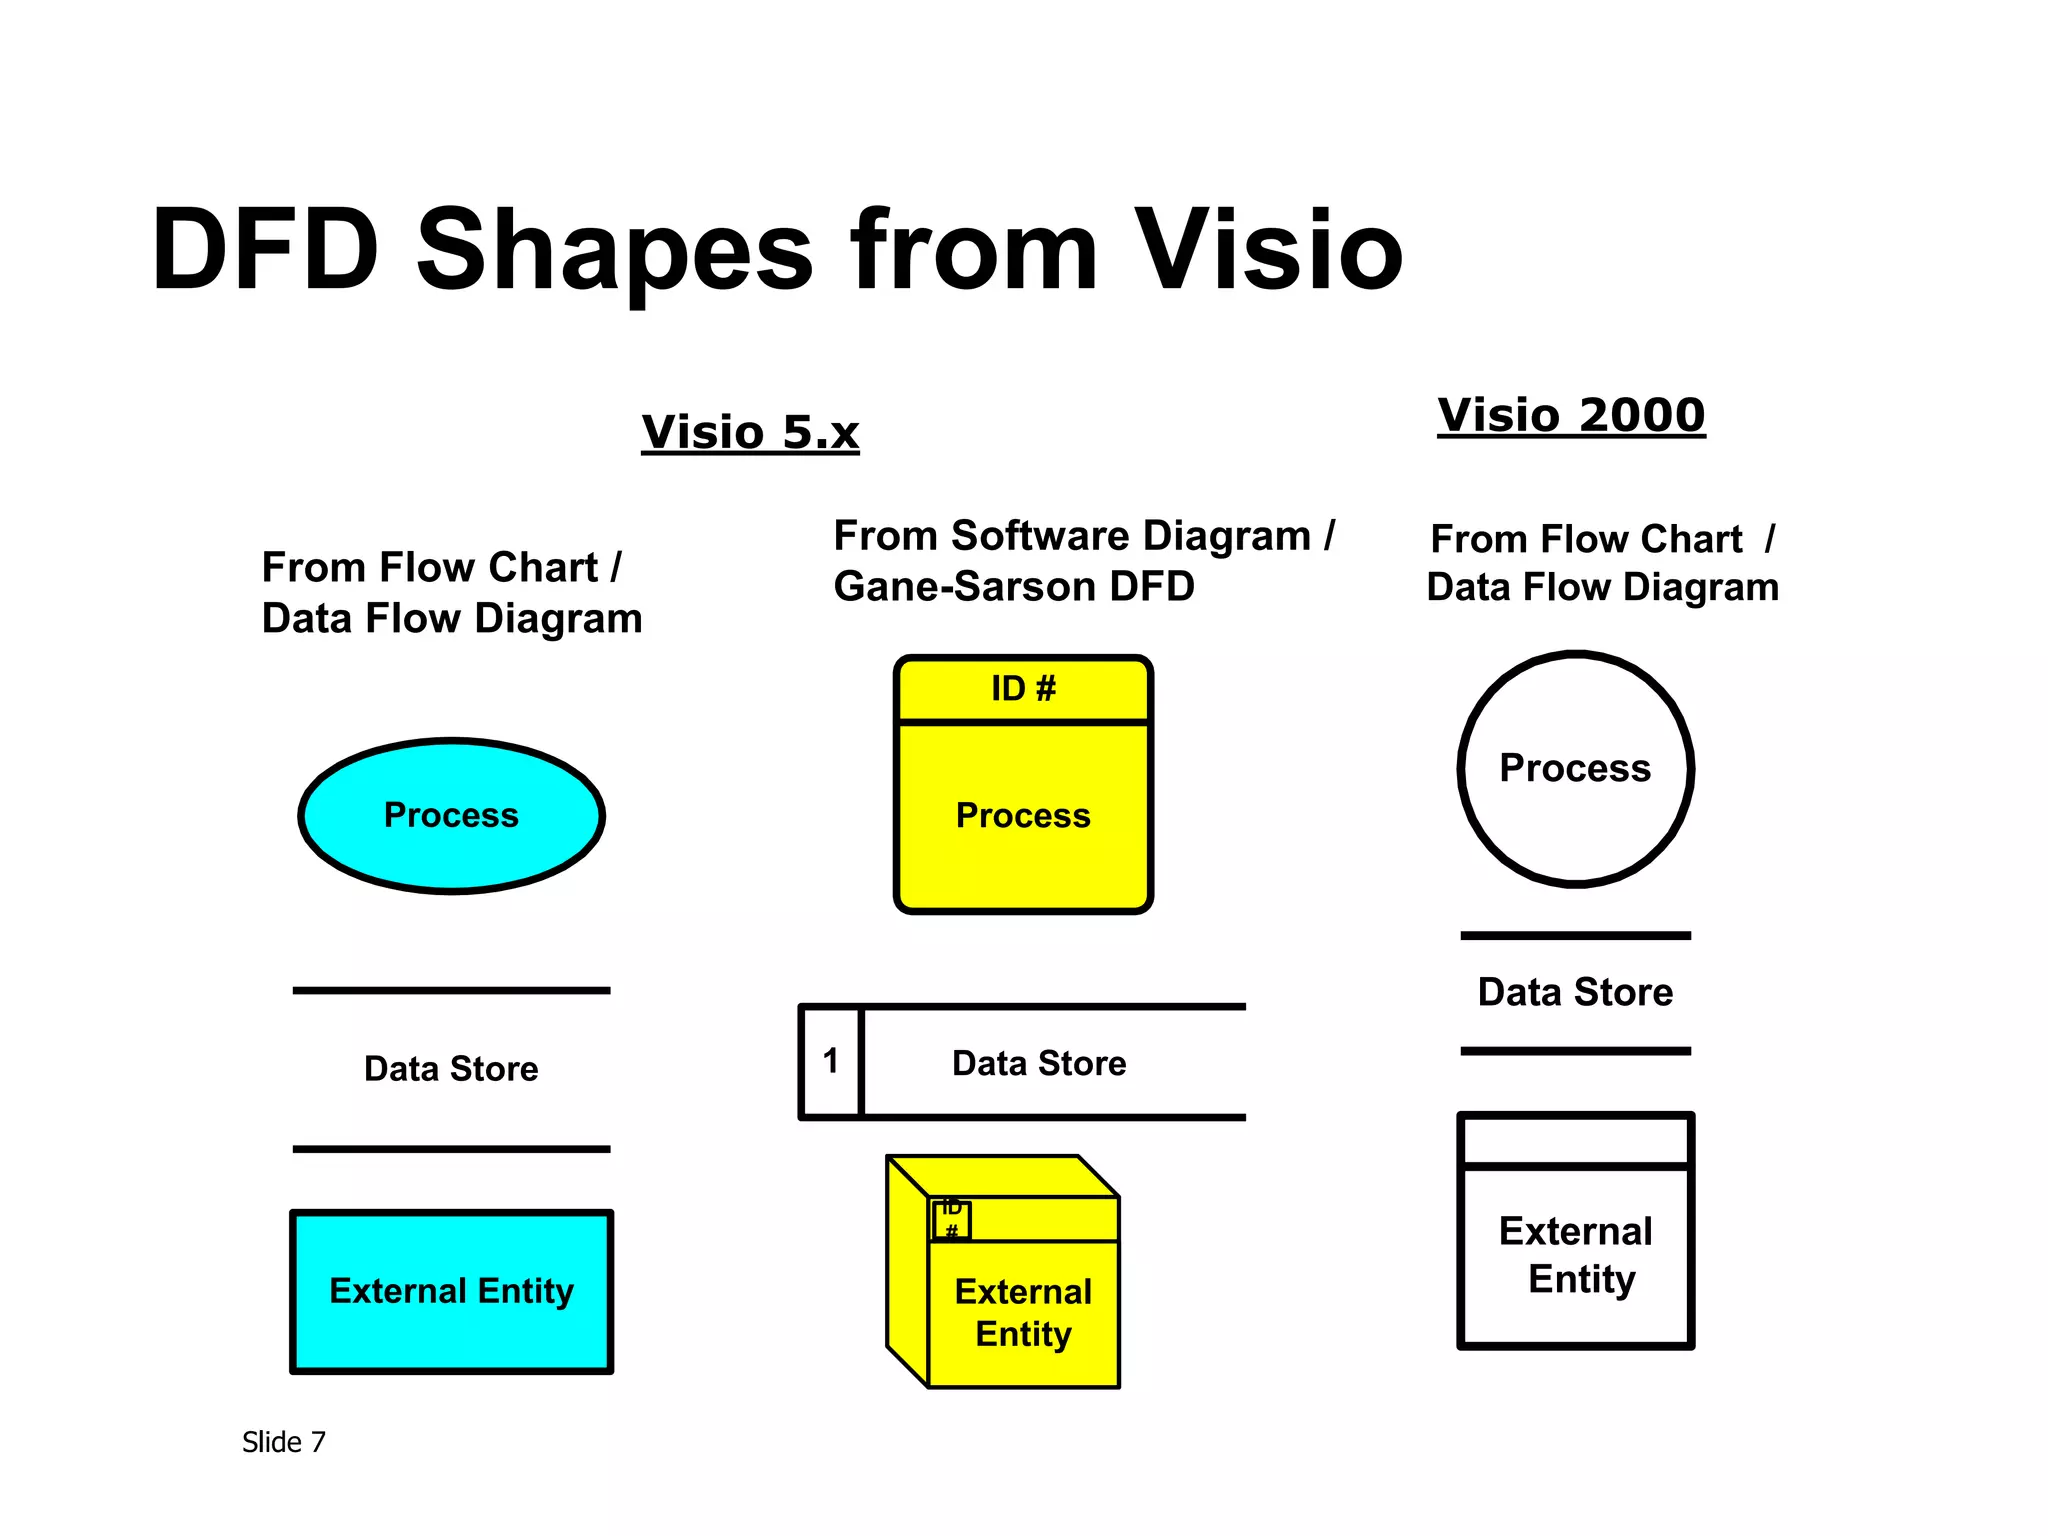
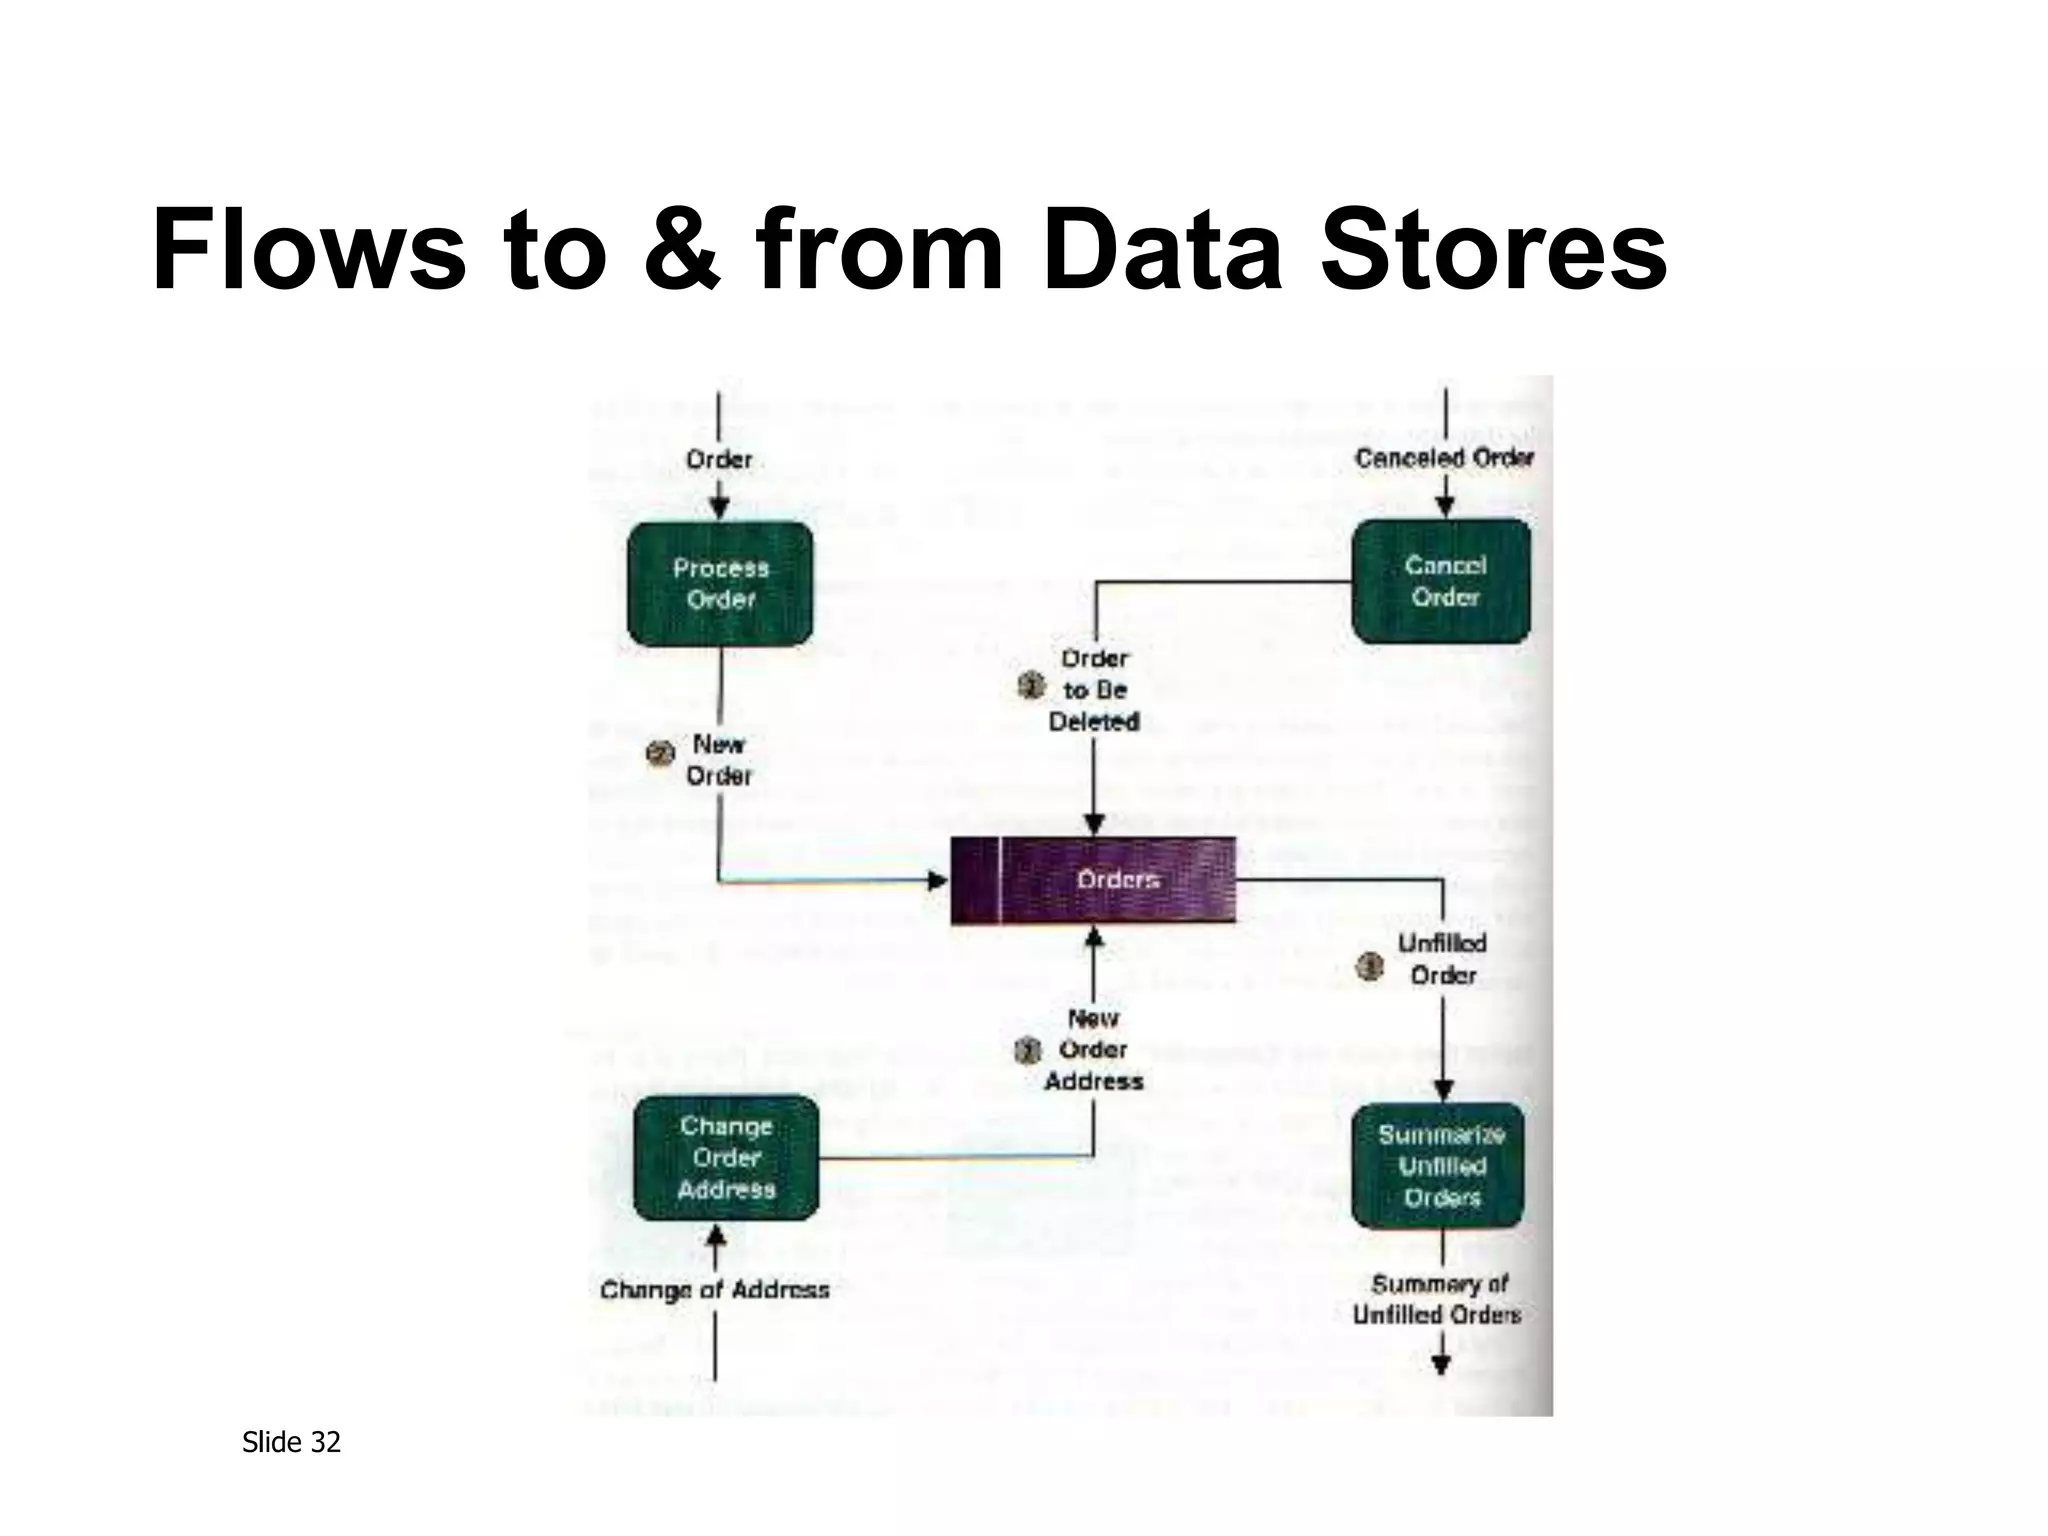
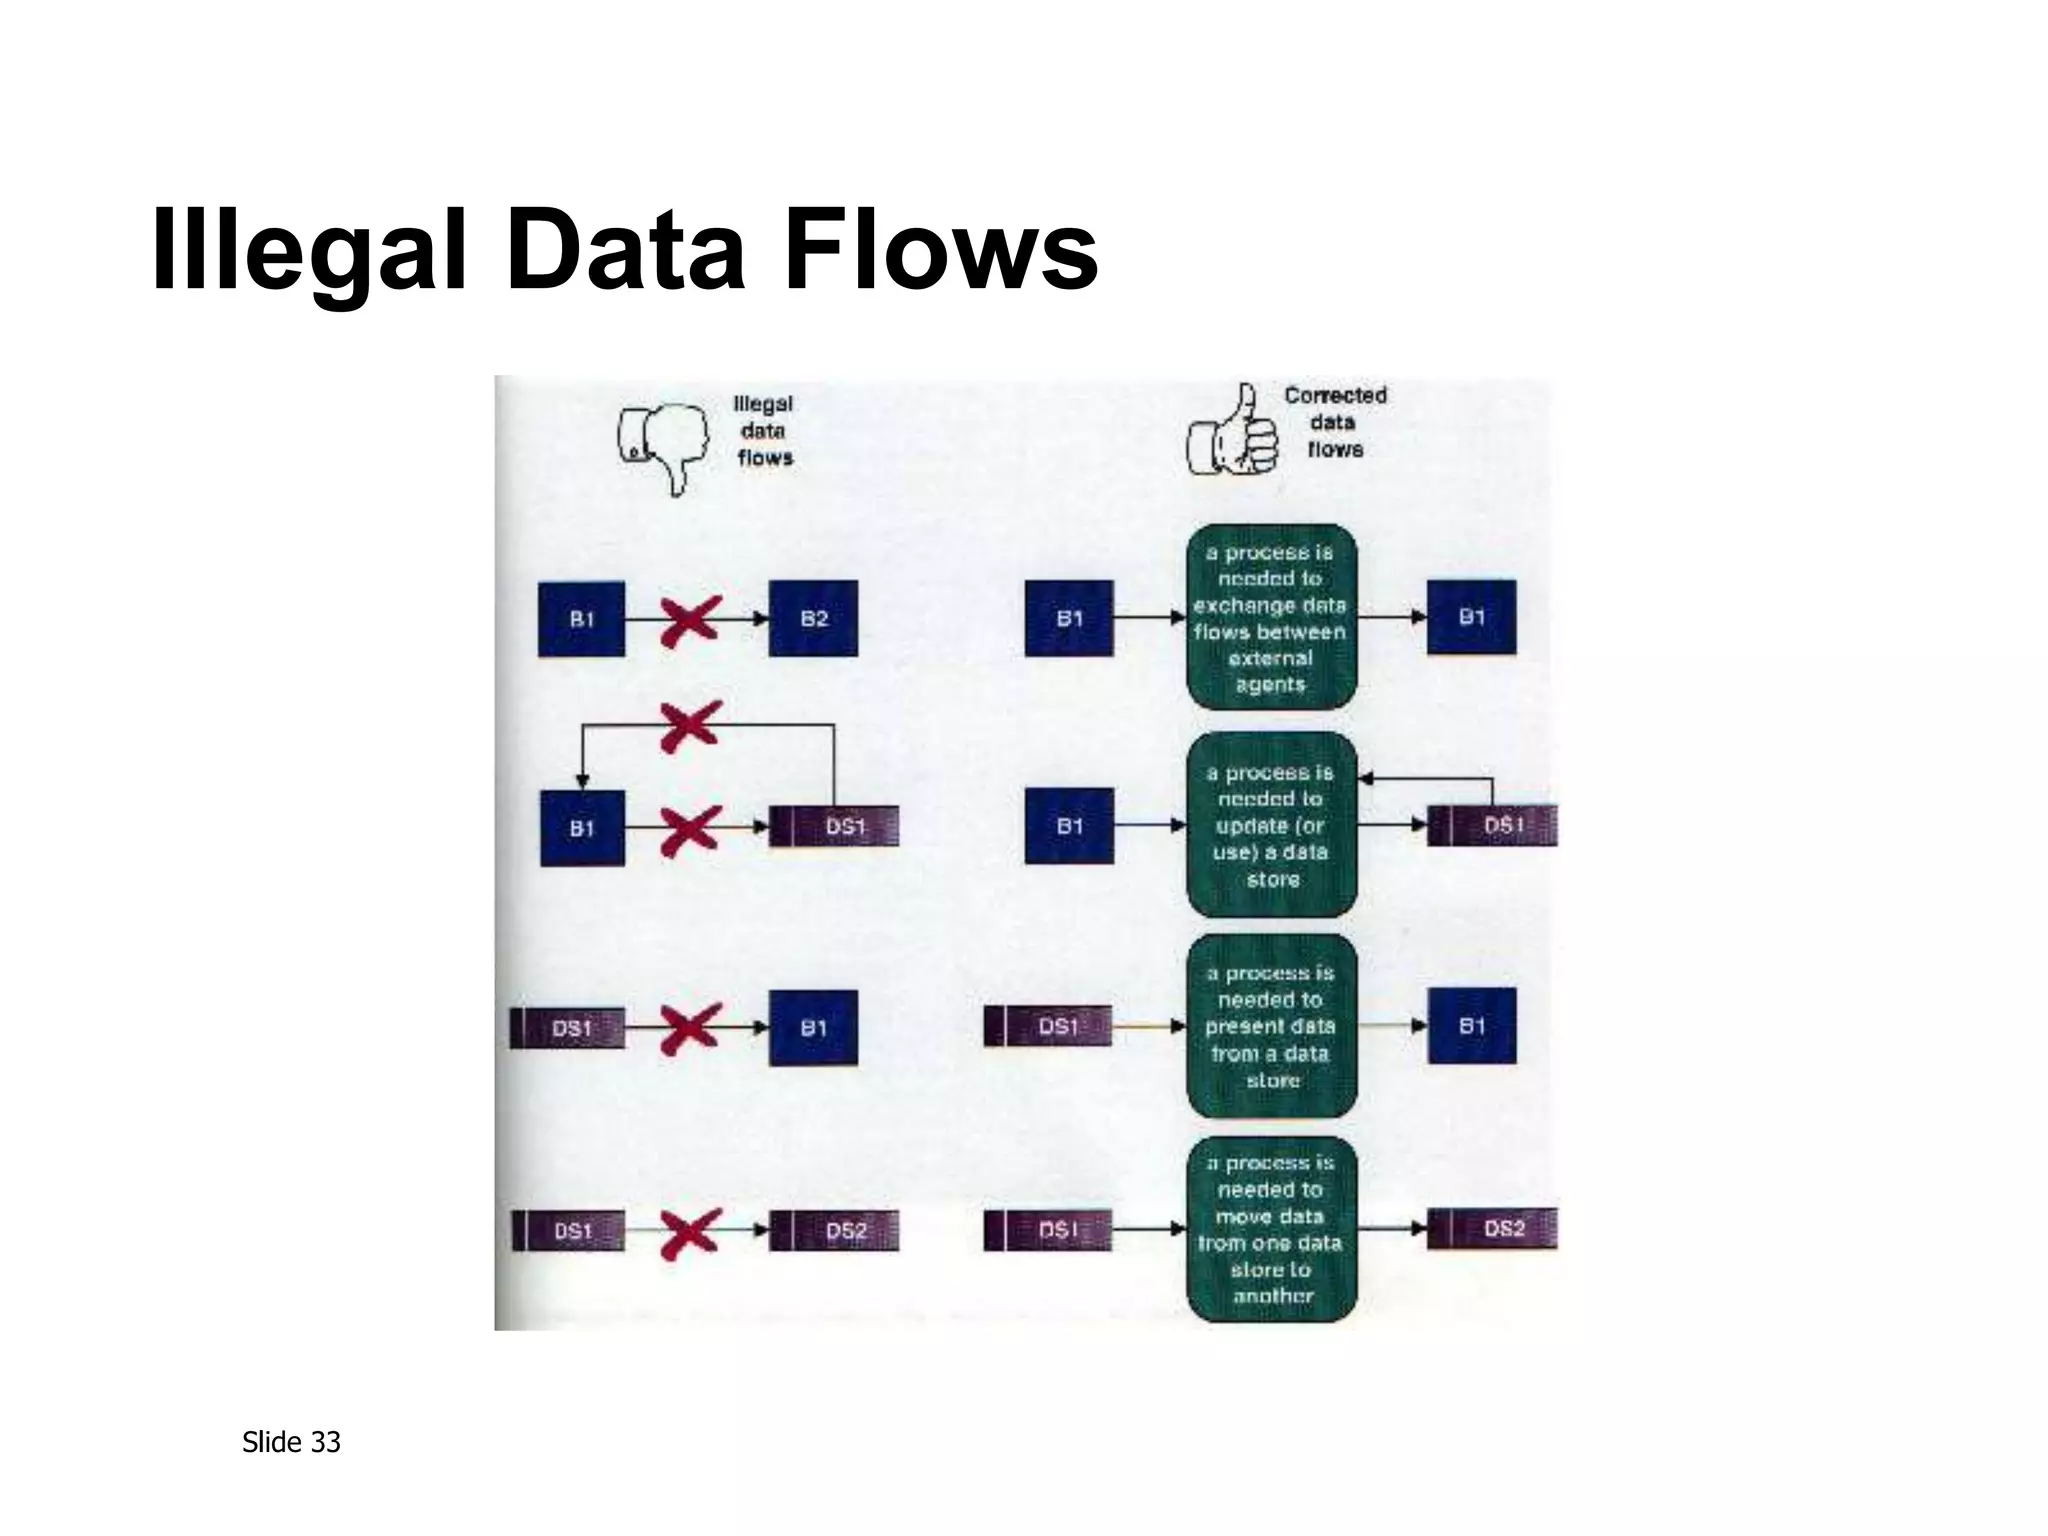
Slide 1
Process Modeling
Slide 2
Key Definitions
A process model is a formal way of
representing how a business
operates
Data flow diagramming shows
business processes and the data
that flows between them
Slide 3
Key Definitions
Logical process models describe
processes without suggesting how
they are conducted
Physical models include information
about how the processes are
implemented
Slide 4
Data Flow Diagrams
Slide 5
Reading a DFD
Slide 6
DFD Elements
Slide 7
DFD Shapes from Visio
From Flow Chart /
Data Flow Diagram
Process
Data Store
External Entity
From Software Diagram /
Gane-Sarson DFD
Process
ID #
ID
#
External
Entity
Data Store
1
External
Entity
Data Store
Process
From Flow Chart /
Data Flow Diagram
Visio 5.x Visio 2000
Slide 8
DFD – Practical Example
Launched Dec. 11, 1998, the Climate Orbiter plunged too steeply
into the Martian atmosphere Sept. 23, 1999, and either burned up
or crashed. In an initial failure report released Oct. 15, 2000 the
review board blamed the navigation error on a communications
foul-up between NASA's Jet Propulsion Laboratory and prime
contractor Lockheed Martin.
Collect,
analyze,
generate flight
control data
JPL-1
J1 JPL store
Convert data
from Metric to
English
?
LM1 LM store
Control
spaceflight
LM-1
English data
Transfer of Flight Control Data
This process
was missing
Metric data
Transfer data
?
Who was
responsible
for this task?
Slide 9
Structured English
Common Statements Example
Action Statement Profits = Revenues - Expenses
Generate Inventory - Report
Add Product record to Product Data Store
If Statement IF Customer Not in Customer Data Store
THEN Add Customer record to Customer Data Store
ELSE Add Current-Sale to Customer’s Total-Sales
Update Customer record in Customer Data Store
For Statement FOR all Customers in Customer Data Store
Generate a new line in the Customer-Report
Add Customer’s Total-Sales to Report-Total
Case Statement CASE
If Income < 10,000: Marginal-tax-rate = 10%
If Income < 20,000: Marginal-tax-rate = 20%
If Income < 30,000: Marginal-tax-rate = 31%
If Income < 40,000: Marginal-tax-rate = 35%
ELSE Marginal-tax-rate = 38%
ENDCASE
Slide 10
Key Definition
Decomposition is the process of
modeling the system and its
components in increasing levels of
detail.
Balancing involves insuring that
information presented at one level of
a DFD is accurately represented in
the next level DFD.
Slide 11
Context Diagram
Shows the context into which the
business process fits
Shows the overall business process as
just one process
Shows all the outside entities that receive
information from or contribute information
to the system
Slide 12
Relationship Among DFD
levels
Slide 13
Decomposition Diagram
Slide 14
Level 0 Diagram
Shows all the processes that comprise
the overall system
Shows how information moves from and
to each process
Adds data stores
Slide 15
Level 1 Diagrams
Shows all the processes that comprise a single
process on the level 0 diagram
Shows how information moves from and to
each of these processes
Shows in more detail the content of higher
level process
Level 1 diagrams may not be needed for all
level 0 processes
Slide 16
Level 2 Diagrams
Shows all processes that comprise a single
process on the level 1 diagram
Shows how information moves from and to
each of these processes
Level 2 diagrams may not be needed for all
level 1 processes
Correctly numbering each process helps the
user understand where the process fits into the
overall system
Slide 17
Data Flow Splits and Joins
A data flow split shows where a flow is broken into its
component parts for use in separate processes
Data flow splits need not be mutually exclusive nor use
all the data from the parent flow
As we move to lower levels we become more precise
about the data flows
A data flow join shows where components are merged
to describe a more comprehensive flow
Slide 18
Alternative Data Flows
Where a process can produce different data
given different conditions
We show both data flows and use the process
description to explain why they are alternatives
Tip -- alternative data flows often accompany
processes with IF statements
Slide 19
Creating Use Cases
Slide 20
Elements of a Use Case
Trigger -- event that causes the scenario
to begin
External trigger
Temporal trigger
All possible inputs and outputs
Individual steps
Show sequential order
Show conditional steps
Slide 21
Creating Data Flow
Diagrams
Slide 22
Integrating Scenario
Descriptions
DFDs generally integrate scenario
descriptions
Names of use cases become processes
Names of inputs and outputs become
data flows
Combining “small” data inputs and
outputs into a single flow
Slide 23
Steps in Building DFDs
Build the context diagram
Create DFD fragments for each scenario
Organize DFD fragments into level 0
Decompose level 0 DFDs as needed
Validate DFDs with user
Slide 24
DFD Fragment Tips
All process names must be verb phrases
Maintain organization’s viewpoint in naming
processes
Layouts often place
processes in the center
inputs from the left
outputs to the right
stores beneath the processes
Slide 25
A DFD Fragment Example
Slide 26
DFD – Common Errors
Miracle
Black Hole
Gray Hole
Slide 27
DFD – Packet Concept
Pay phone
bill
1
Telephone Service
Provider
Itemized calls
& invoice
Itemized calls
Invoice
Incorrect use
of the packet
concept
Correct use
of the packet
concept
Slide 28
A Second DFD Fragment
Example
Slide 29
Level 0 Tips
Generally move from top to bottom,
left to right
Minimize crossed lines
Iterate as needed
The DFD is often drawn many times
before it is finished, even with very
experienced systems analysts
Slide 30
Composite & Elementary
Flows
Slide 31
Tips for Level 1 and Below
Sources for inputs and outputs listed at higher
level
List source and destination of data flows to
processes and stores within each DFD
Depth of DFD depends on overall system
complexity
Two processes generally don’t need lower
level
More than seven processes become overly
complex and difficult to read
Slide 32
Flows to & from Data Stores
Slide 33
Illegal Data Flows
Slide 34
Validating the DFD
Syntax errors
Assure correct DFD structure
Semantics errors
Assure accuracy of DFD relative to
actual/desired business processes
User walkthroughs
Role-play processes
Examine lowest level DFDs
Examine names carefully
Slide 35
More on Use Cases,
Requirements, Projects
Slide 36
1. Use cases hold functional requirements in
an easy-to-read text format
2. They make a good framework for non-
functional requirements & project details.
3. Use cases show only the Functional req’ts.
4. Design is not done only in use case units.
How should we gather
requirements? Use cases?
Slide 37
A use case collects related scenarios
of a user’s goal succeeding or failing
UC 4: Place an order
Main scenario:
1. User identifies the customer, item and
quantity.
2. System accepts and queues the order.
Extensions:
1a. Low credit: Customer is ‘Preferred’...
1b. Low credit & not Preferred customer: ...
2a. Low on stock: Customer accepts reduced...
Slide 38
What sort of a use case fits your project:
Fully Dressed, ...?
Use Case 12. Buy stocks over the web
Primary Actor: Purchaser (user) Scope: PAF
Level: user goal Precondition: User already has PAF open.
Guarantees: sufficient log information exists that PAF can detect what went wrong.
Success Guarantees: remote web site acknowledged purchase, user's portfolio updated.
Main success scenario:
1. User selects to buy stocks over the web.
2. PAF gets name of web site to use (E*Trade, Schwabb, etc.)
3. PAF opens web connection to the site, retaining control.
4. User browses and buys stock from the web site.
5. PAF intercepts responses from the web site, and updates the user's portfolio.
6. PAF shows the user the new portfolio standing.
Extensions:
2a. User wants a web site PAF does not support:
2a1. System gets new suggestion from user, with option to cancel use case.
3a. ...
Slide 39
What sort of a use case fits your project:
..., Casual, ...?
Use Case: Buy something
The Requestor initiates a request and sends it
to her or his Approver, who completes the
request for submission and sends it to the
Buyer. The Buyer finds the best vendor, initiates
PO with Vendor.
At any time prior to receiving goods, Requestor
can change or cancel the request. Canceling it
removes it from any active processing.
Slide 40
What sort of a use case fits your project:
..., or Brief?
Actor Goal Brief Description
Production
Staff
Prepare digital
cartographic
source
Convert external digital data to
standard format, validate &
correct in preparation for
merging with operational
database.
... ... ...
Answer is, of course...
What are your project’s
Priorities and Communication Channels?
Slide 41
Use cases do not collect formulae, state,
cardinality, performance, uptime, ...
Examples:
1. Order cost = order item costs * 1.06 tax
2. Promotions may not run longer than 6 months.
3. Customers only become Preferred after ...
4. A customer has one and only one sales contact.
5. Response time is ...
6. Uptime requirement is ...
7. Number of simultaneous users will be ...
Capture those in any form available
(“just a tool problem”)
Slide 42
Goals make a good structure on which to
hang requirements & project details.
Project planning capitalizes on goal structure:
Useable Releases.
Priorities,
Schedule, staffing
Name P. Actor Pr. Diff. Rel Tm
Update customer Customer high med 1 ..
Generate invoice Finance high high 3 ..
Funds transfer Finance med high 4 ..
Scan products Customer high high 1 ..
Slide 43
Scenarios
What if...?
“Knows how to...”
“Knows how to...”
“Knows how to...”
Use the scenarios directly
to Design and Test the system.
Slide 44
Summary
The Data Flow Diagram (DFD) is an essential tool
for creating formal descriptions of business
processes and data flows.
Use cases record the input, transformation, and
output of business processes.
Eliciting scenario descriptions and modeling
business processes are critically important skills
for the systems analyst to master.

DataFlowDiagram.ppt

  • 1.
  • 2.
    Slide 2 Key Definitions Aprocess model is a formal way of representing how a business operates Data flow diagramming shows business processes and the data that flows between them
  • 3.
    Slide 3 Key Definitions Logicalprocess models describe processes without suggesting how they are conducted Physical models include information about how the processes are implemented
  • 4.
  • 5.
  • 6.
  • 7.
    Slide 7 DFD Shapesfrom Visio From Flow Chart / Data Flow Diagram Process Data Store External Entity From Software Diagram / Gane-Sarson DFD Process ID # ID # External Entity Data Store 1 External Entity Data Store Process From Flow Chart / Data Flow Diagram Visio 5.x Visio 2000
  • 8.
    Slide 8 DFD –Practical Example Launched Dec. 11, 1998, the Climate Orbiter plunged too steeply into the Martian atmosphere Sept. 23, 1999, and either burned up or crashed. In an initial failure report released Oct. 15, 2000 the review board blamed the navigation error on a communications foul-up between NASA's Jet Propulsion Laboratory and prime contractor Lockheed Martin. Collect, analyze, generate flight control data JPL-1 J1 JPL store Convert data from Metric to English ? LM1 LM store Control spaceflight LM-1 English data Transfer of Flight Control Data This process was missing Metric data Transfer data ? Who was responsible for this task?
  • 9.
    Slide 9 Structured English CommonStatements Example Action Statement Profits = Revenues - Expenses Generate Inventory - Report Add Product record to Product Data Store If Statement IF Customer Not in Customer Data Store THEN Add Customer record to Customer Data Store ELSE Add Current-Sale to Customer’s Total-Sales Update Customer record in Customer Data Store For Statement FOR all Customers in Customer Data Store Generate a new line in the Customer-Report Add Customer’s Total-Sales to Report-Total Case Statement CASE If Income < 10,000: Marginal-tax-rate = 10% If Income < 20,000: Marginal-tax-rate = 20% If Income < 30,000: Marginal-tax-rate = 31% If Income < 40,000: Marginal-tax-rate = 35% ELSE Marginal-tax-rate = 38% ENDCASE
  • 10.
    Slide 10 Key Definition Decompositionis the process of modeling the system and its components in increasing levels of detail. Balancing involves insuring that information presented at one level of a DFD is accurately represented in the next level DFD.
  • 11.
    Slide 11 Context Diagram Showsthe context into which the business process fits Shows the overall business process as just one process Shows all the outside entities that receive information from or contribute information to the system
  • 12.
  • 13.
  • 14.
    Slide 14 Level 0Diagram Shows all the processes that comprise the overall system Shows how information moves from and to each process Adds data stores
  • 15.
    Slide 15 Level 1Diagrams Shows all the processes that comprise a single process on the level 0 diagram Shows how information moves from and to each of these processes Shows in more detail the content of higher level process Level 1 diagrams may not be needed for all level 0 processes
  • 16.
    Slide 16 Level 2Diagrams Shows all processes that comprise a single process on the level 1 diagram Shows how information moves from and to each of these processes Level 2 diagrams may not be needed for all level 1 processes Correctly numbering each process helps the user understand where the process fits into the overall system
  • 17.
    Slide 17 Data FlowSplits and Joins A data flow split shows where a flow is broken into its component parts for use in separate processes Data flow splits need not be mutually exclusive nor use all the data from the parent flow As we move to lower levels we become more precise about the data flows A data flow join shows where components are merged to describe a more comprehensive flow
  • 18.
    Slide 18 Alternative DataFlows Where a process can produce different data given different conditions We show both data flows and use the process description to explain why they are alternatives Tip -- alternative data flows often accompany processes with IF statements
  • 19.
  • 20.
    Slide 20 Elements ofa Use Case Trigger -- event that causes the scenario to begin External trigger Temporal trigger All possible inputs and outputs Individual steps Show sequential order Show conditional steps
  • 21.
  • 22.
    Slide 22 Integrating Scenario Descriptions DFDsgenerally integrate scenario descriptions Names of use cases become processes Names of inputs and outputs become data flows Combining “small” data inputs and outputs into a single flow
  • 23.
    Slide 23 Steps inBuilding DFDs Build the context diagram Create DFD fragments for each scenario Organize DFD fragments into level 0 Decompose level 0 DFDs as needed Validate DFDs with user
  • 24.
    Slide 24 DFD FragmentTips All process names must be verb phrases Maintain organization’s viewpoint in naming processes Layouts often place processes in the center inputs from the left outputs to the right stores beneath the processes
  • 25.
    Slide 25 A DFDFragment Example
  • 26.
    Slide 26 DFD –Common Errors Miracle Black Hole Gray Hole
  • 27.
    Slide 27 DFD –Packet Concept Pay phone bill 1 Telephone Service Provider Itemized calls & invoice Itemized calls Invoice Incorrect use of the packet concept Correct use of the packet concept
  • 28.
    Slide 28 A SecondDFD Fragment Example
  • 29.
    Slide 29 Level 0Tips Generally move from top to bottom, left to right Minimize crossed lines Iterate as needed The DFD is often drawn many times before it is finished, even with very experienced systems analysts
  • 30.
    Slide 30 Composite &Elementary Flows
  • 31.
    Slide 31 Tips forLevel 1 and Below Sources for inputs and outputs listed at higher level List source and destination of data flows to processes and stores within each DFD Depth of DFD depends on overall system complexity Two processes generally don’t need lower level More than seven processes become overly complex and difficult to read
  • 32.
    Slide 32 Flows to& from Data Stores
  • 33.
  • 34.
    Slide 34 Validating theDFD Syntax errors Assure correct DFD structure Semantics errors Assure accuracy of DFD relative to actual/desired business processes User walkthroughs Role-play processes Examine lowest level DFDs Examine names carefully
  • 35.
    Slide 35 More onUse Cases, Requirements, Projects
  • 36.
    Slide 36 1. Usecases hold functional requirements in an easy-to-read text format 2. They make a good framework for non- functional requirements & project details. 3. Use cases show only the Functional req’ts. 4. Design is not done only in use case units. How should we gather requirements? Use cases?
  • 37.
    Slide 37 A usecase collects related scenarios of a user’s goal succeeding or failing UC 4: Place an order Main scenario: 1. User identifies the customer, item and quantity. 2. System accepts and queues the order. Extensions: 1a. Low credit: Customer is ‘Preferred’... 1b. Low credit & not Preferred customer: ... 2a. Low on stock: Customer accepts reduced...
  • 38.
    Slide 38 What sortof a use case fits your project: Fully Dressed, ...? Use Case 12. Buy stocks over the web Primary Actor: Purchaser (user) Scope: PAF Level: user goal Precondition: User already has PAF open. Guarantees: sufficient log information exists that PAF can detect what went wrong. Success Guarantees: remote web site acknowledged purchase, user's portfolio updated. Main success scenario: 1. User selects to buy stocks over the web. 2. PAF gets name of web site to use (E*Trade, Schwabb, etc.) 3. PAF opens web connection to the site, retaining control. 4. User browses and buys stock from the web site. 5. PAF intercepts responses from the web site, and updates the user's portfolio. 6. PAF shows the user the new portfolio standing. Extensions: 2a. User wants a web site PAF does not support: 2a1. System gets new suggestion from user, with option to cancel use case. 3a. ...
  • 39.
    Slide 39 What sortof a use case fits your project: ..., Casual, ...? Use Case: Buy something The Requestor initiates a request and sends it to her or his Approver, who completes the request for submission and sends it to the Buyer. The Buyer finds the best vendor, initiates PO with Vendor. At any time prior to receiving goods, Requestor can change or cancel the request. Canceling it removes it from any active processing.
  • 40.
    Slide 40 What sortof a use case fits your project: ..., or Brief? Actor Goal Brief Description Production Staff Prepare digital cartographic source Convert external digital data to standard format, validate & correct in preparation for merging with operational database. ... ... ... Answer is, of course... What are your project’s Priorities and Communication Channels?
  • 41.
    Slide 41 Use casesdo not collect formulae, state, cardinality, performance, uptime, ... Examples: 1. Order cost = order item costs * 1.06 tax 2. Promotions may not run longer than 6 months. 3. Customers only become Preferred after ... 4. A customer has one and only one sales contact. 5. Response time is ... 6. Uptime requirement is ... 7. Number of simultaneous users will be ... Capture those in any form available (“just a tool problem”)
  • 42.
    Slide 42 Goals makea good structure on which to hang requirements & project details. Project planning capitalizes on goal structure: Useable Releases. Priorities, Schedule, staffing Name P. Actor Pr. Diff. Rel Tm Update customer Customer high med 1 .. Generate invoice Finance high high 3 .. Funds transfer Finance med high 4 .. Scan products Customer high high 1 ..
  • 43.
    Slide 43 Scenarios What if...? “Knowshow to...” “Knows how to...” “Knows how to...” Use the scenarios directly to Design and Test the system.
  • 44.
    Slide 44 Summary The DataFlow Diagram (DFD) is an essential tool for creating formal descriptions of business processes and data flows. Use cases record the input, transformation, and output of business processes. Eliciting scenario descriptions and modeling business processes are critically important skills for the systems analyst to master.

Editor's Notes