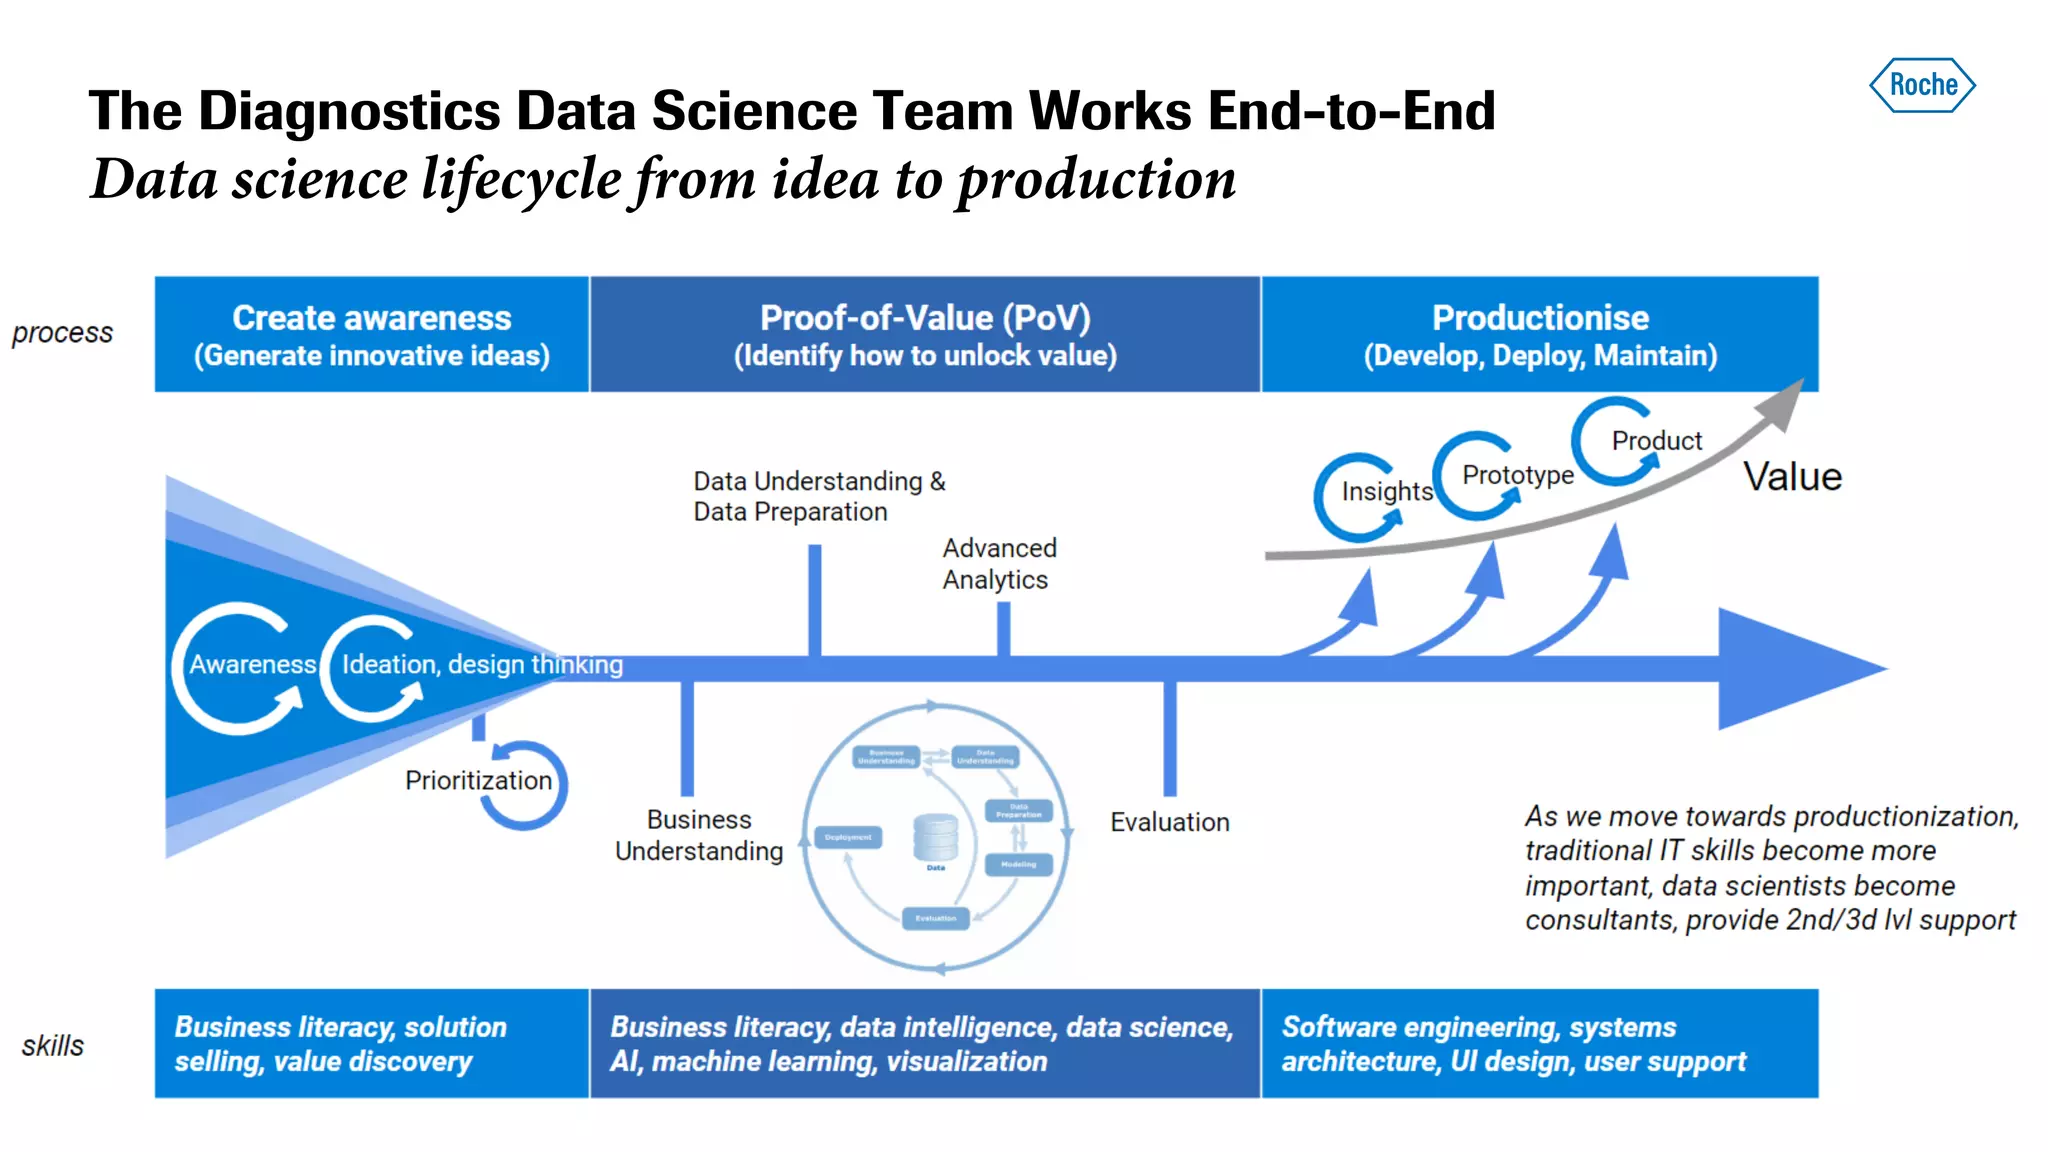
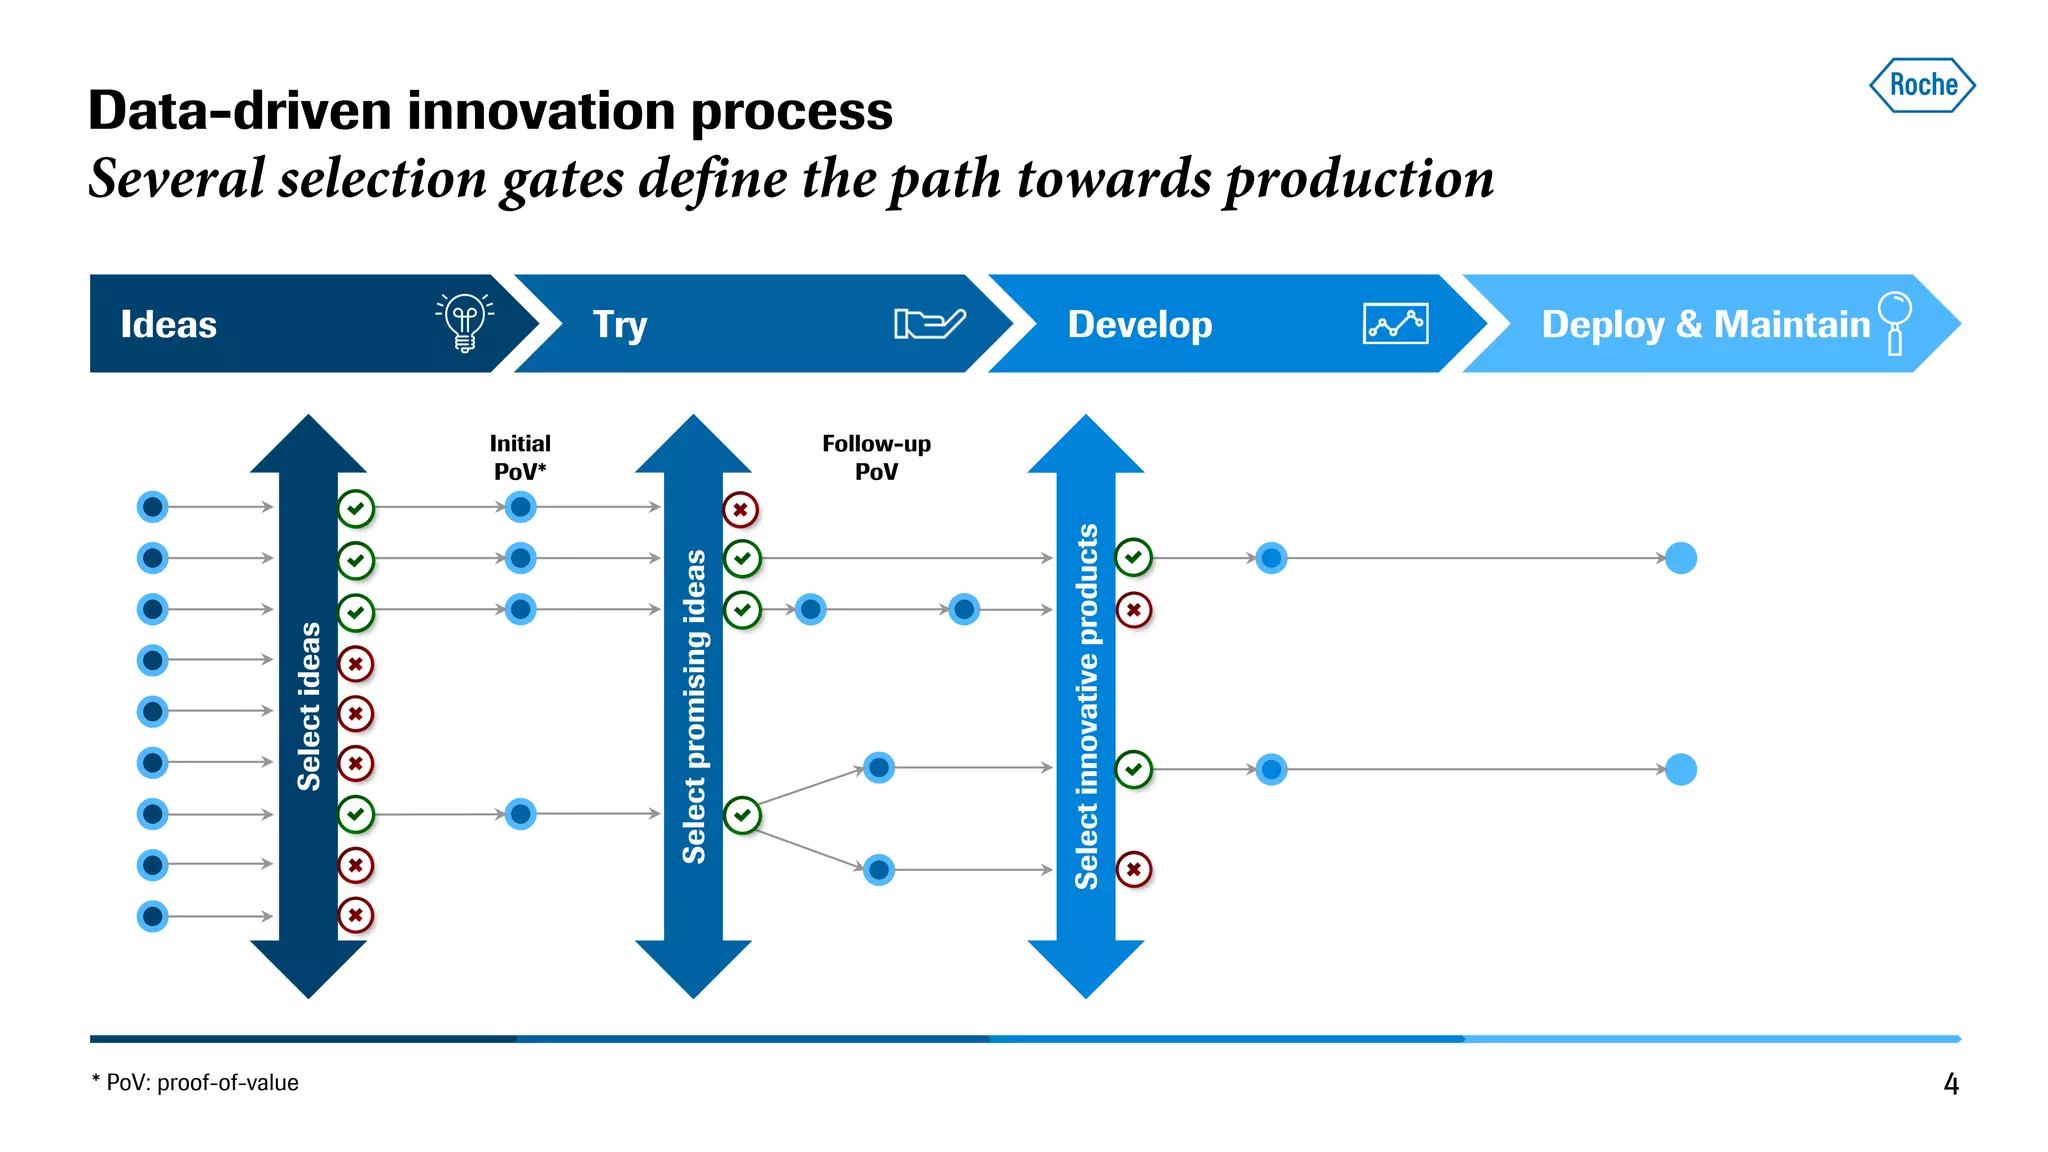
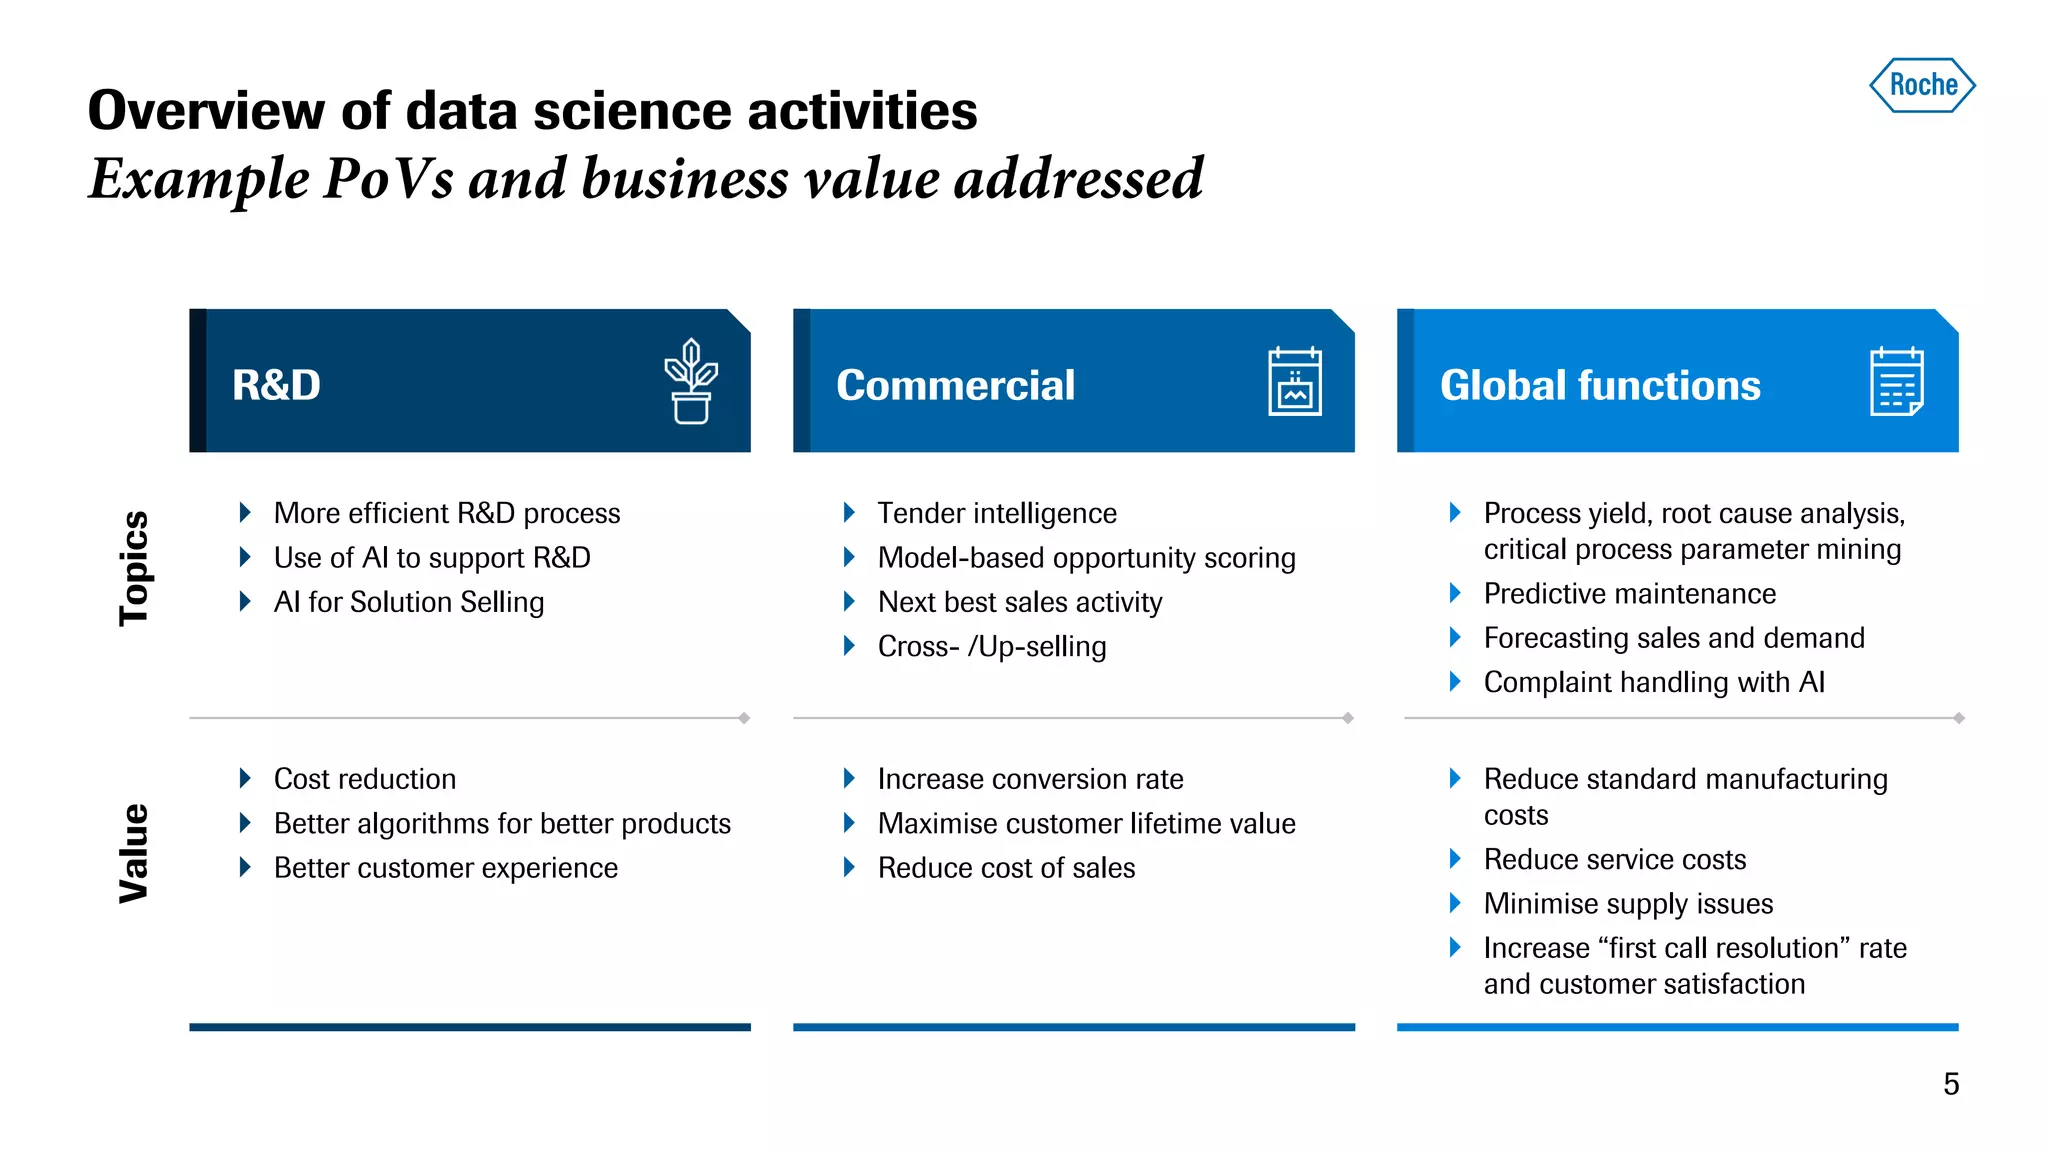
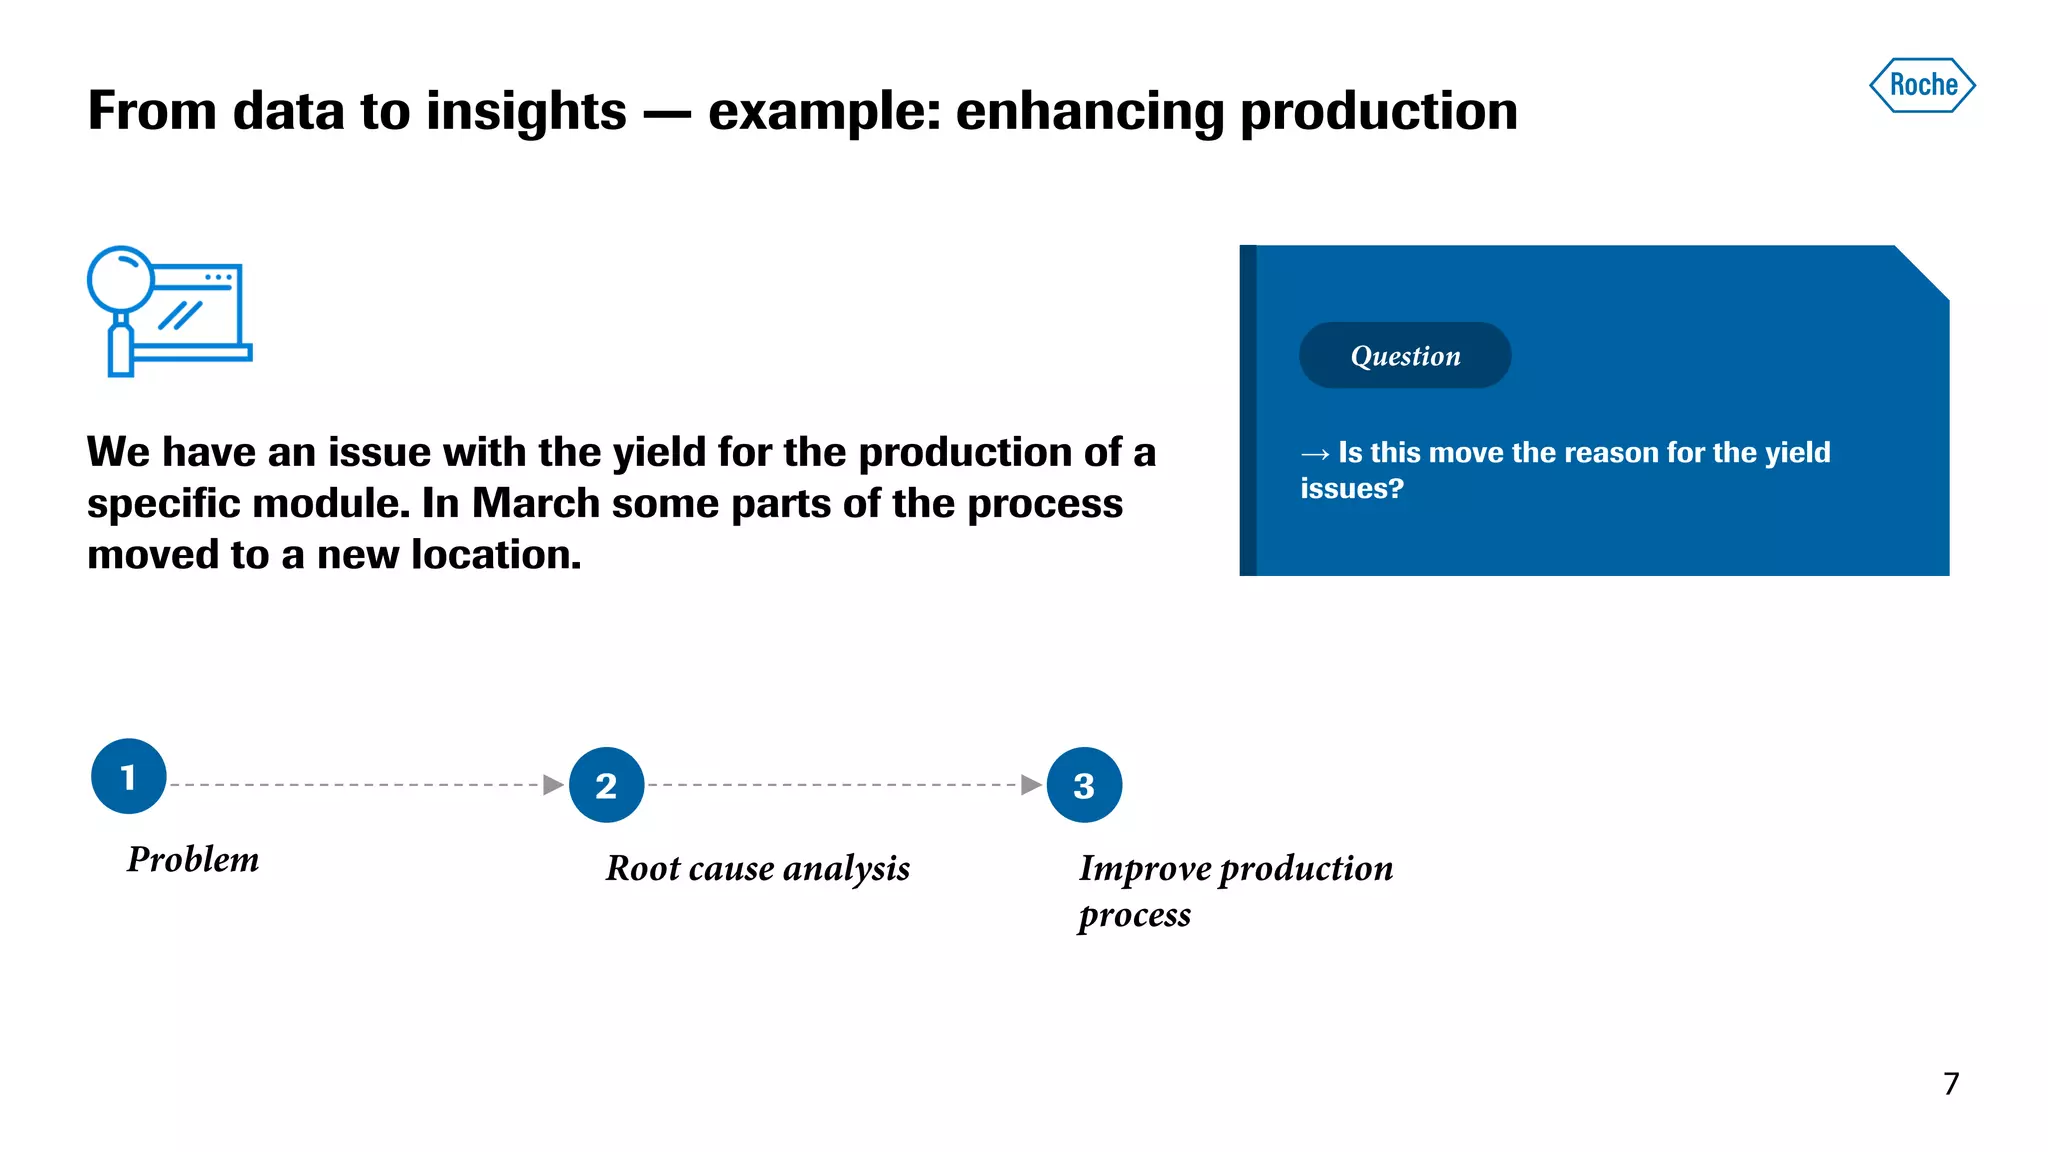
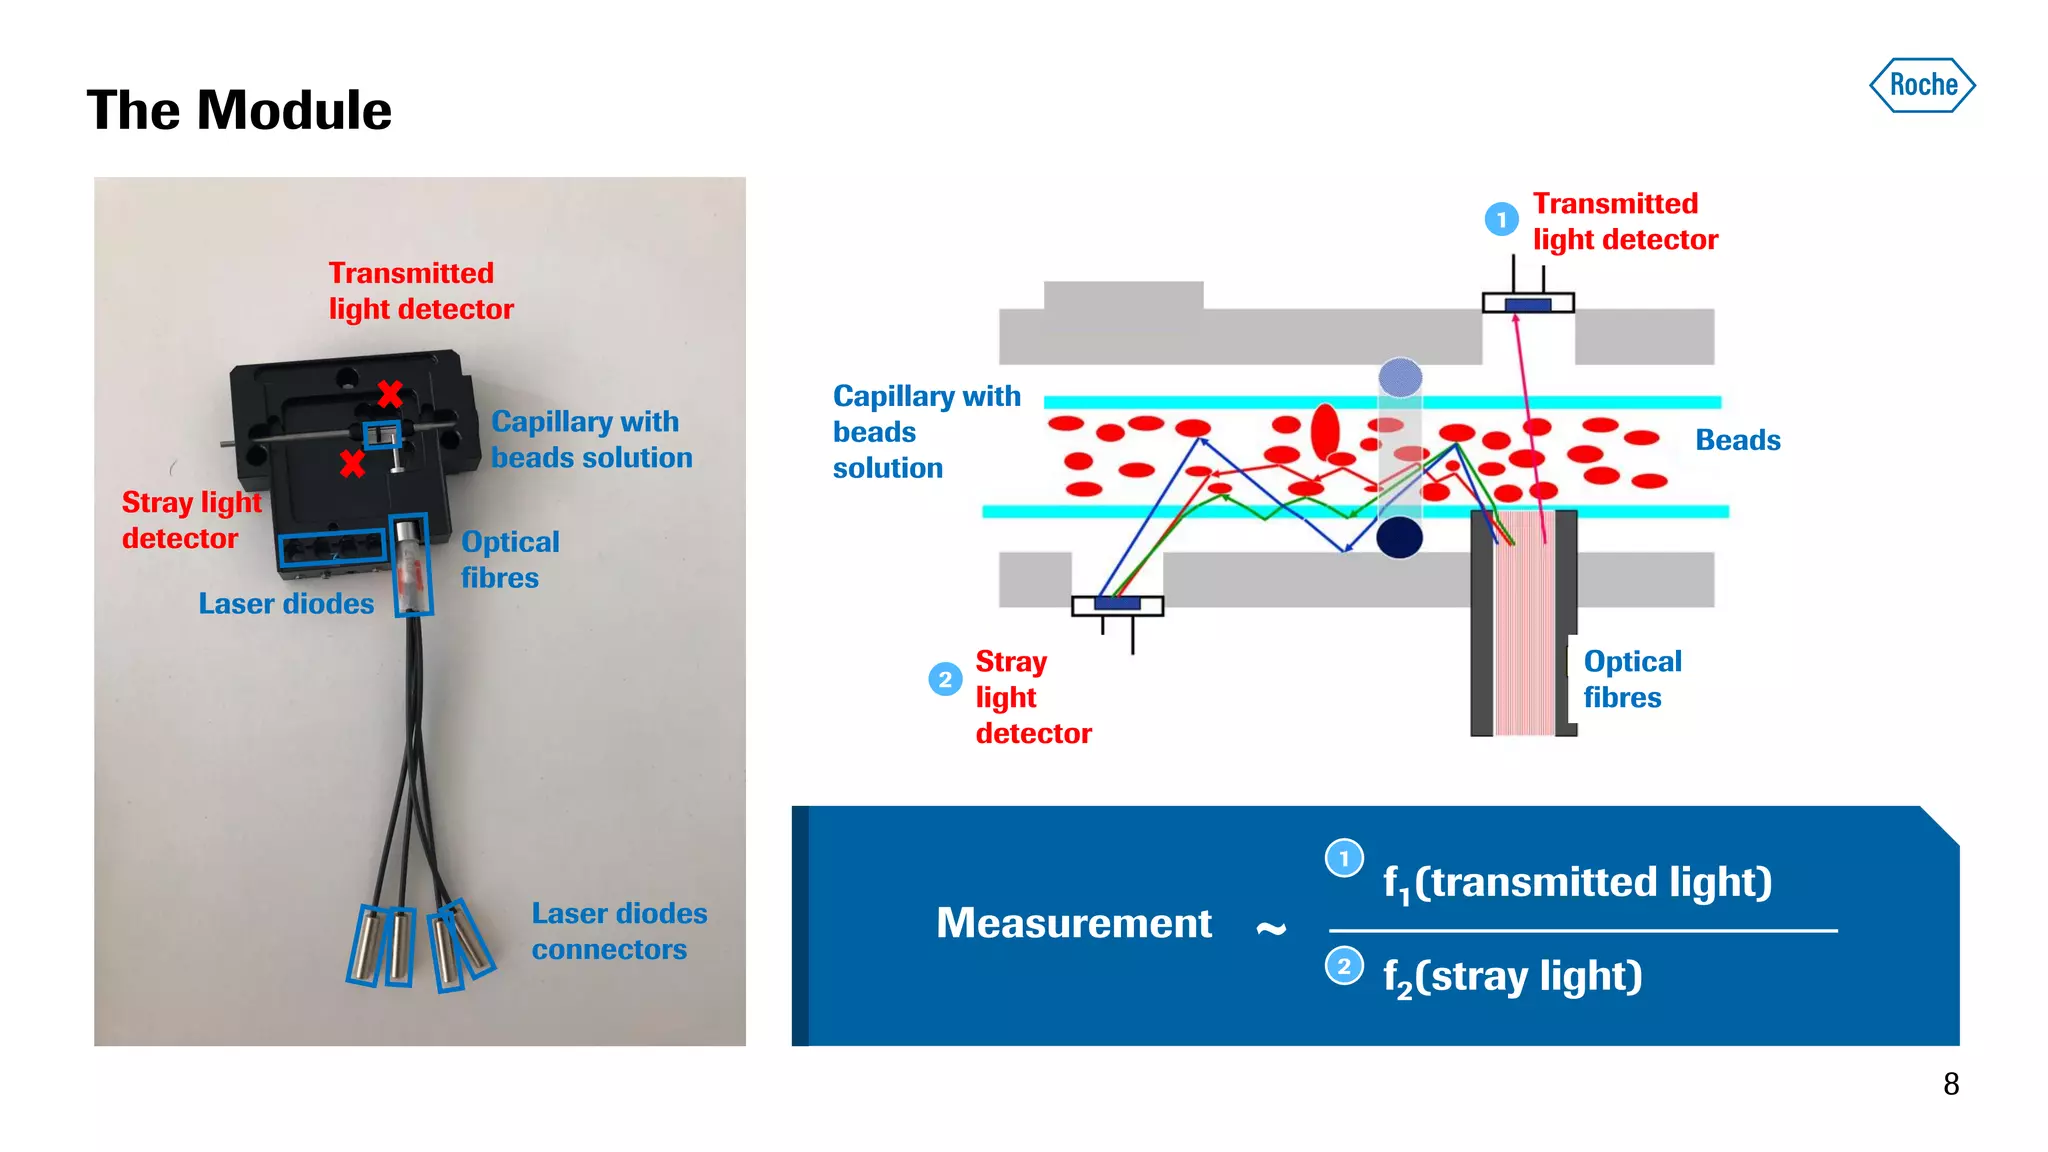
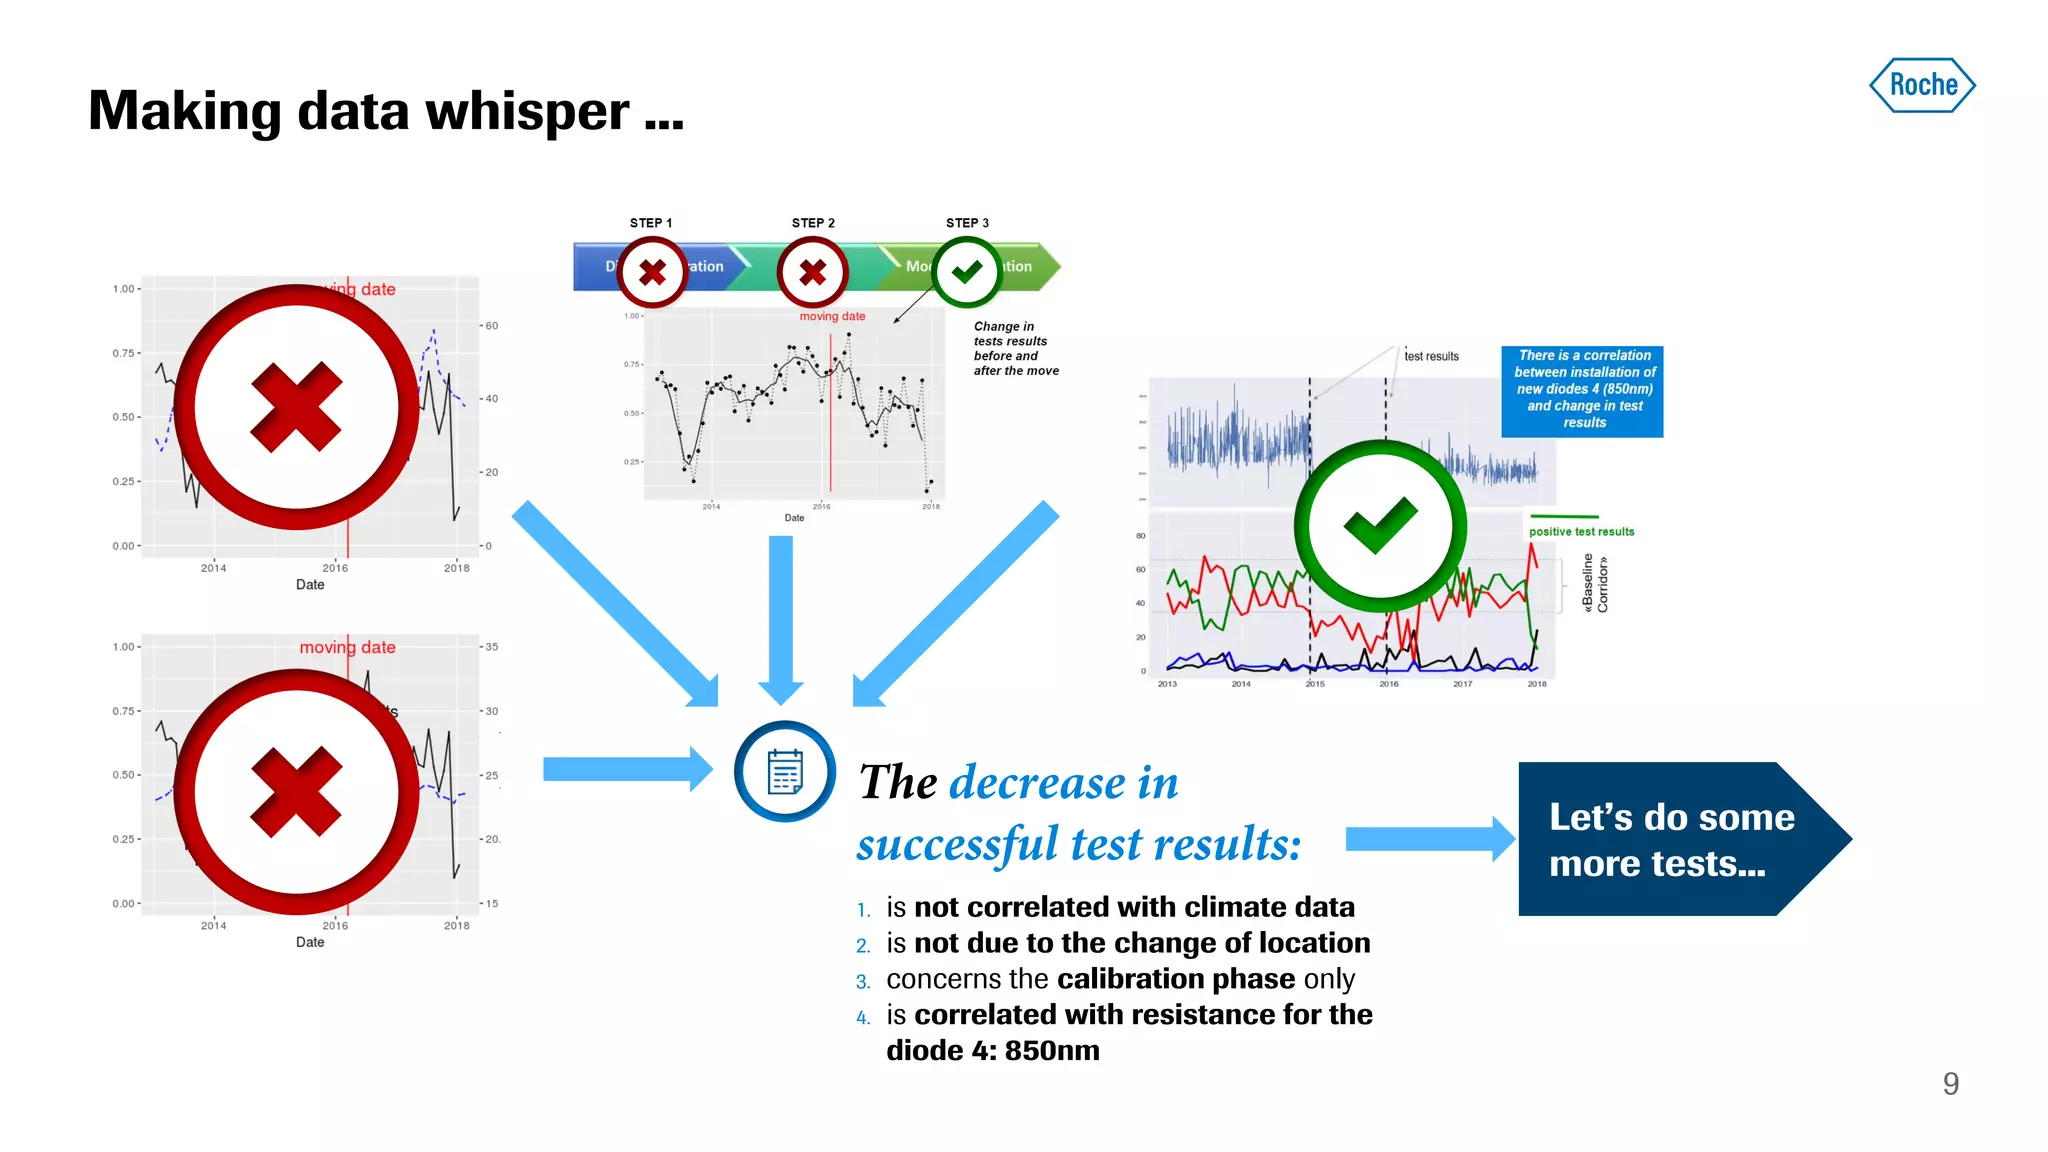
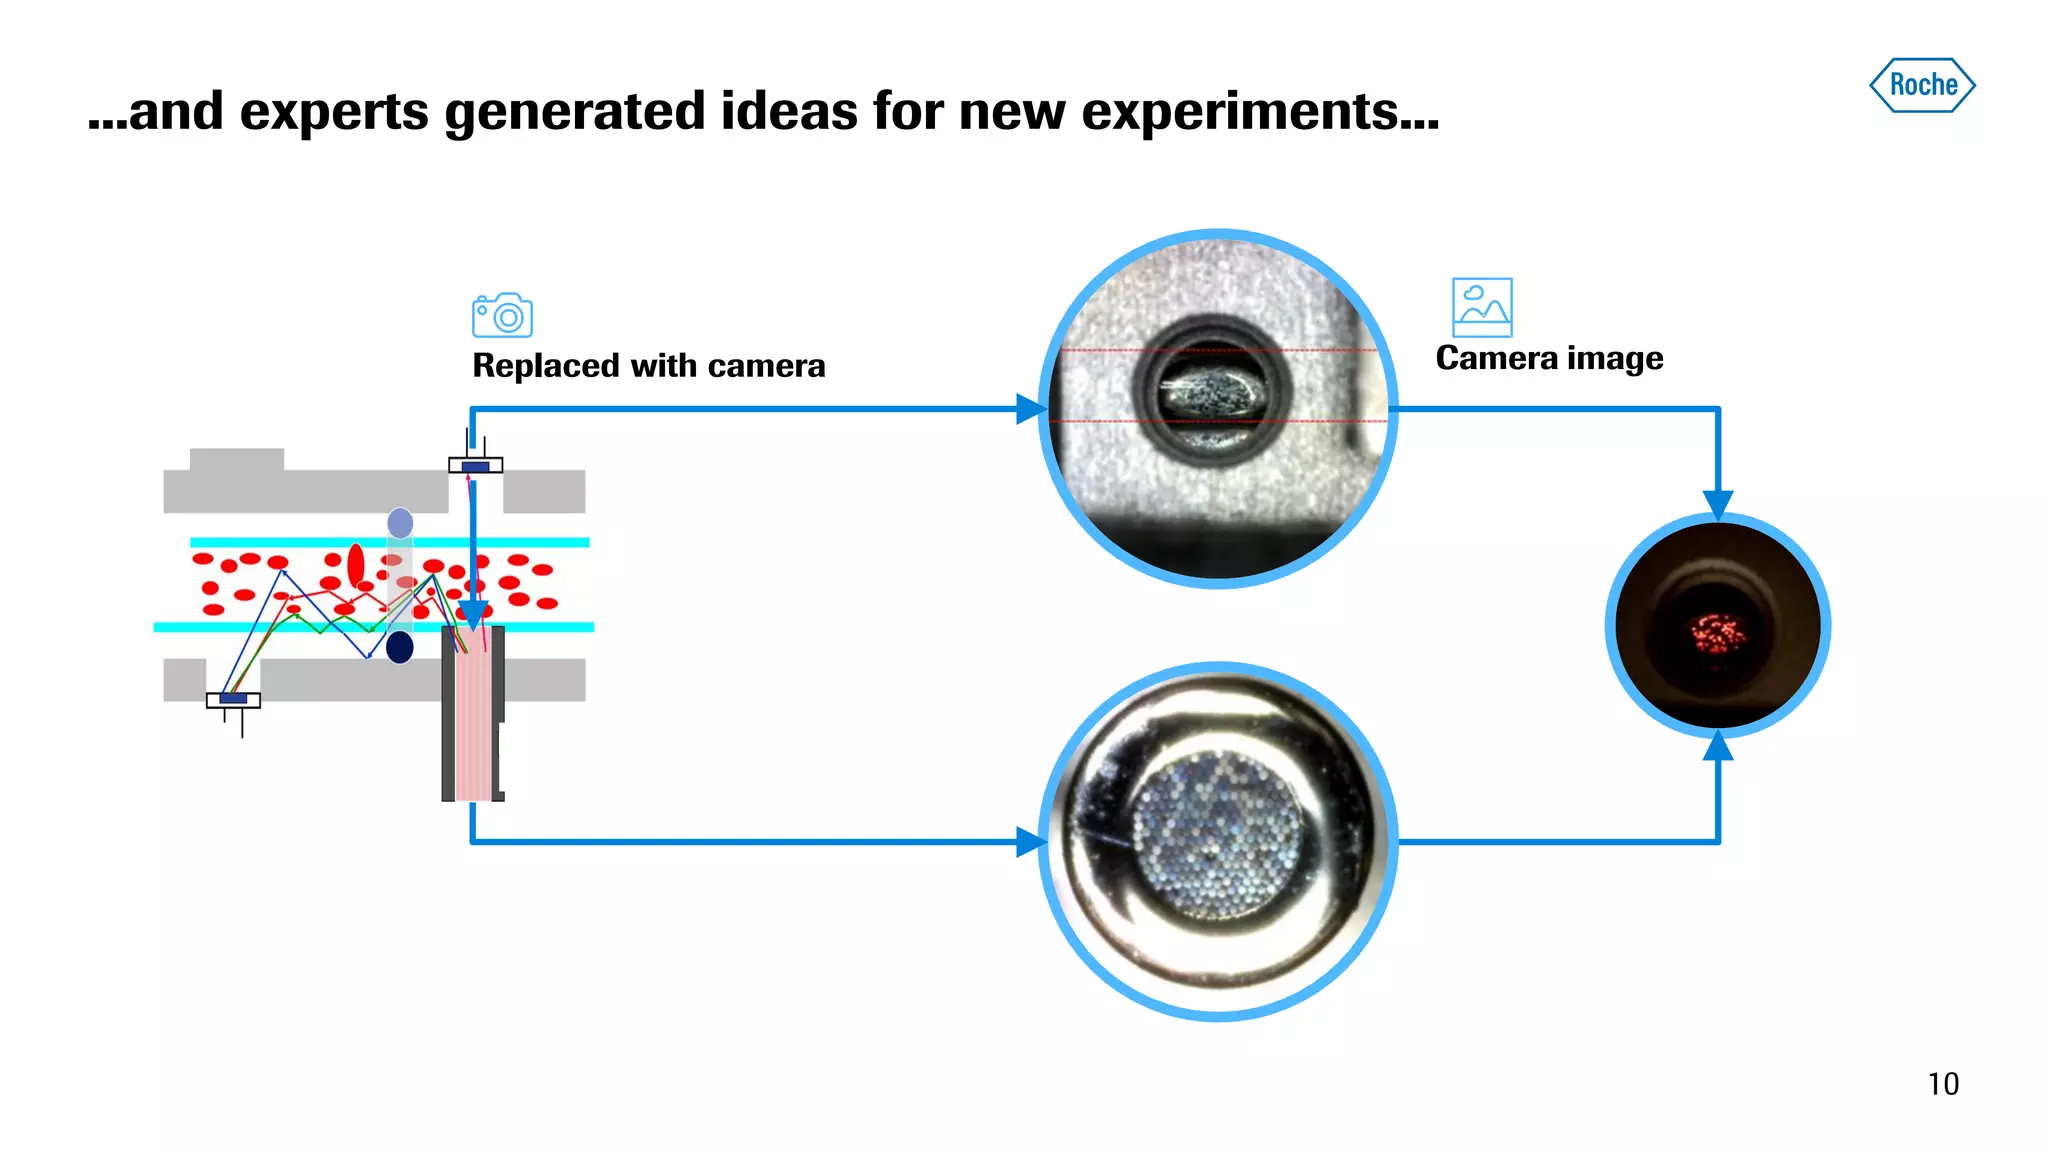
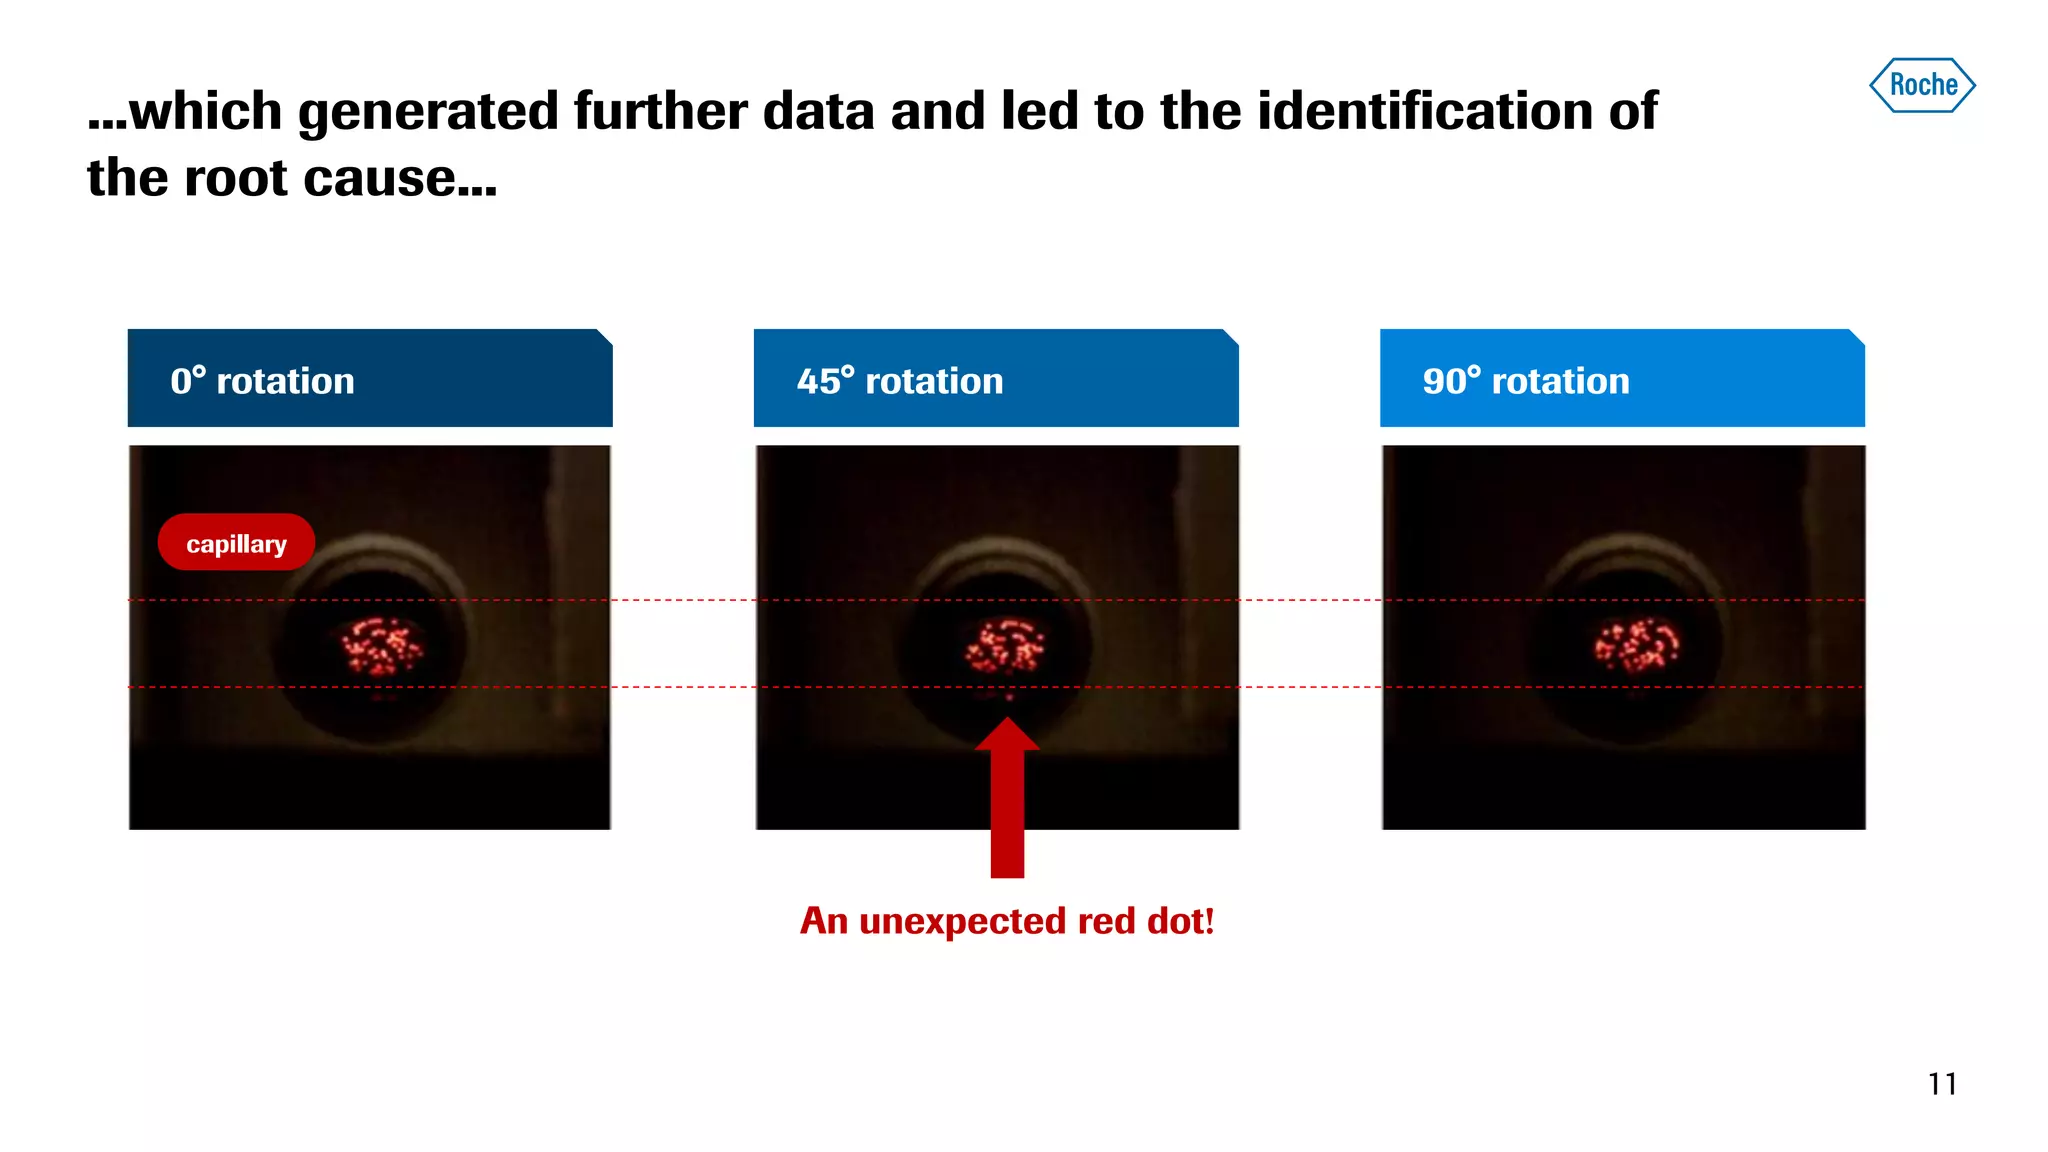
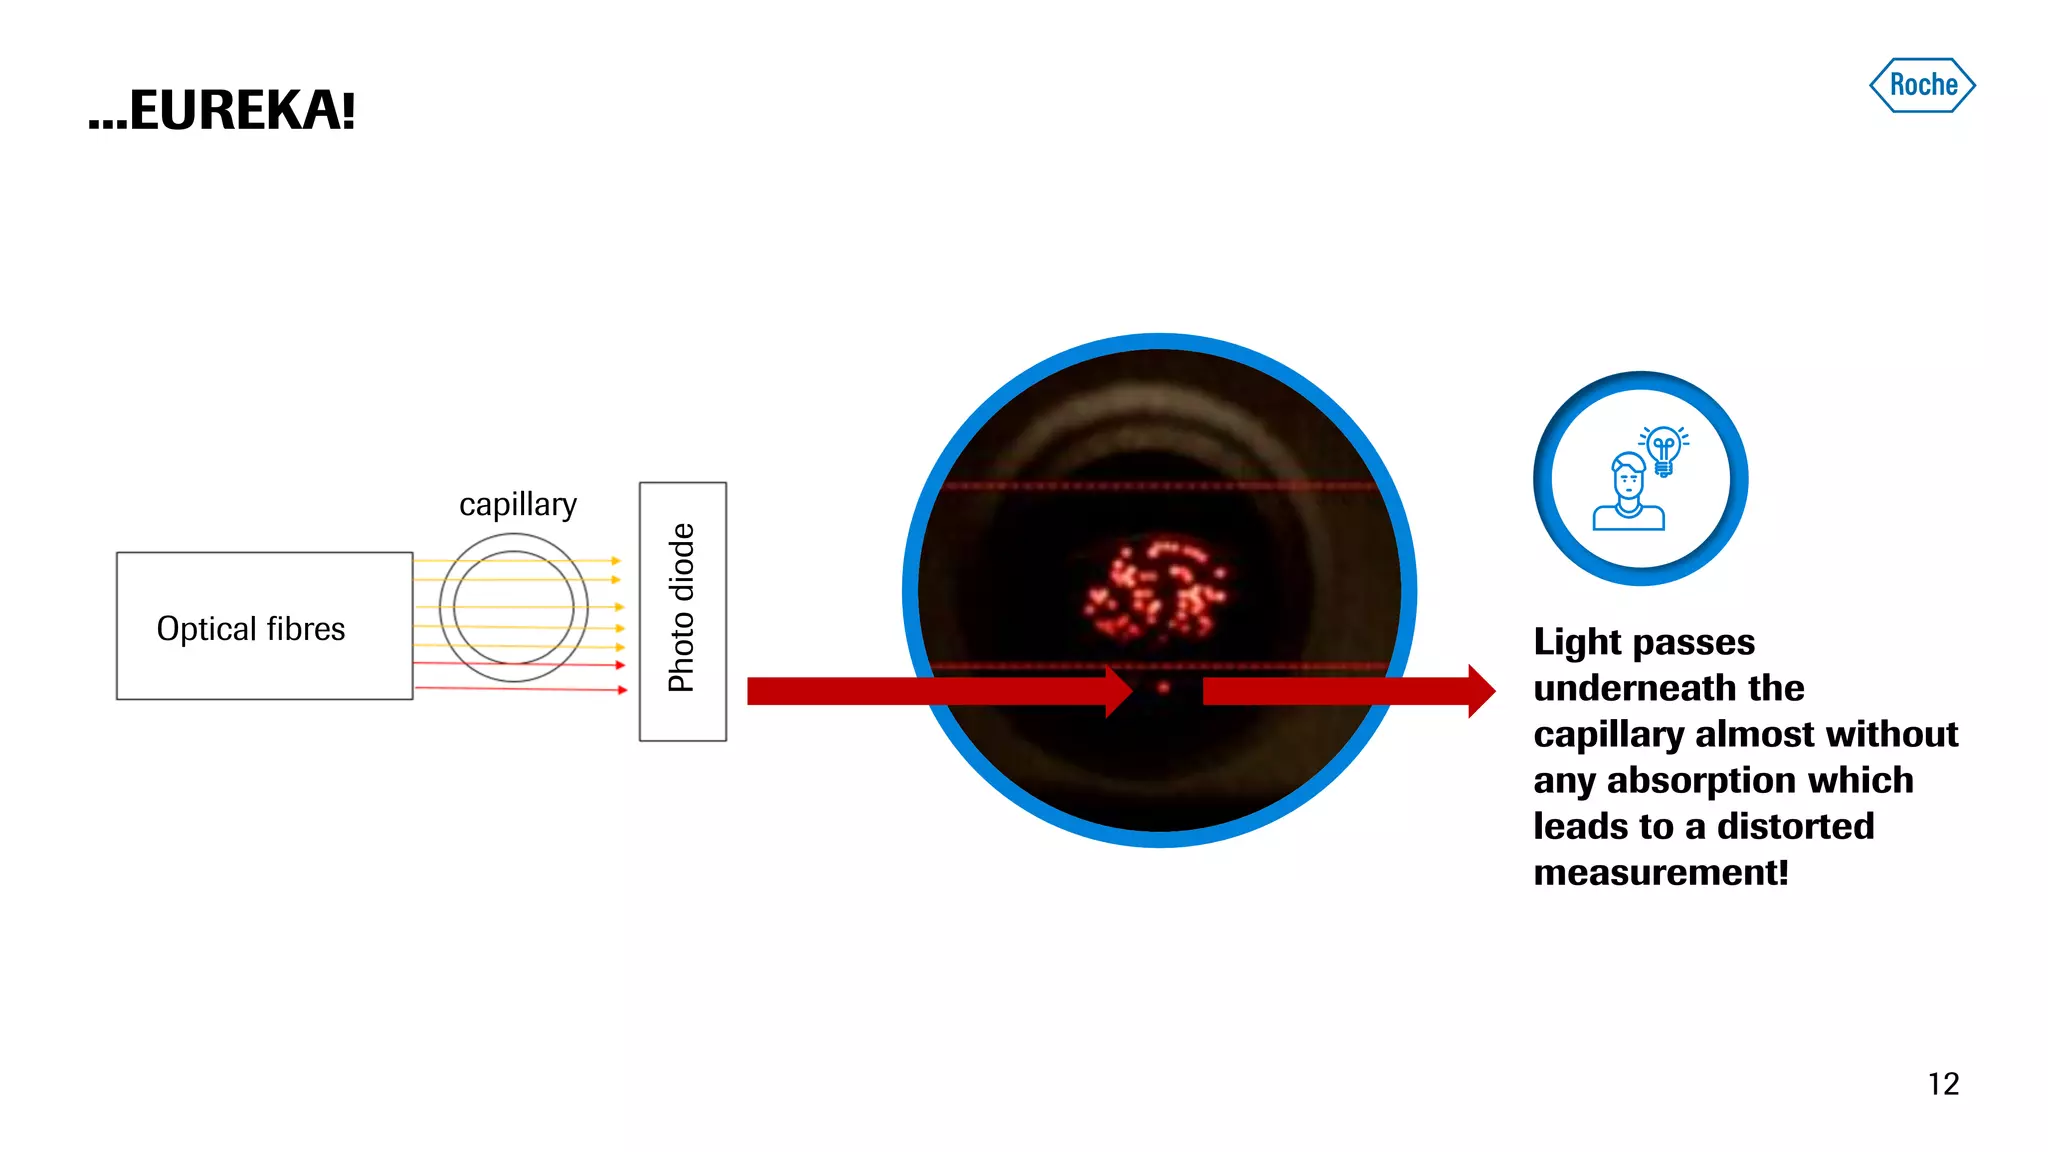
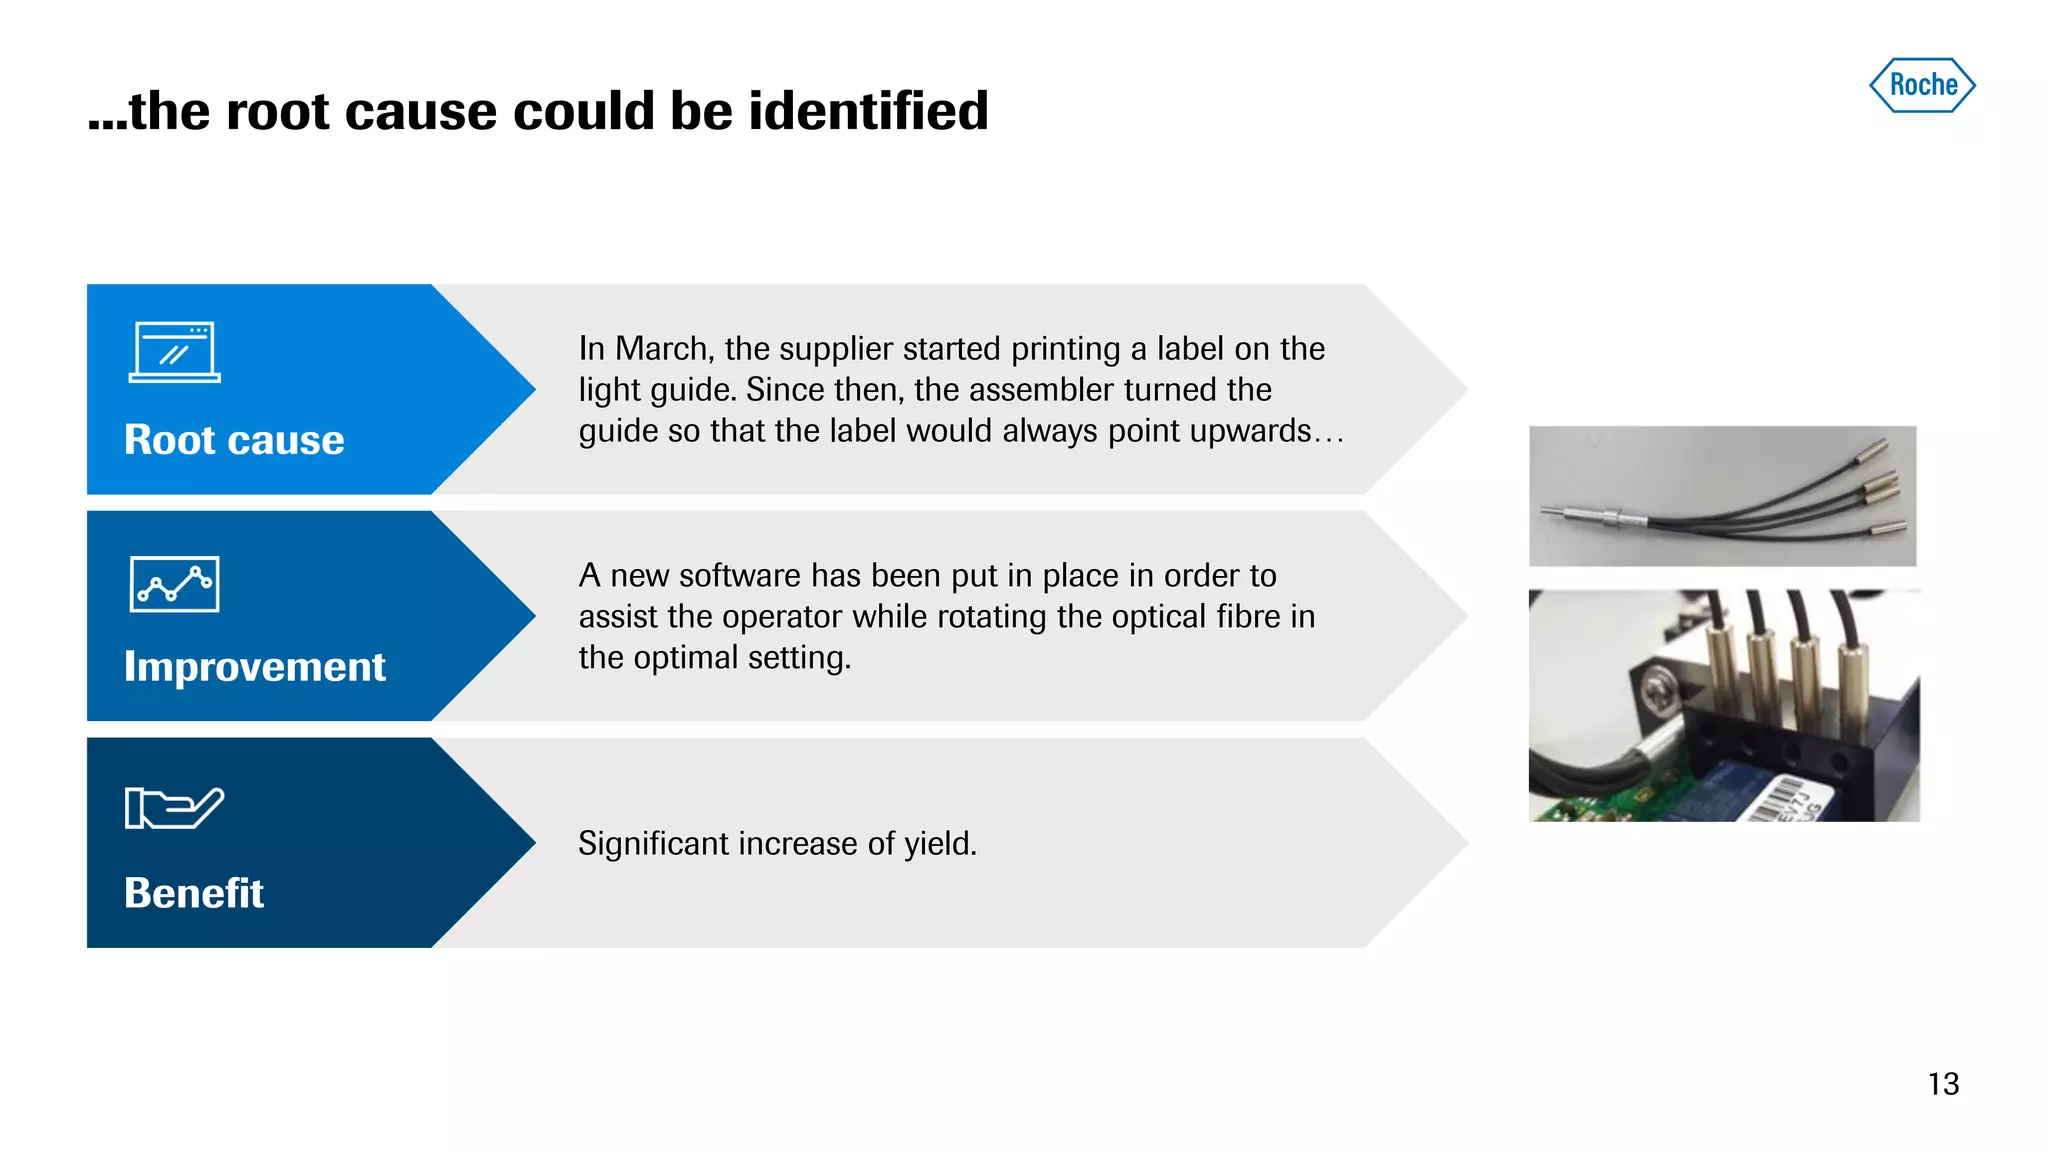
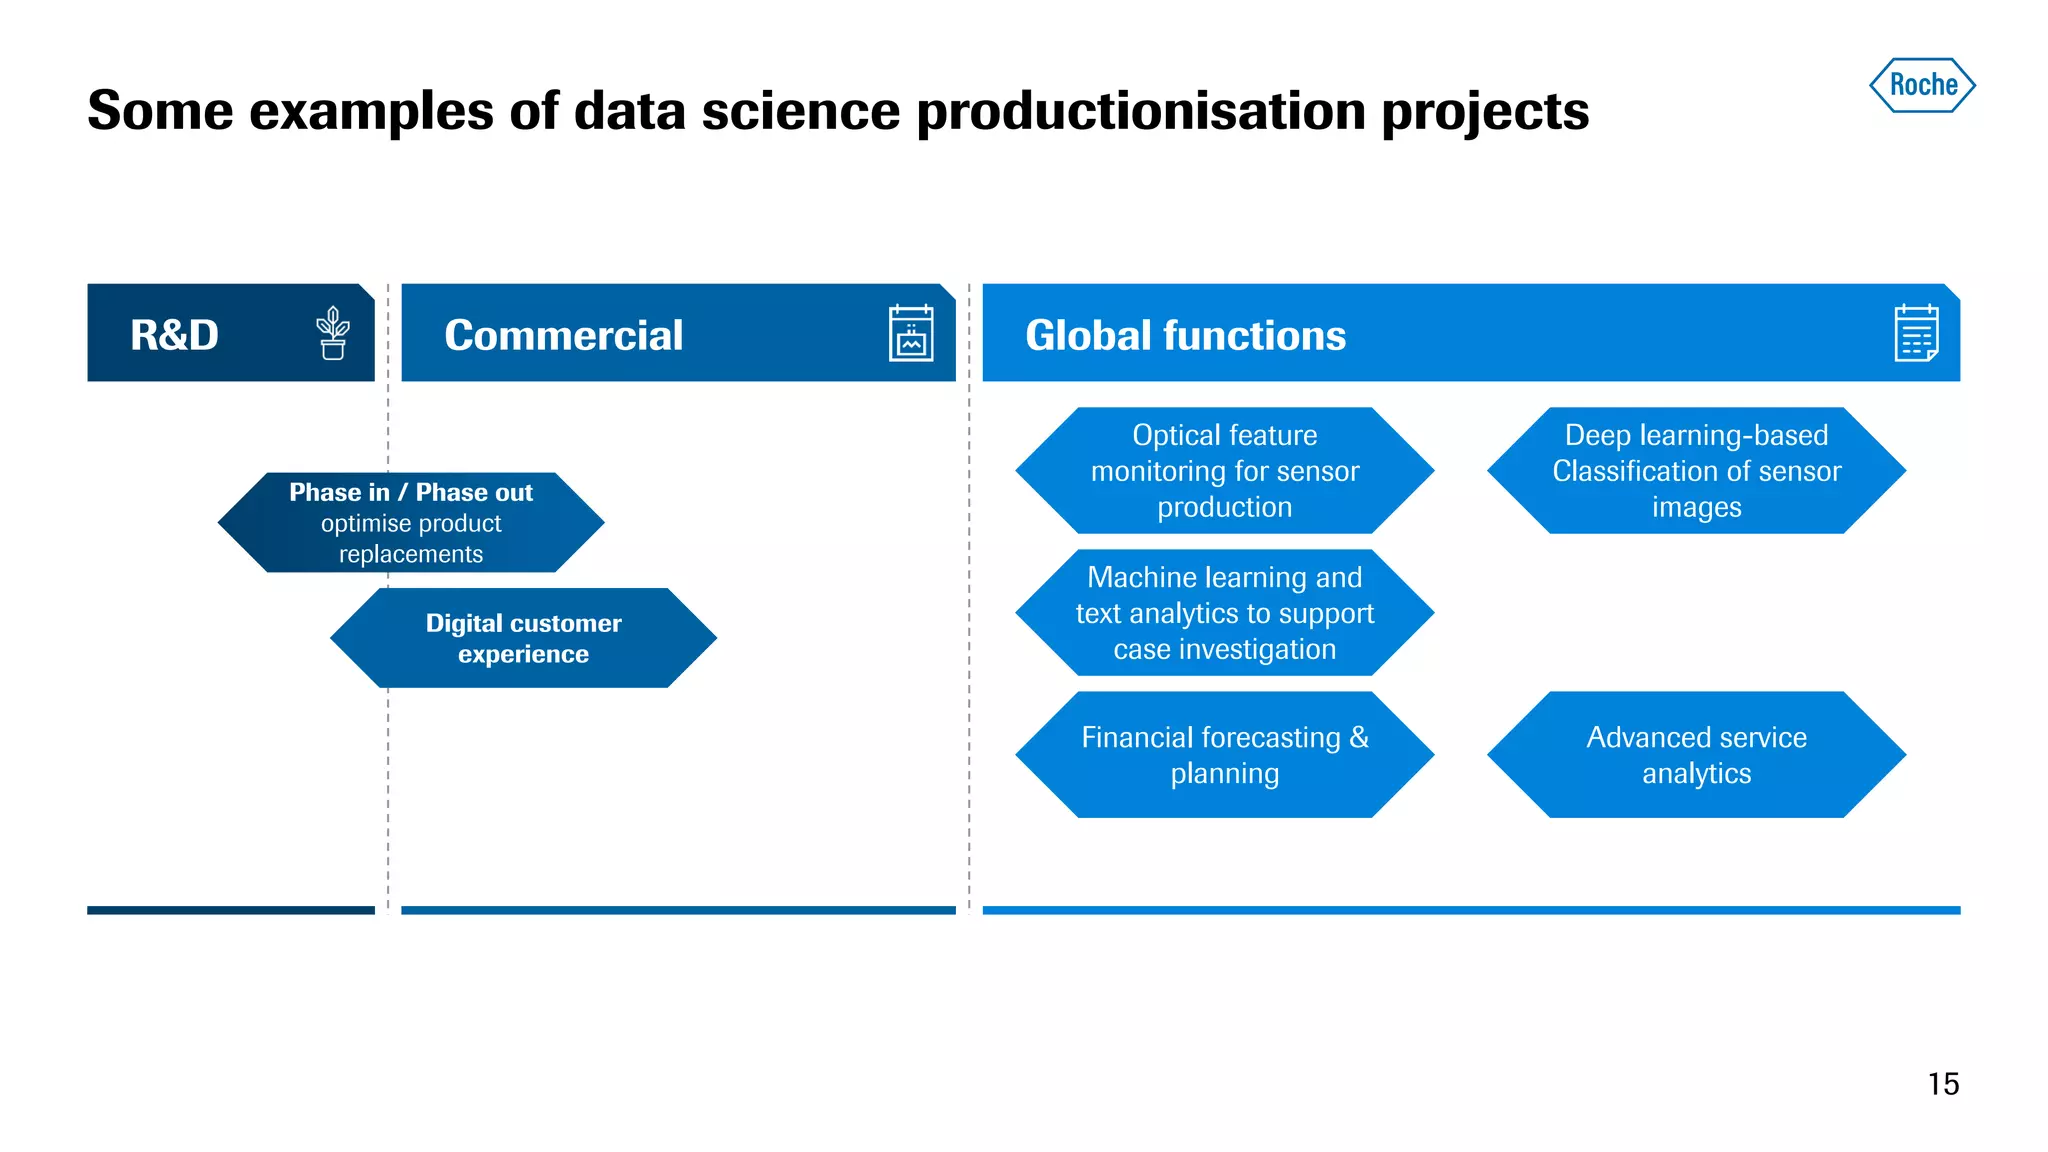
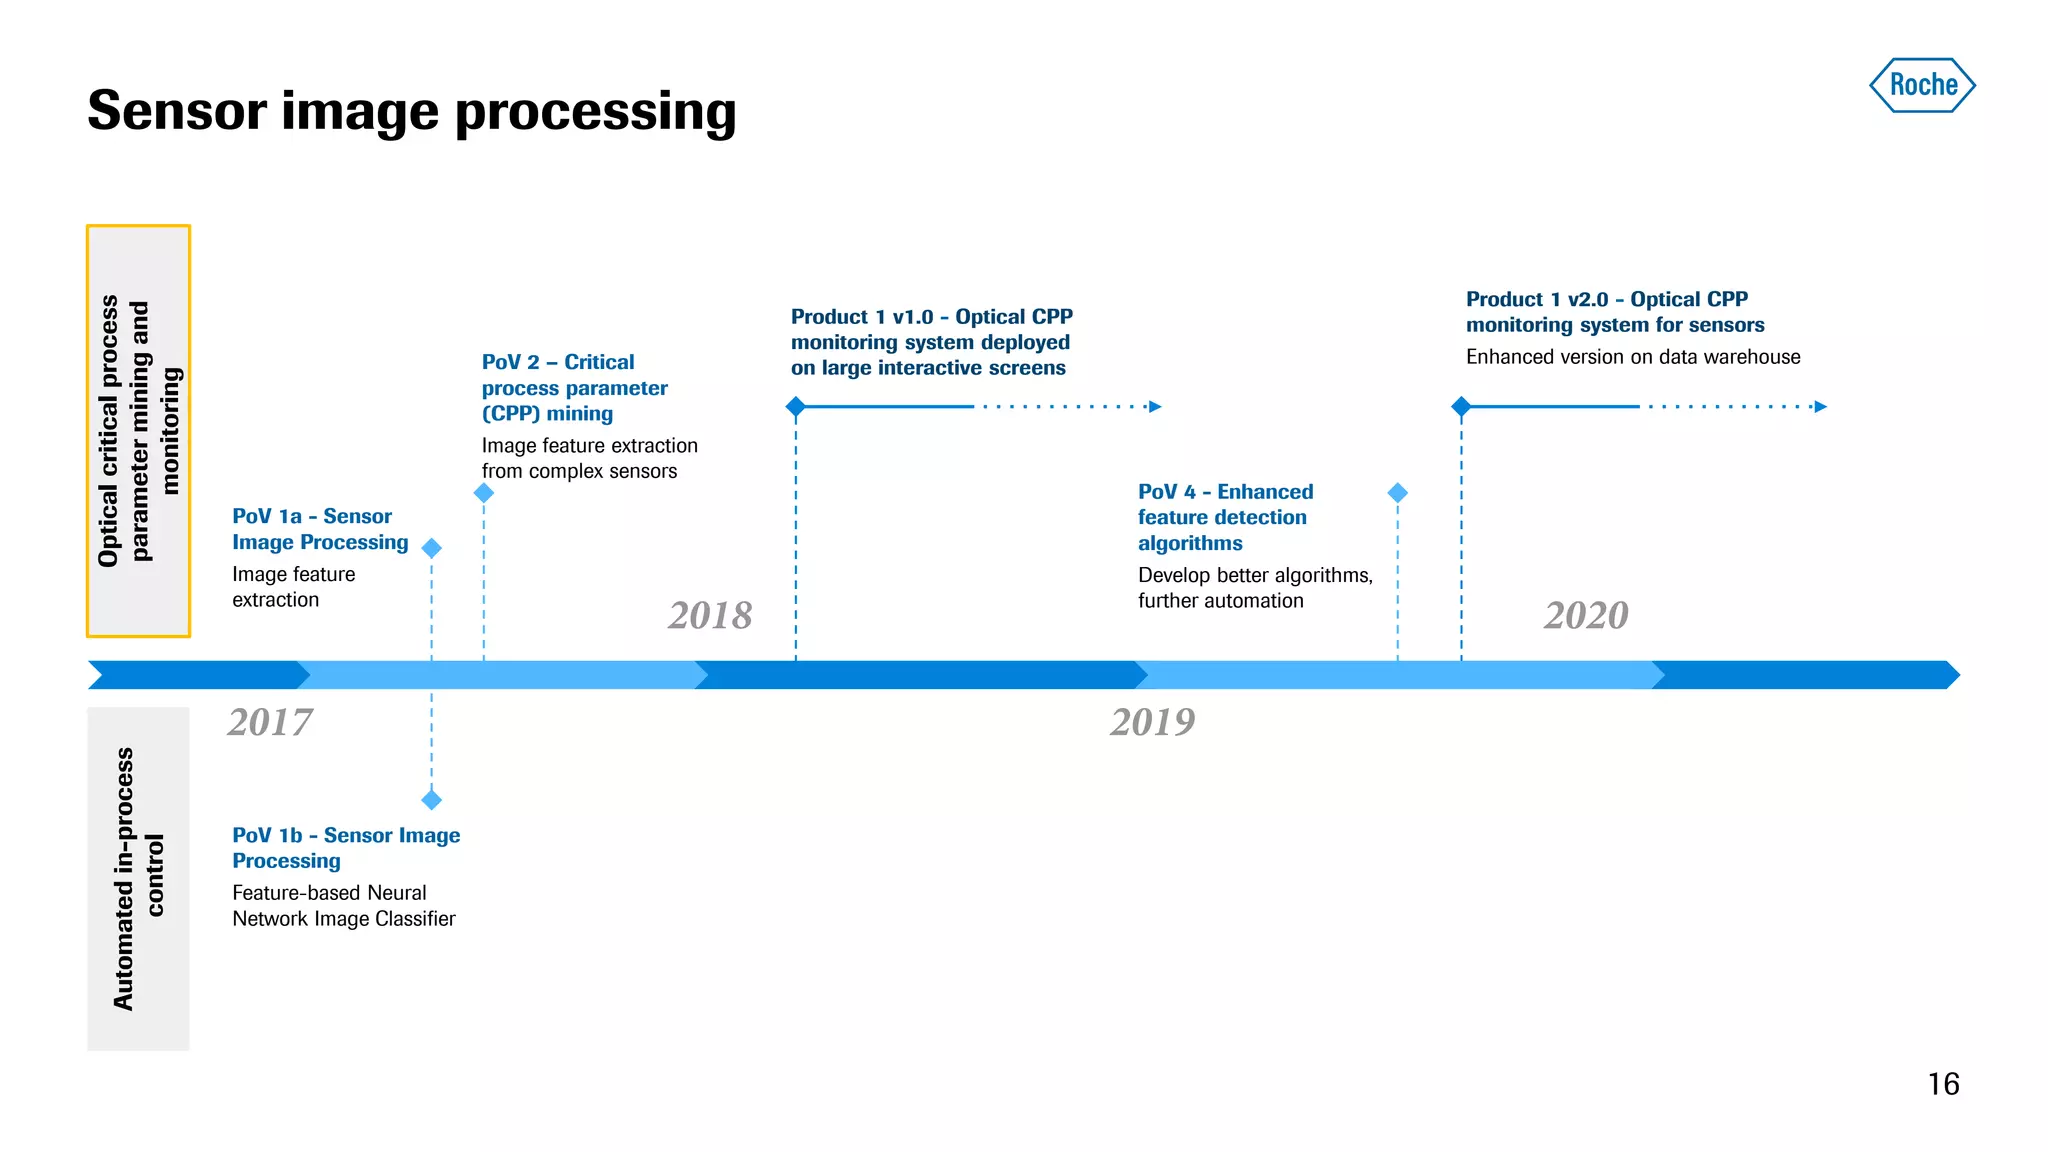
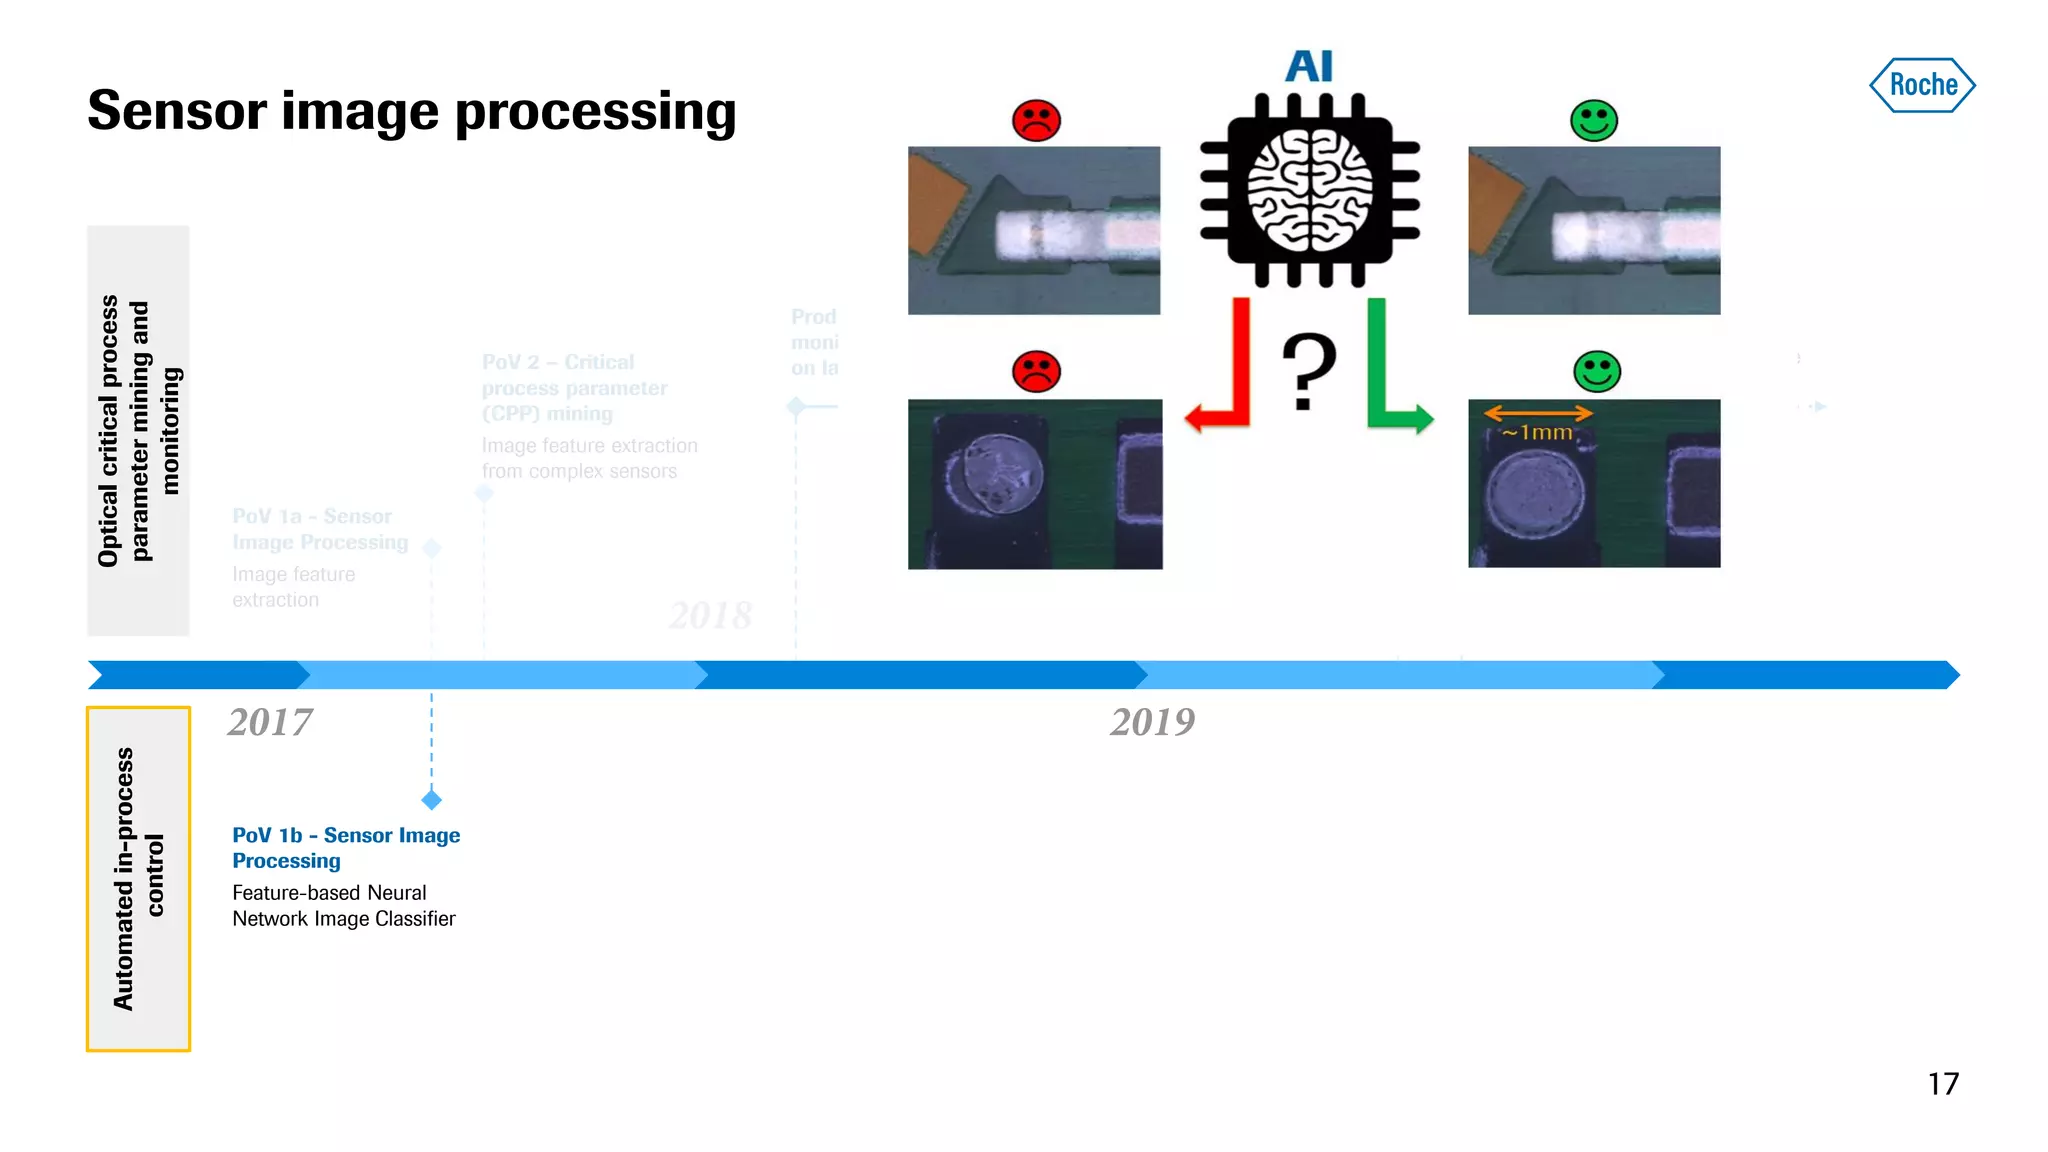
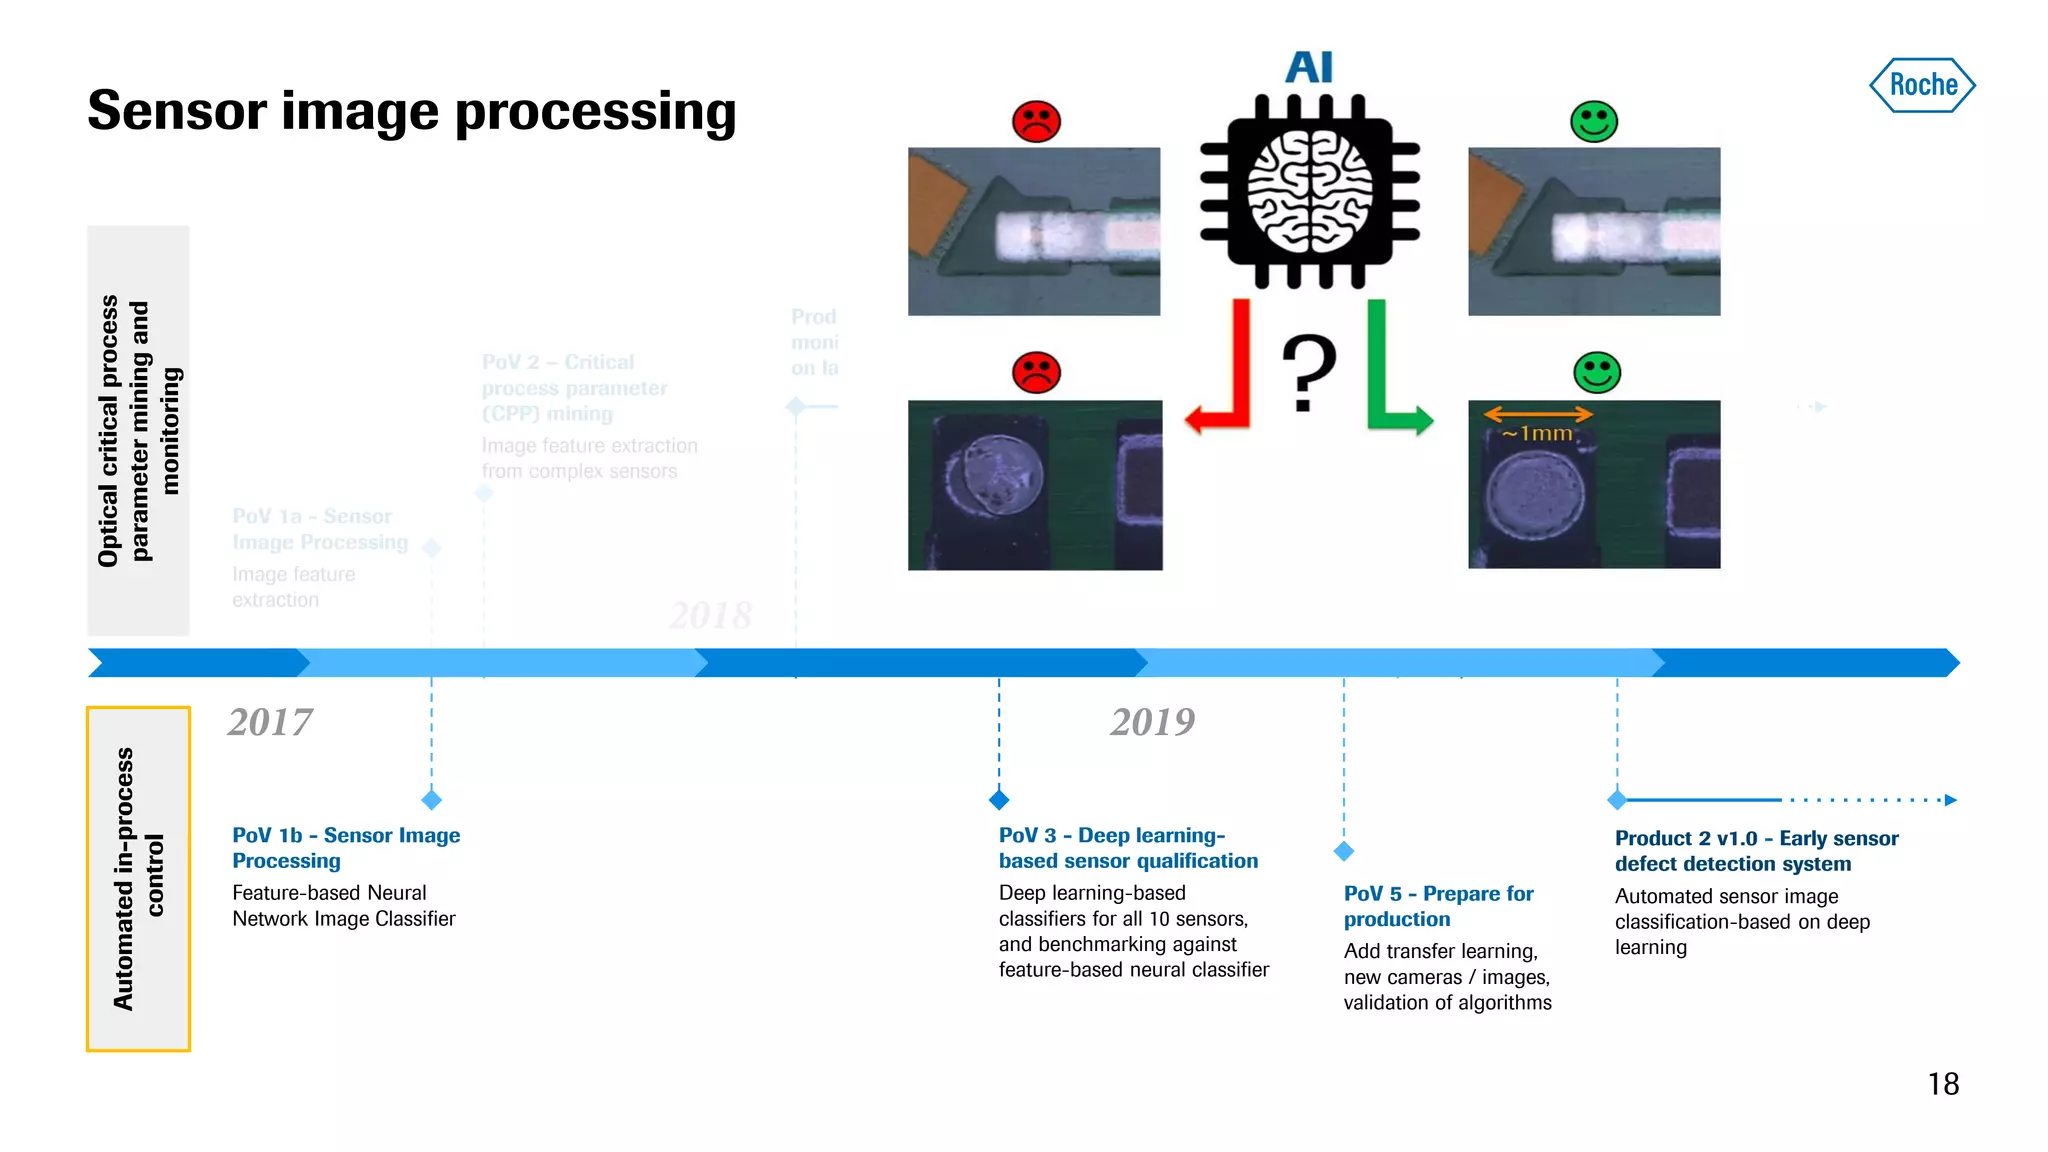
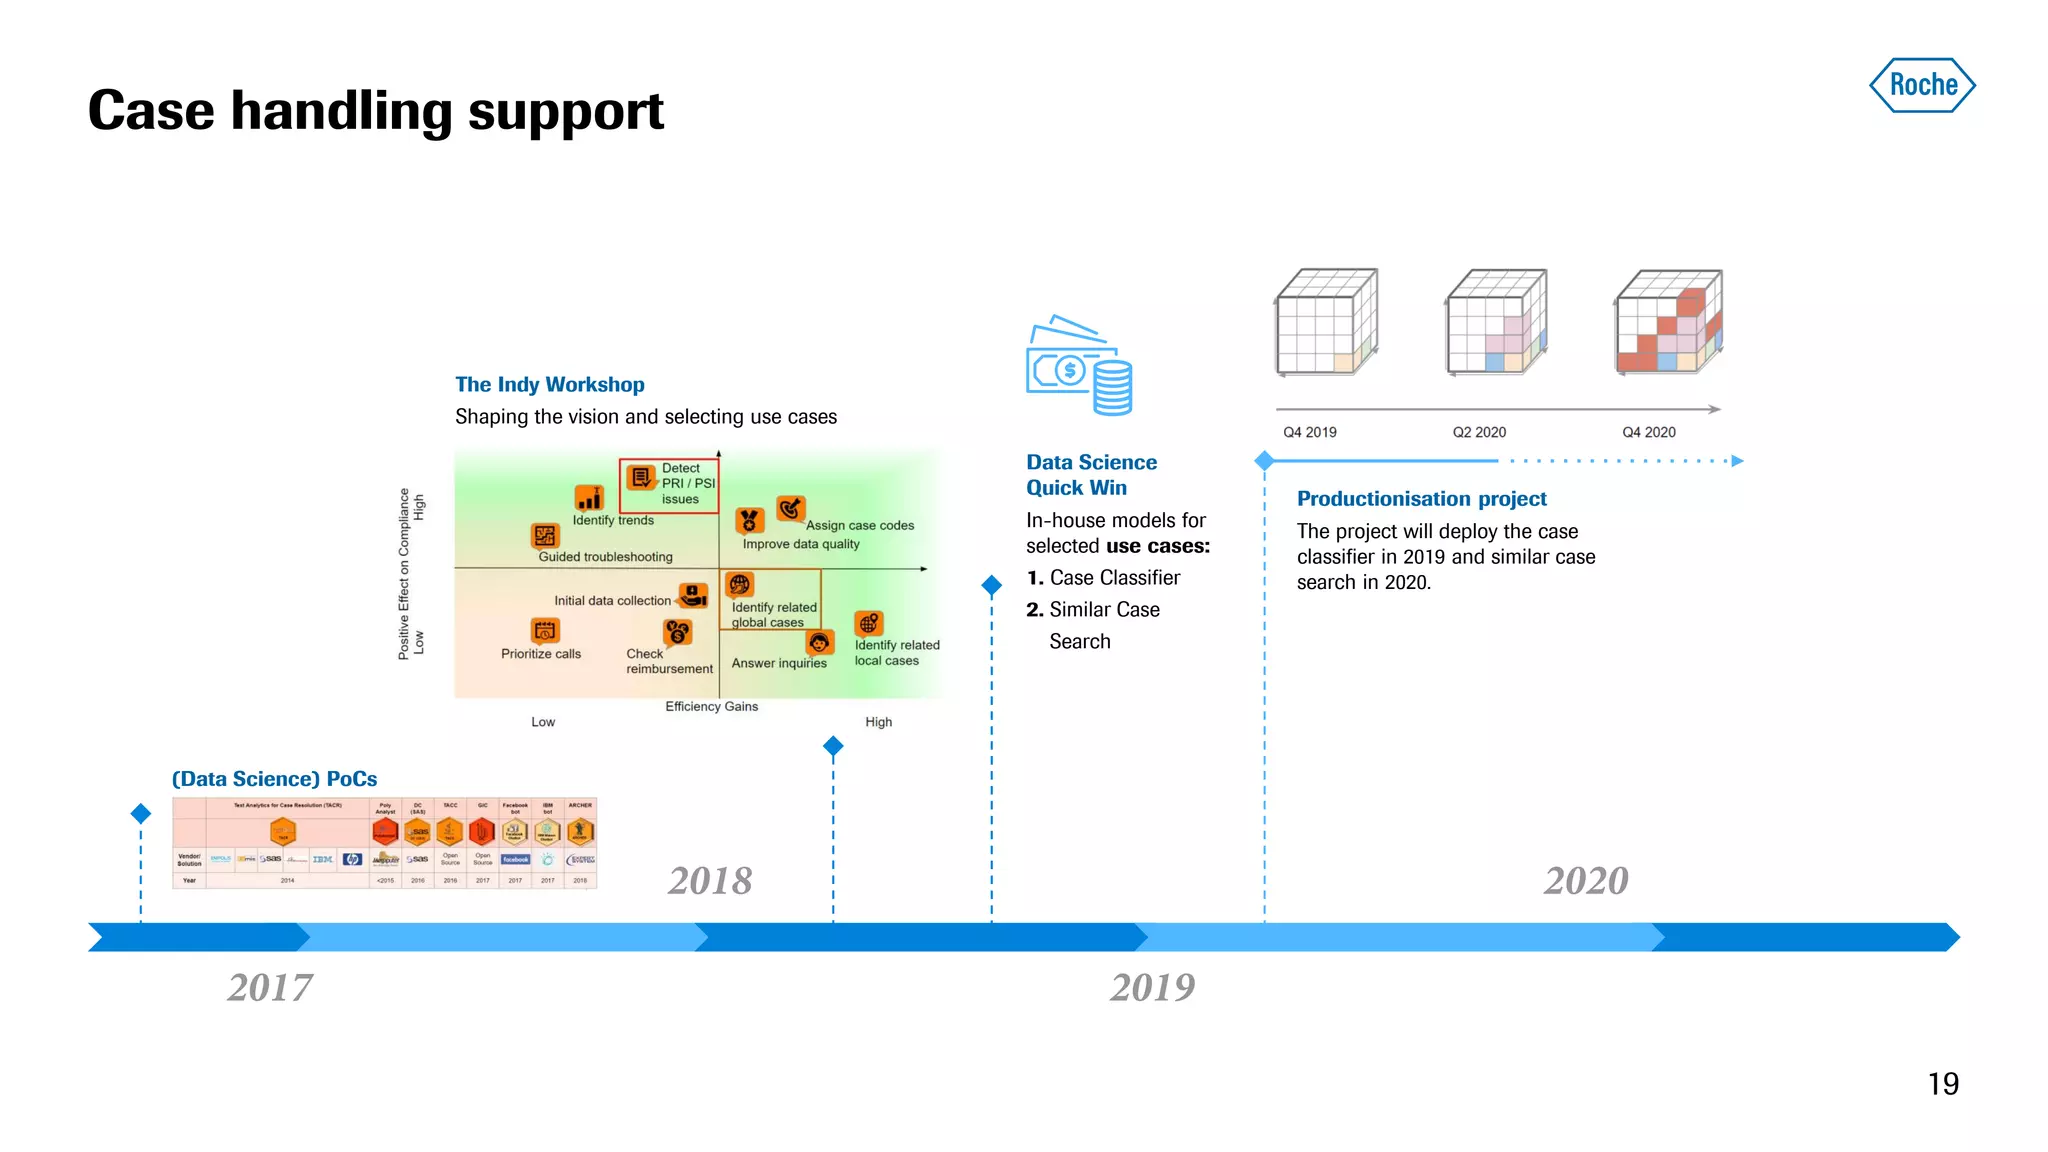
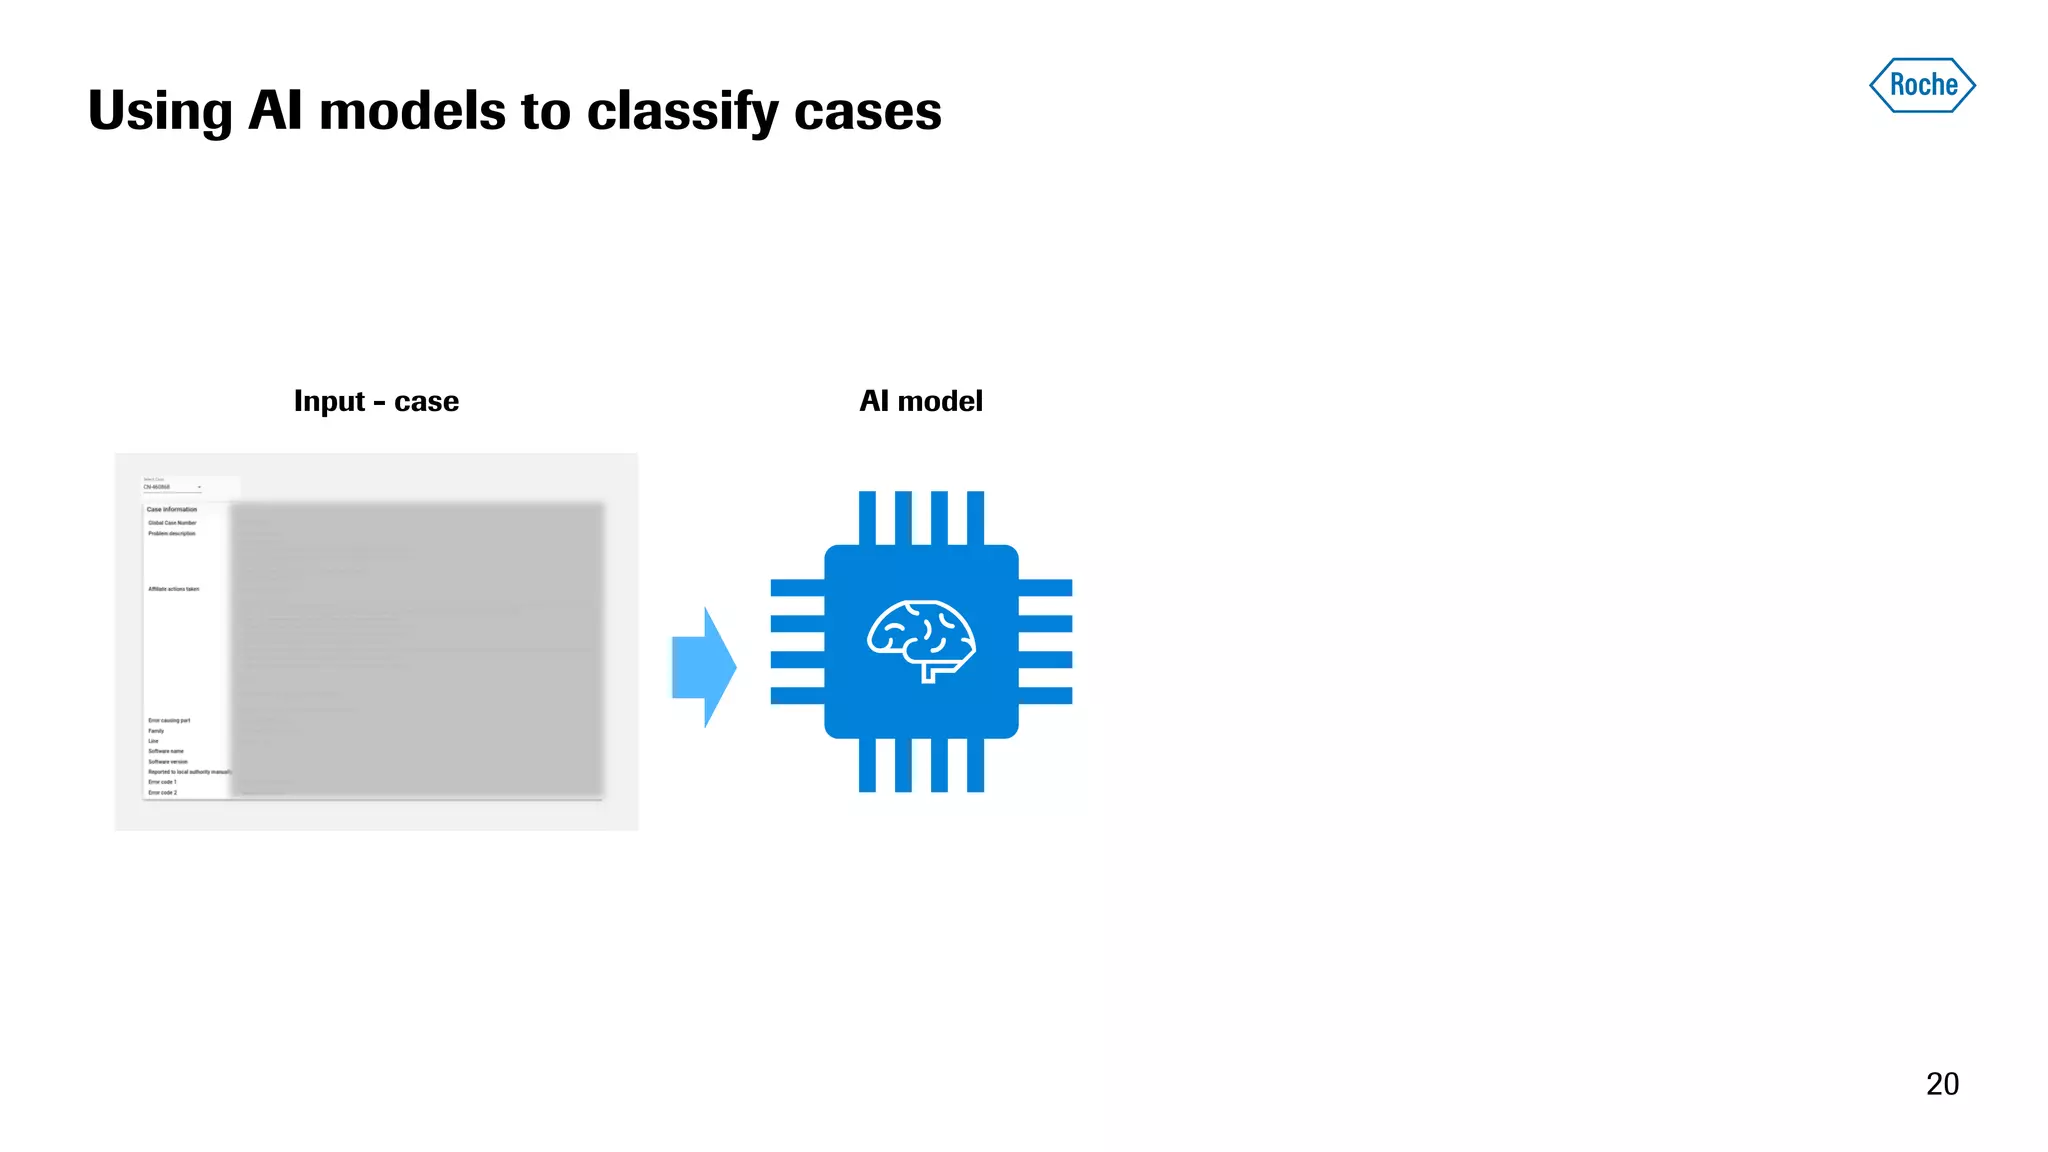
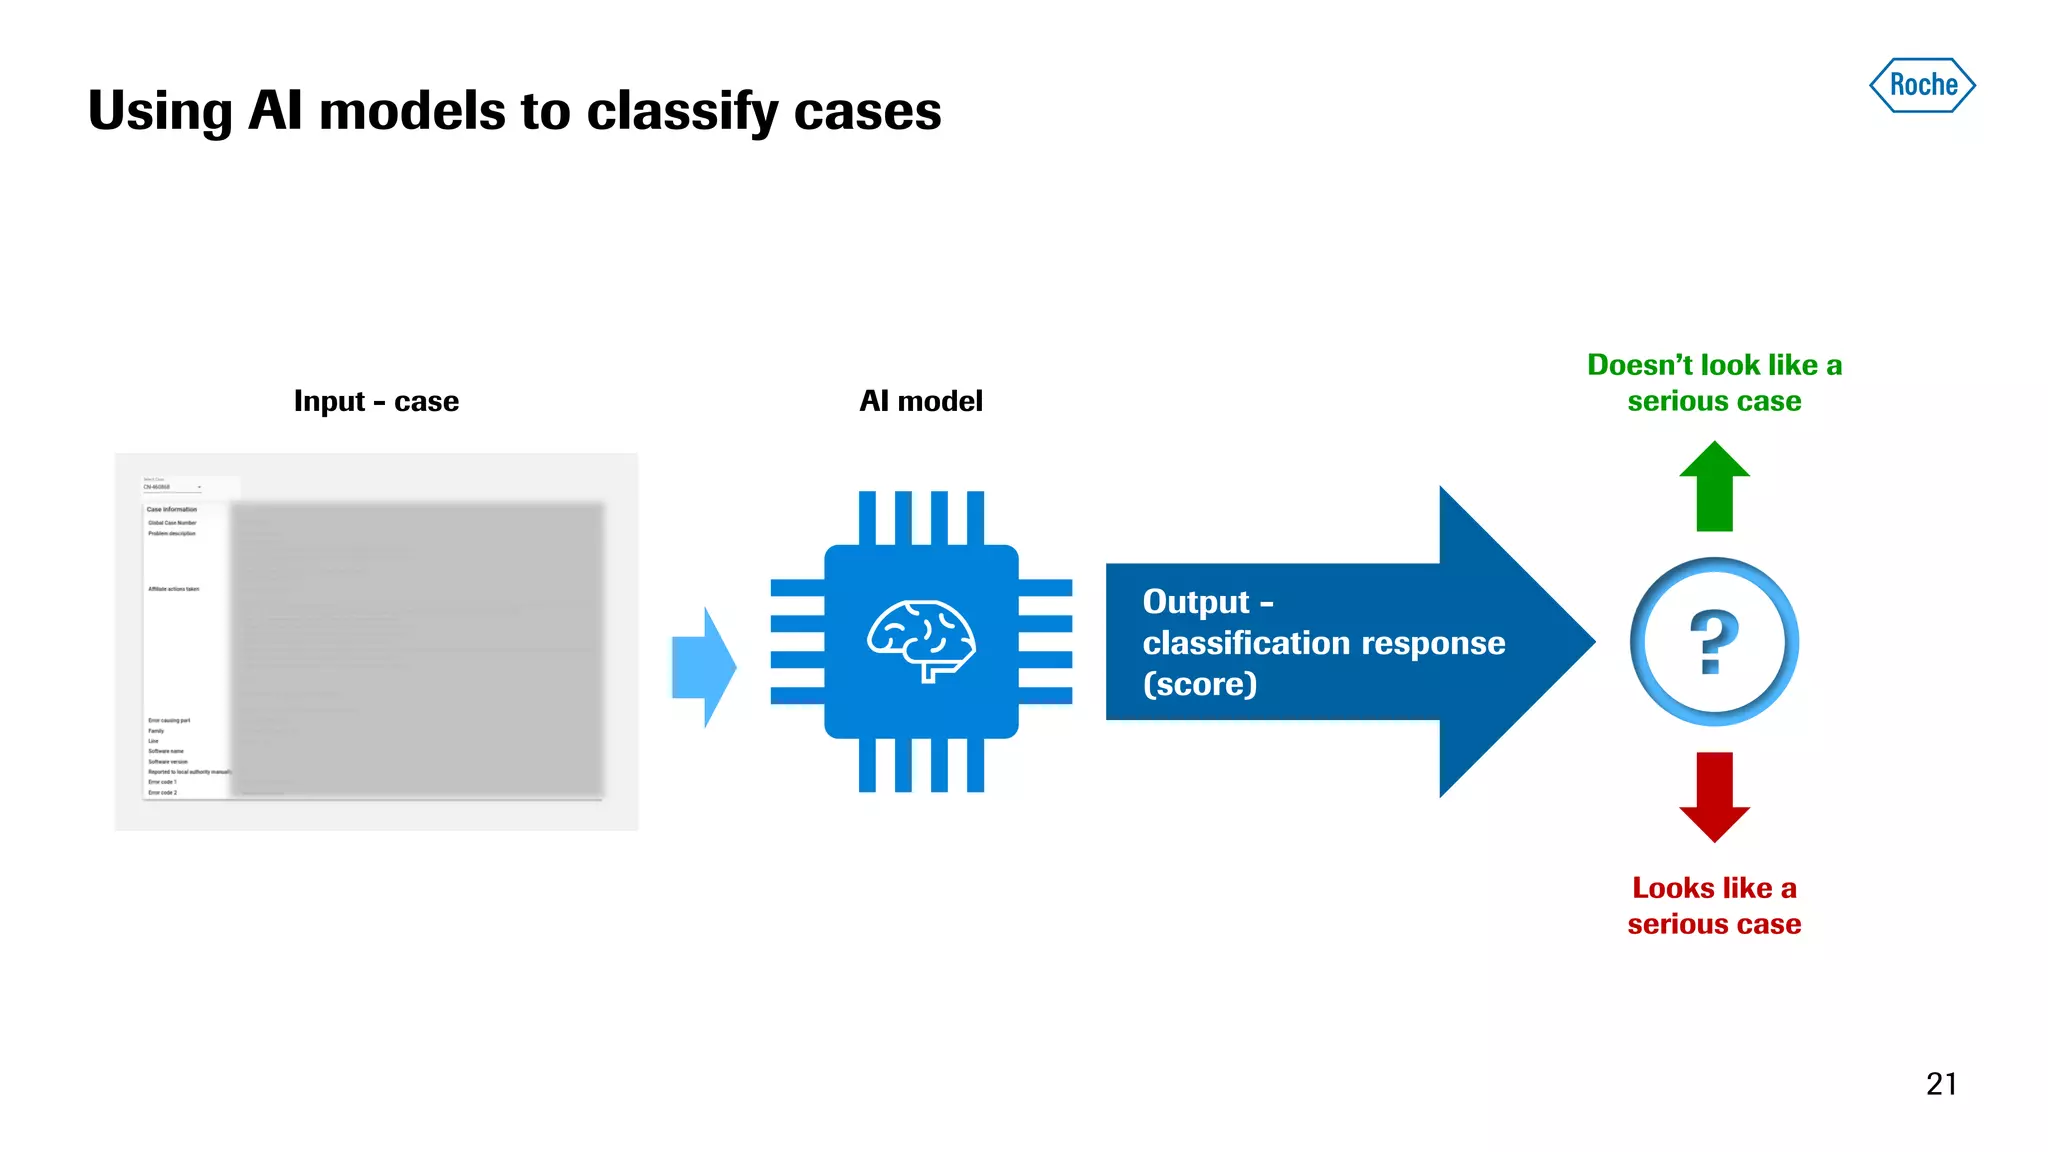
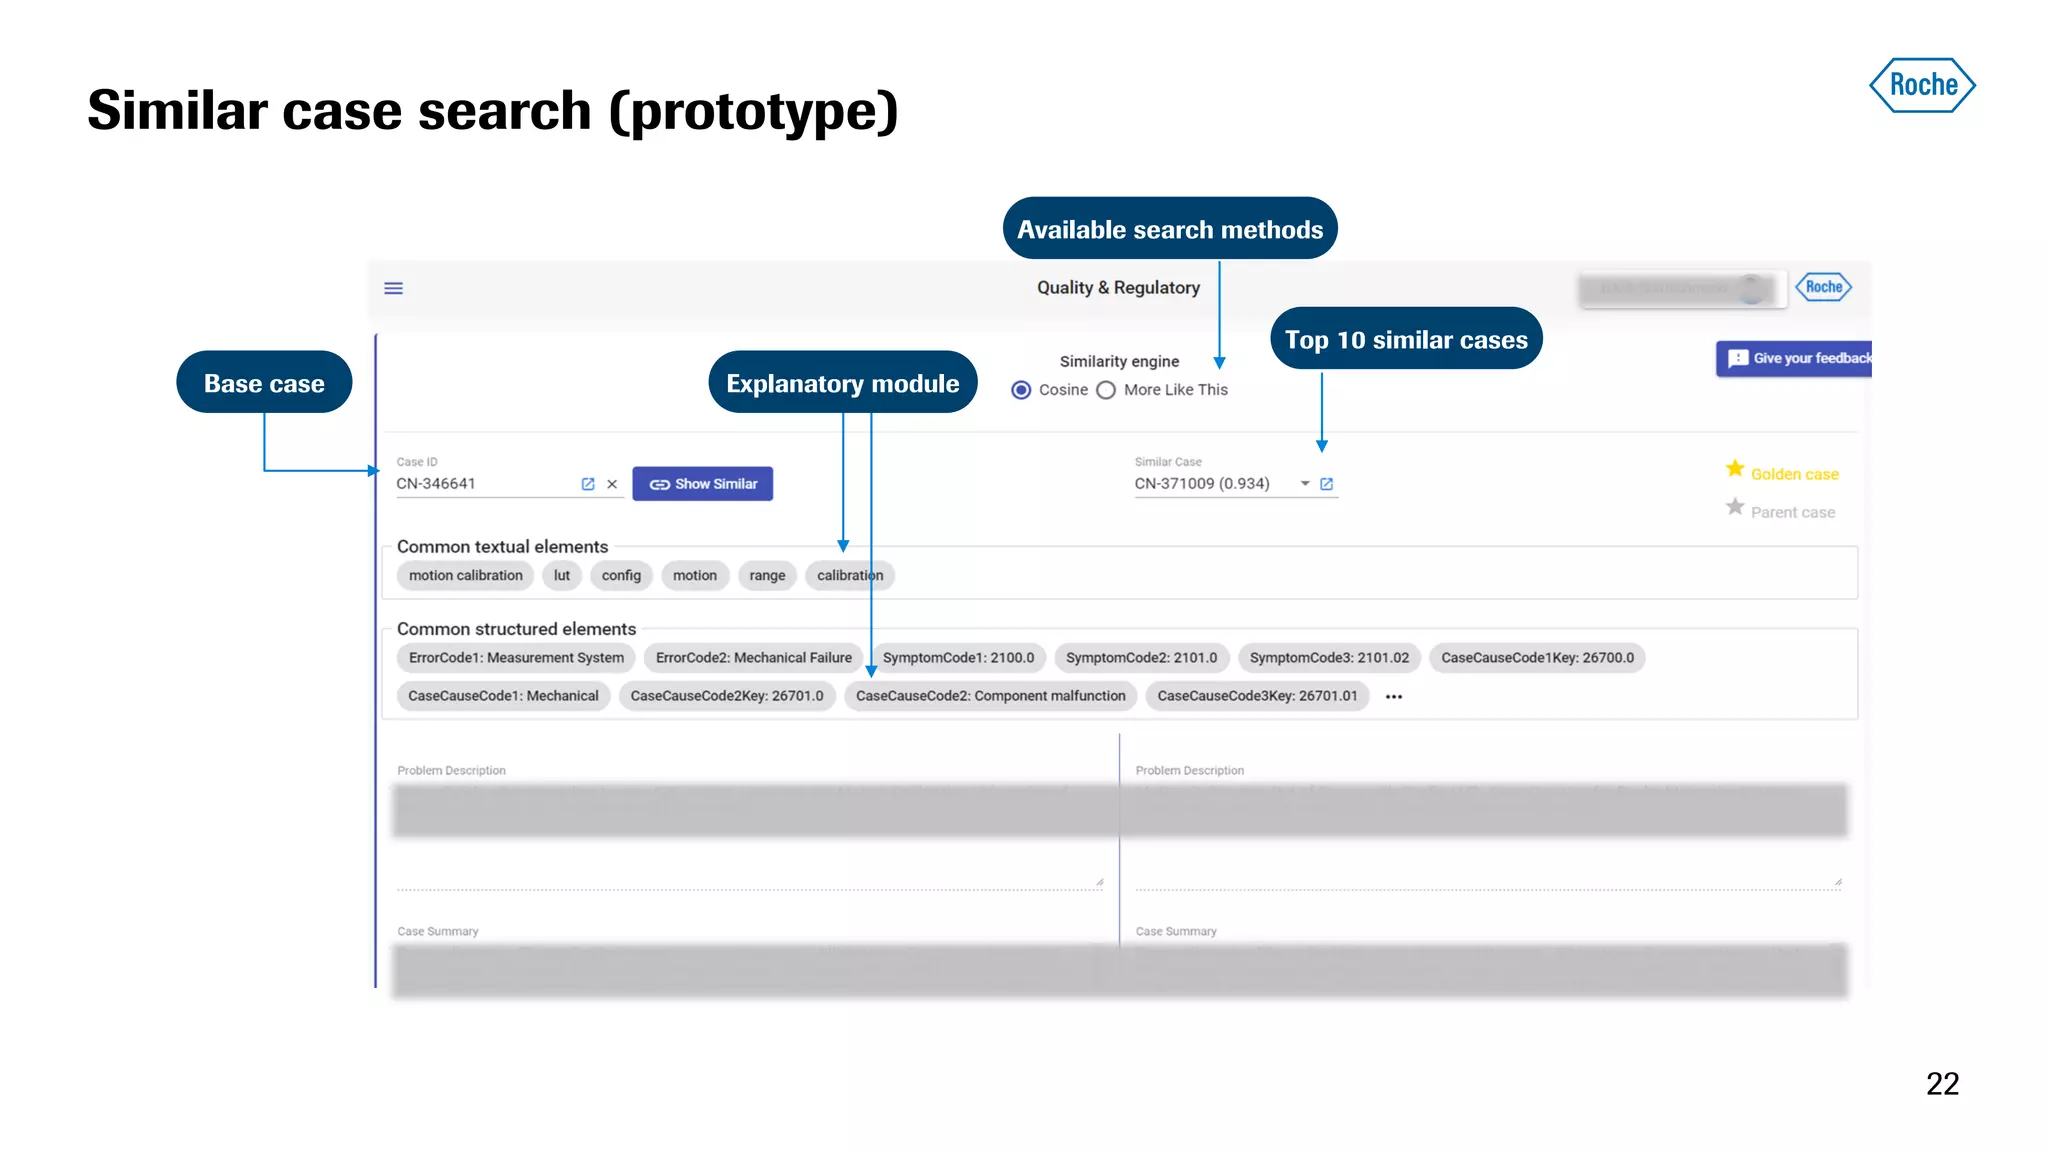
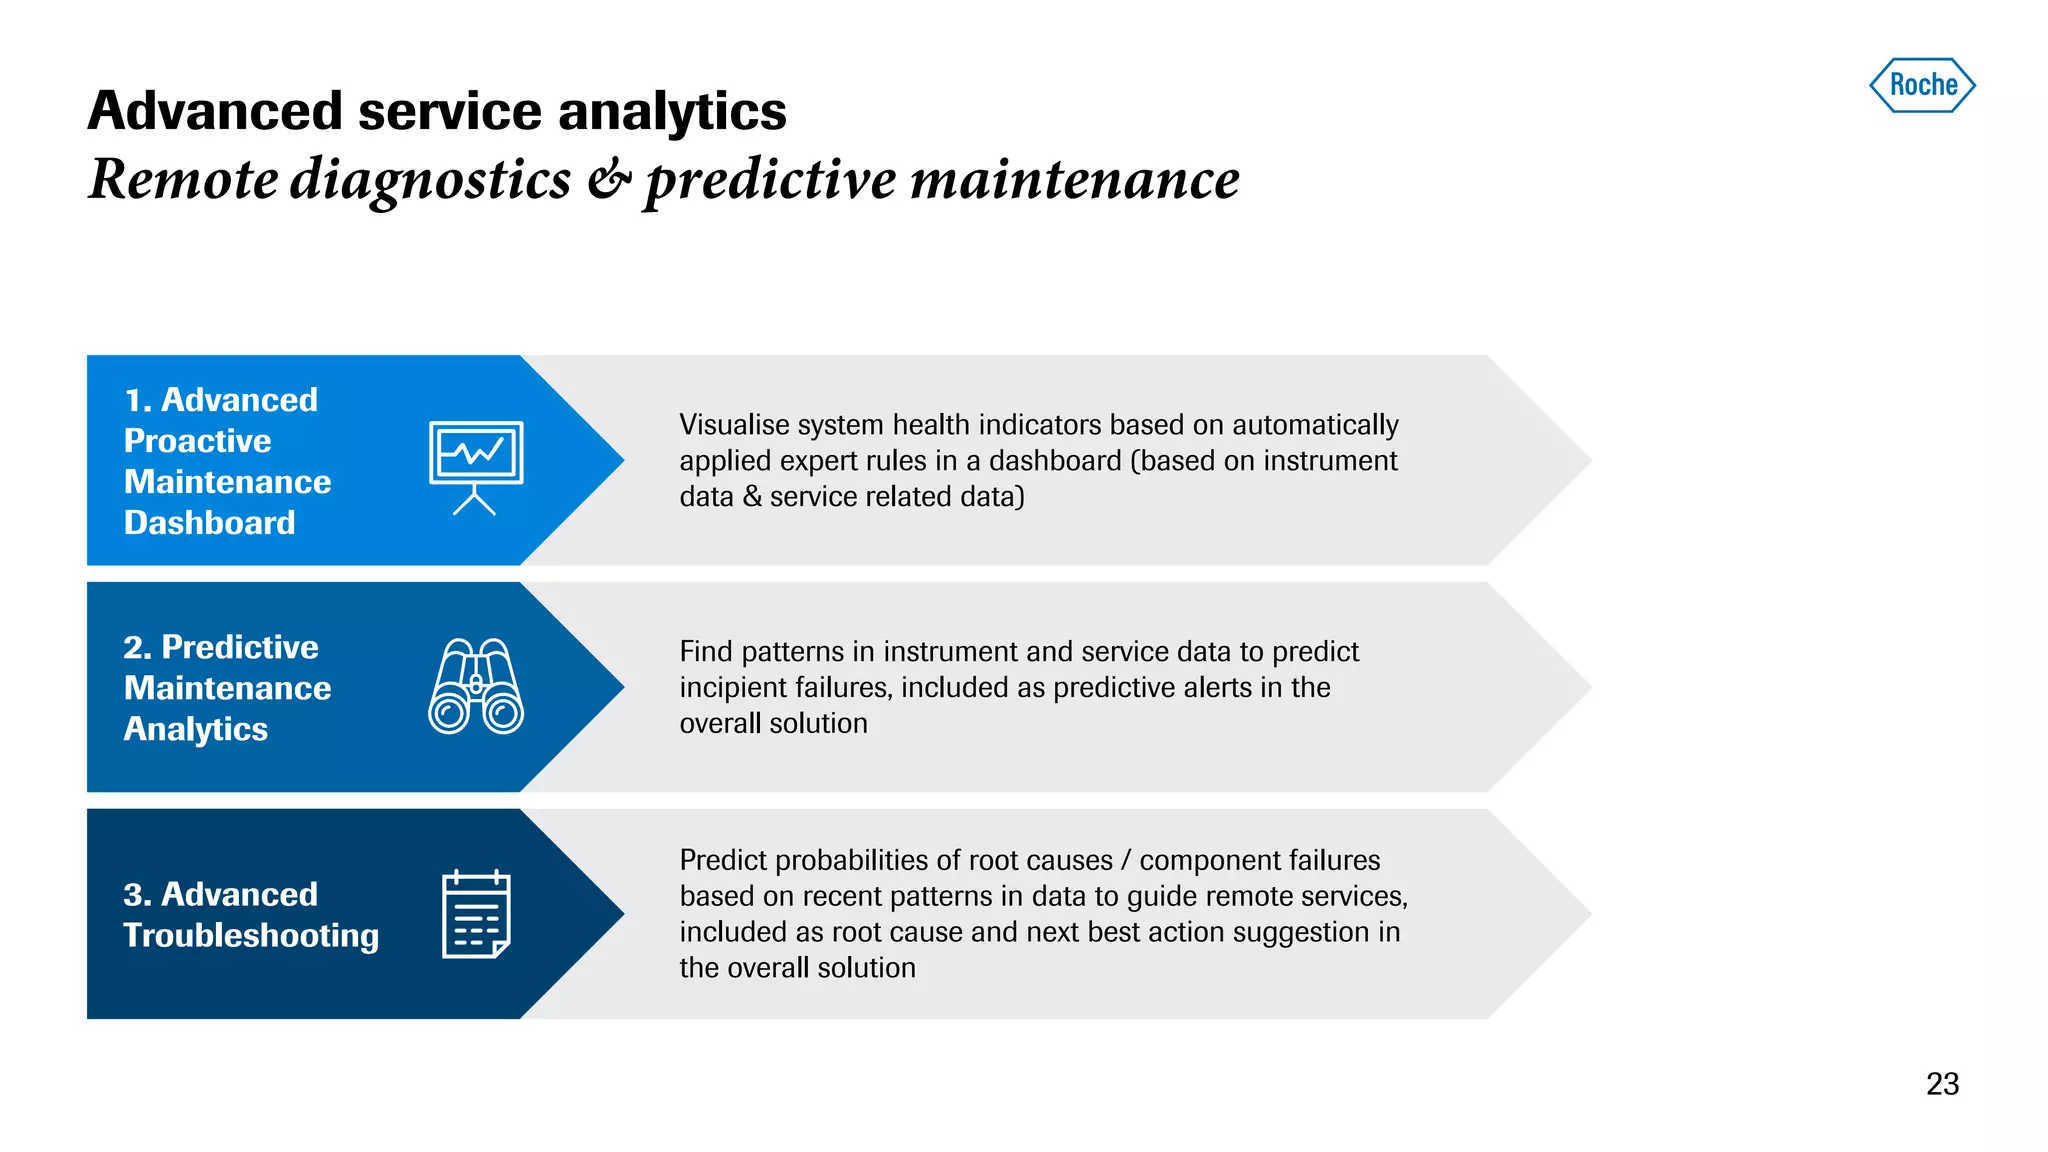
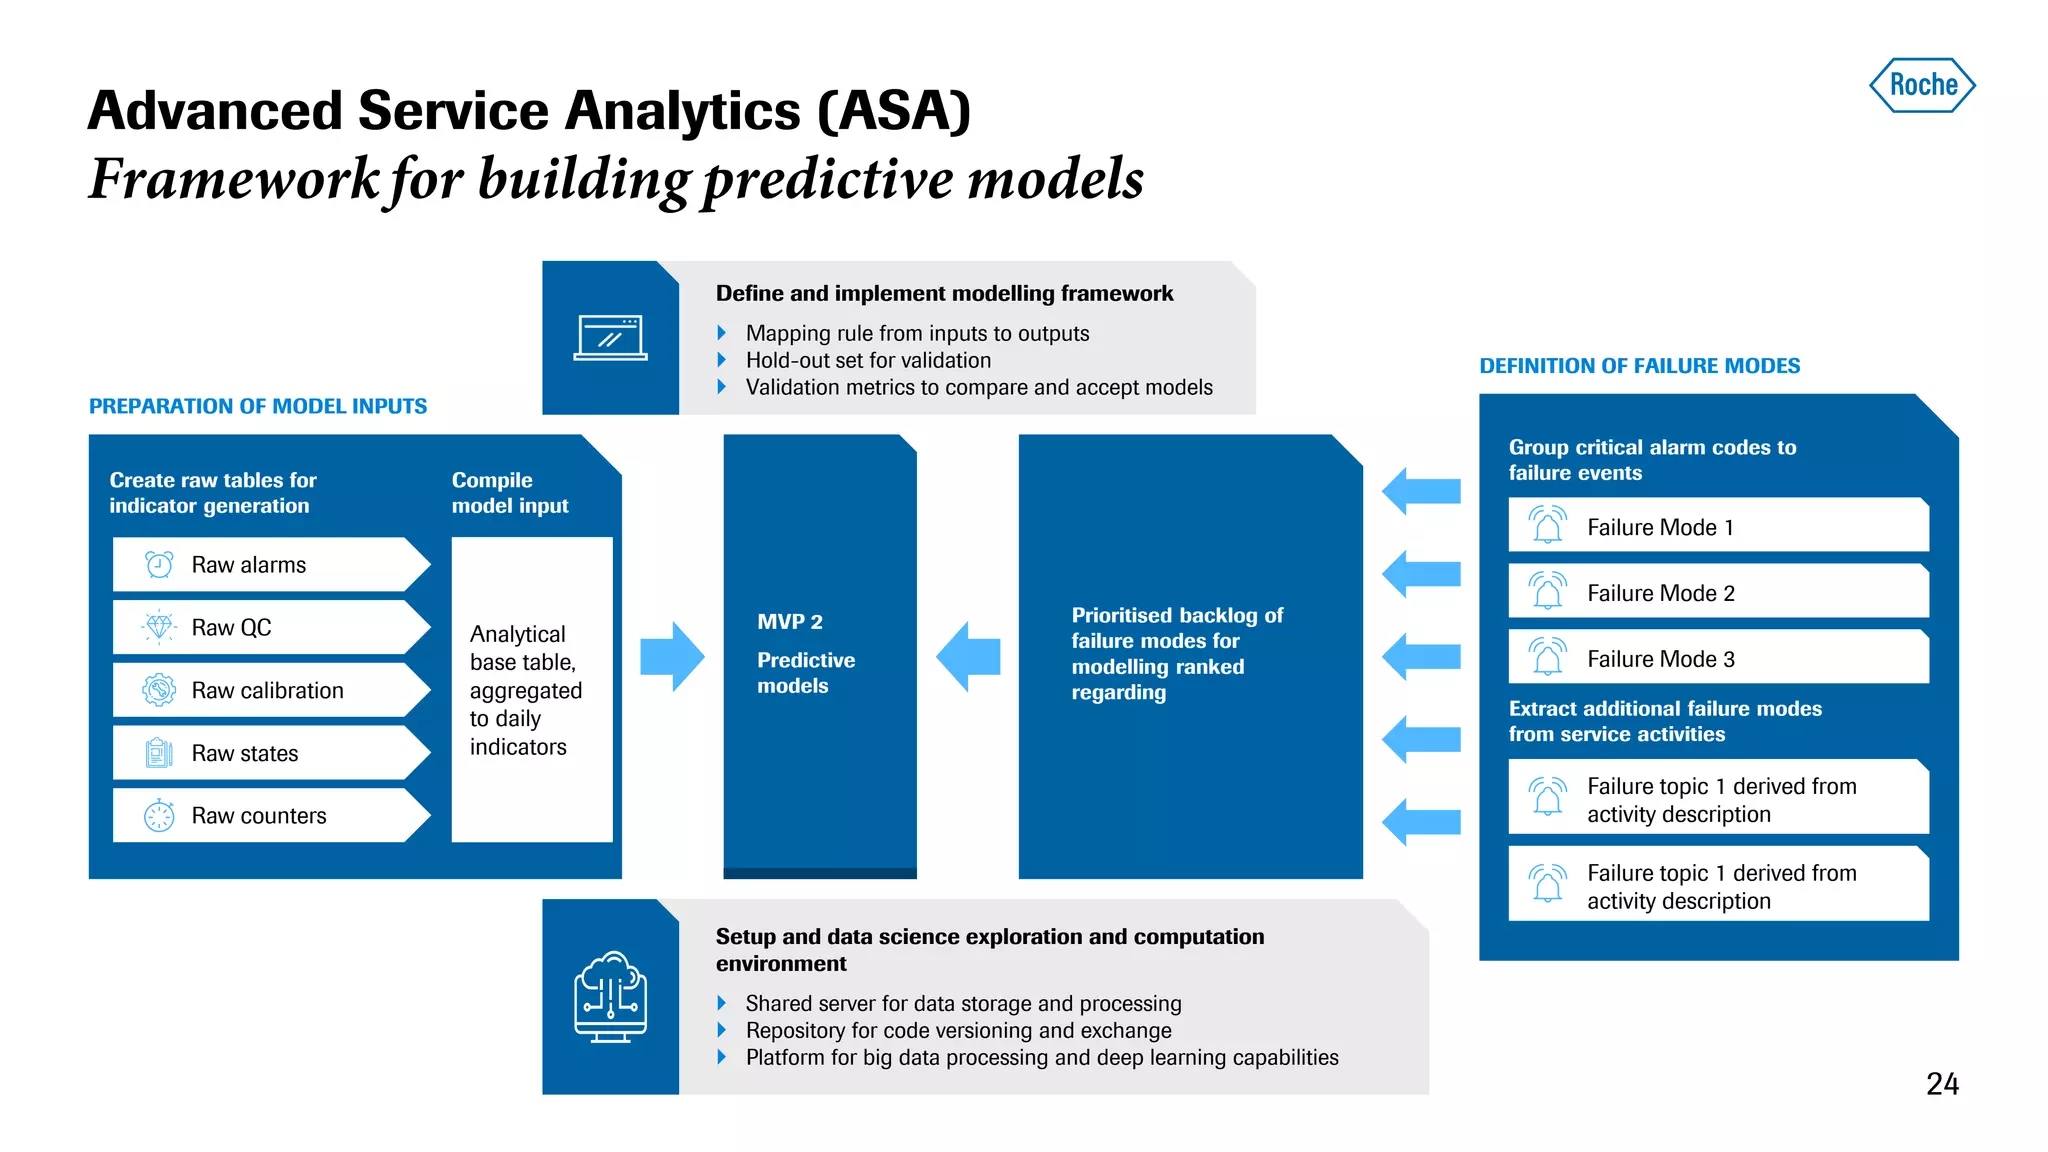
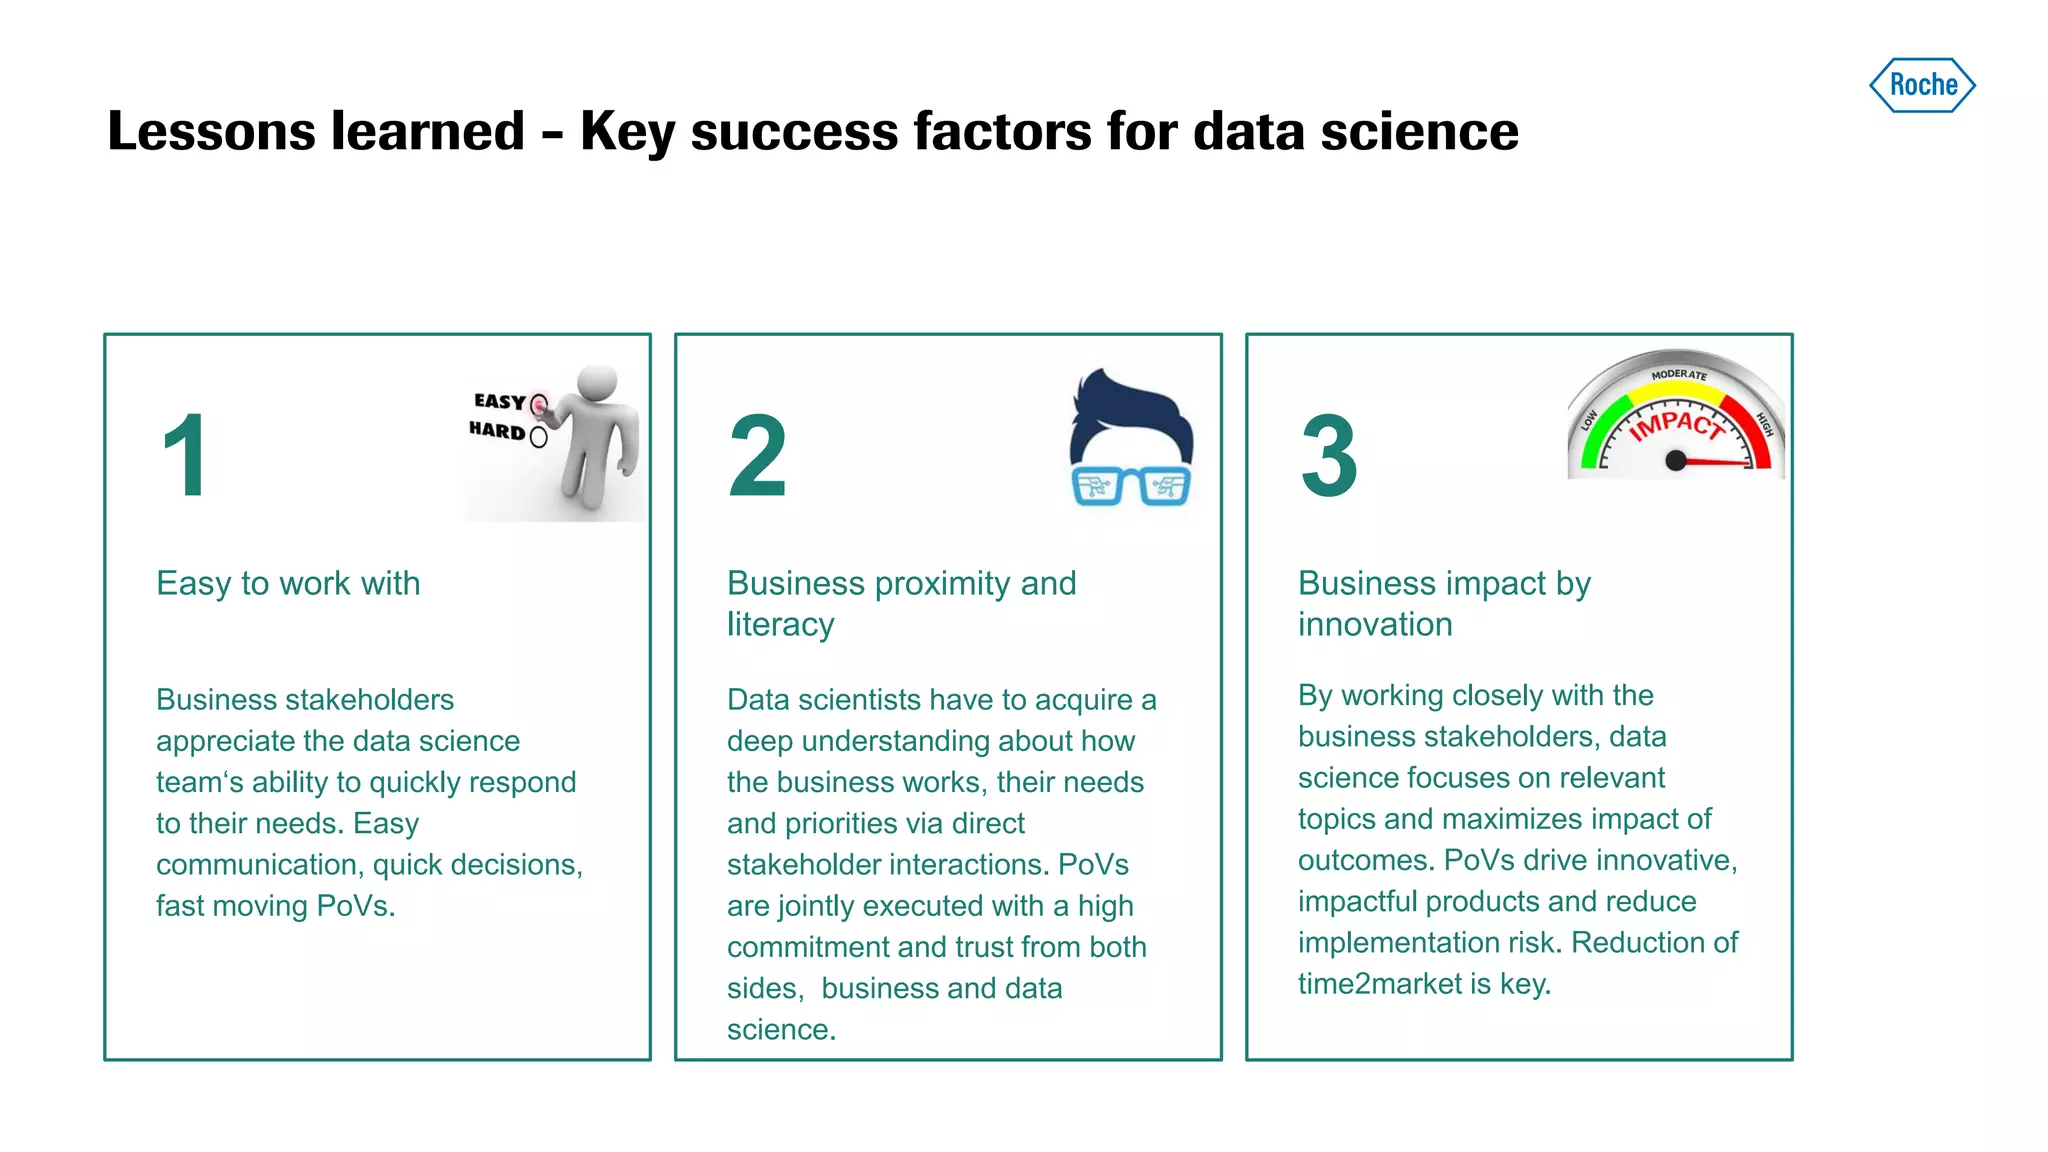
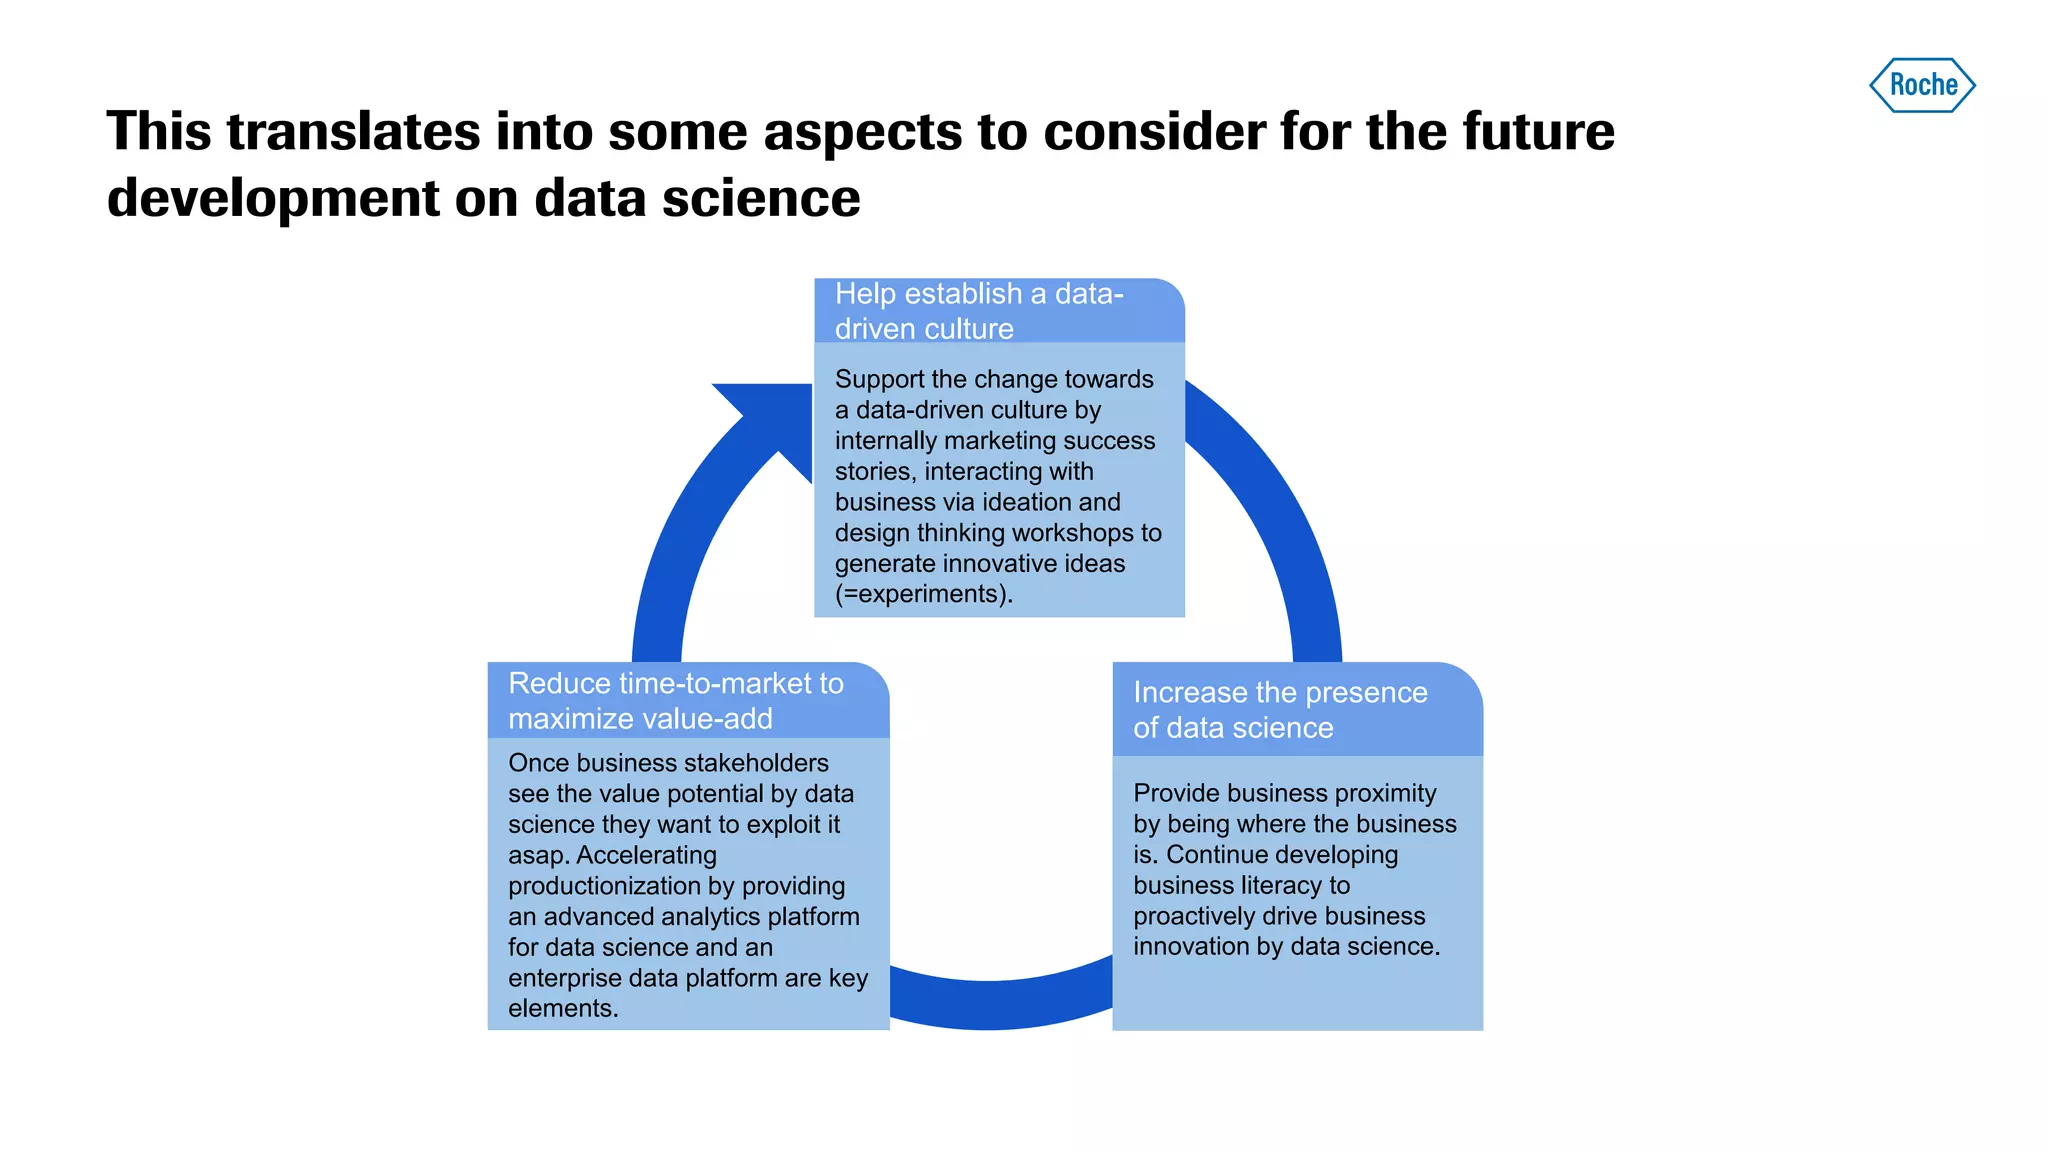
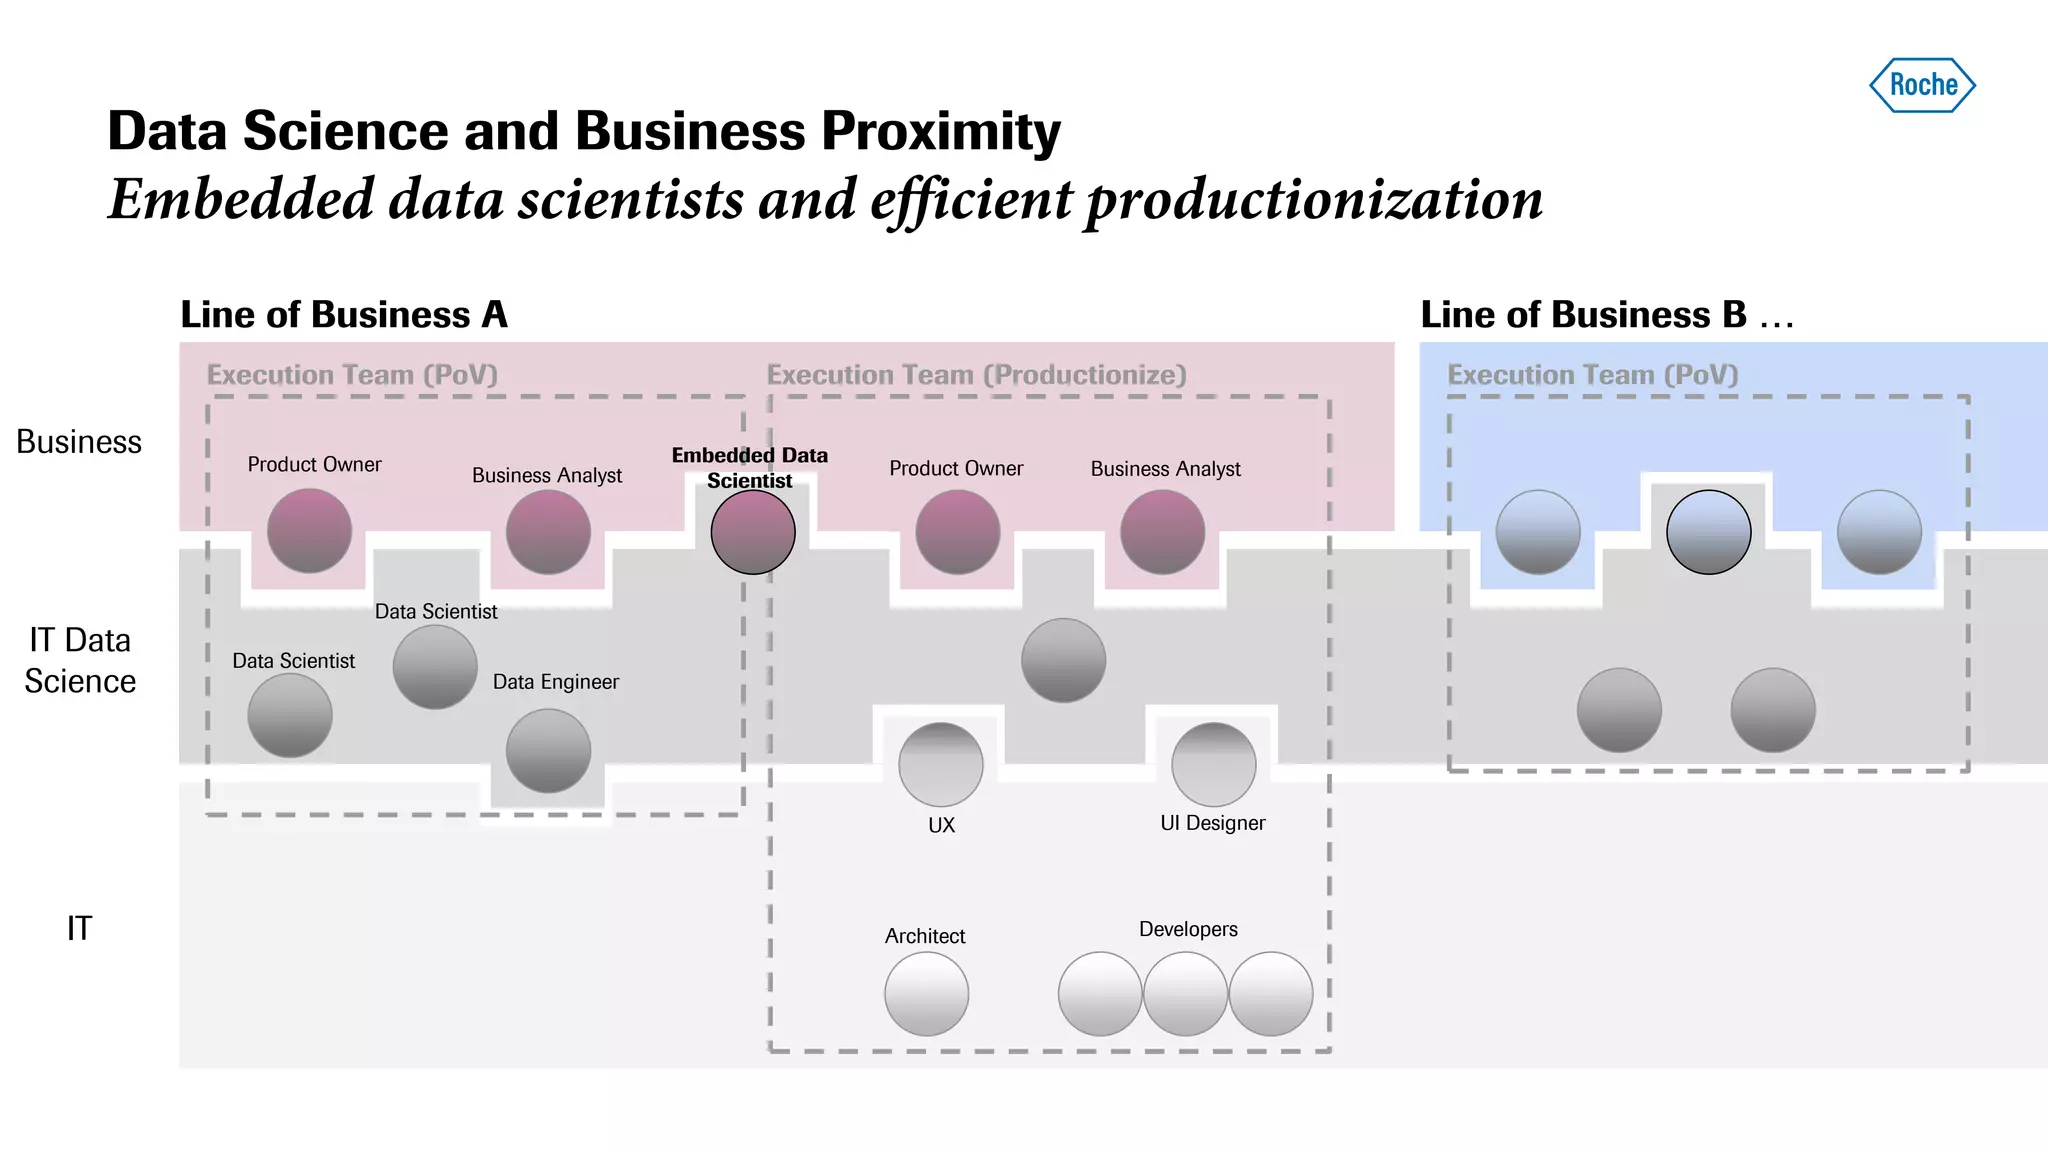
Data Science at Roche Diagnostics - From Exploration to
Productionisation
Predictive Analytics World for Business, 18-19 Nov 2019, Berlin
Dr. Frank Block, Head Roche Diagnostics IT Data Science
Introduction
From data to insights
From insights to production
2
Learnings
Disclaimer: The views expressed in this presentation are the personal views of the presenter and not those of Roche.
3
The Diagnostics Data Science Team Works End-to-End
Data science lifecycle from idea to production
Data-driven innovation process
Several selection gates define the path towards production
Ideas Try Develop Deploy & Maintain
4* PoV: proof-of-value
Follow-up
PoV
Selectinnovativeproducts
Selectpromisingideas
Initial
PoV*
Selectideas
R&D Commercial Global functions
Overview of data science activities
Example PoVs and business value addressed
5
TopicsValue
 More efficient R&D process
 Use of AI to support R&D
 AI for Solution Selling
 Tender intelligence
 Model-based opportunity scoring
 Next best sales activity
 Cross- /Up-selling
 Process yield, root cause analysis,
critical process parameter mining
 Predictive maintenance
 Forecasting sales and demand
 Complaint handling with AI
 Cost reduction
 Better algorithms for better products
 Better customer experience
 Increase conversion rate
 Maximise customer lifetime value
 Reduce cost of sales
 Reduce standard manufacturing
costs
 Reduce service costs
 Minimise supply issues
 Increase “first call resolution” rate
and customer satisfaction
Introduction
From data to insights
From insights to production
6
Learnings
From data to insights — example: enhancing production
7
1
Problem
2
Root cause analysis
3
Improve production
process
We have an issue with the yield for the production of a
specific module. In March some parts of the process
moved to a new location.
→ Is this move the reason for the yield
issues?
Question
Transmitted
light detector
Stray
light
detector
Optical
fibres
Capillary with
beads
solution
Beads
The Module
8
f1(transmitted light)
Measurement ~
f2(stray light)
1
1
2
2
Capillary with
beads solution
Optical
fibres
Laser diodes
Laser diodes
connectors
Transmitted
light detector
Stray light
detector
9
Making data whisper ...
Let’s do some
more tests...
The decrease in
successful test results:
1. is not correlated with climate data
2. is not due to the change of location
3. concerns the calibration phase only
4. is correlated with resistance for the
diode 4: 850nm
...and experts generated ideas for new experiments...
10
Replaced with camera Camera image
0° rotation 45° rotation 90° rotation
...which generated further data and led to the identification of
the root cause...
11
capillary
An unexpected red dot!
...EUREKA!
12
Light passes
underneath the
capillary almost without
any absorption which
leads to a distorted
measurement!
Optical fibres
Photodiode
capillary
...the root cause could be identified
13
Root cause
Improvement
Benefit
In March, the supplier started printing a label on the
light guide. Since then, the assembler turned the
guide so that the label would always point upwards…
A new software has been put in place in order to
assist the operator while rotating the optical fibre in
the optimal setting.
Significant increase of yield.
Introduction
From data to insights
From insights to production
14
Learnings
Some examples of data science productionisation projects
15
R&D Commercial Global functions
Phase in / Phase out
optimise product
replacements
Digital customer
experience
Optical feature
monitoring for sensor
production
Deep learning-based
Classification of sensor
images
Machine learning and
text analytics to support
case investigation
Financial forecasting &
planning
Advanced service
analytics
Sensor image processing
16
Opticalcriticalprocess
parameterminingand
monitoring
Automatedin-process
control
2019
2020
2017
PoV 1a - Sensor
Image Processing
Image feature
extraction
2018
PoV 2 – Critical
process parameter
(CPP) mining
Image feature extraction
from complex sensors
PoV 1b - Sensor Image
Processing
Feature-based Neural
Network Image Classifier
Product 1 v1.0 - Optical CPP
monitoring system deployed
on large interactive screens
PoV 4 - Enhanced
feature detection
algorithms
Develop better algorithms,
further automation
Product 1 v2.0 - Optical CPP
monitoring system for sensors
Enhanced version on data warehouse
Sensor image processing
17
Opticalcriticalprocess
parameterminingand
monitoring
Automatedin-process
control
2019
2020
2017
PoV 1a - Sensor
Image Processing
Image feature
extraction
2018
PoV 2 – Critical
process parameter
(CPP) mining
Image feature extraction
from complex sensors
PoV 1b - Sensor Image
Processing
Feature-based Neural
Network Image Classifier
Product 1 v1.0 - Optical CPP
monitoring system deployed
on large interactive screens
PoV 4 - Enhanced
feature detection
algorithms
Develop better algorithms,
further automation
Product 1 v2.0 - Optical CPP
monitoring system for sensors
Enhanced version on data warehouse
Sensor image processing
18
Opticalcriticalprocess
parameterminingand
monitoring
Automatedin-process
control
2019
2020
2017
PoV 1a - Sensor
Image Processing
Image feature
extraction
2018
PoV 2 – Critical
process parameter
(CPP) mining
Image feature extraction
from complex sensors
PoV 1b - Sensor Image
Processing
Feature-based Neural
Network Image Classifier
Product 1 v1.0 - Optical CPP
monitoring system deployed
on large interactive screens
PoV 4 - Enhanced
feature detection
algorithms
Develop better algorithms,
further automation
Product 1 v2.0 - Optical CPP
monitoring system for sensors
Enhanced version on OPS data
warehouse
PoV 3 - Deep learning-
based sensor qualification
Deep learning-based
classifiers for all 10 sensors,
and benchmarking against
feature-based neural classifier
PoV 5 - Prepare for
production
Add transfer learning,
new cameras / images,
validation of algorithms
Product 2 v1.0 - Early sensor
defect detection system
Automated sensor image
classification-based on deep
learning
Case handling support
19
(Data Science) PoCs
2019
2020
2017
2018
The Indy Workshop
Shaping the vision and selecting use cases
Data Science
Quick Win
In-house models for
selected use cases:
1. Case Classifier
2. Similar Case
Search
Productionisation project
The project will deploy the case
classifier in 2019 and similar case
search in 2020.
Using AI models to classify cases
20
AI modelInput - case
Using AI models to classify cases
21
Doesn’t look like a
serious case
Looks like a
serious case
AI modelInput - case
Output -
classification response
(score)
Similar case search (prototype)
22
Base case Explanatory module
Available search methods
Top 10 similar cases
Visualise system health indicators based on automatically
applied expert rules in a dashboard (based on instrument
data & service related data)
Advanced service analytics
Remote diagnostics & predictive maintenance
23
1. Advanced
Proactive
Maintenance
Dashboard
2. Predictive
Maintenance
Analytics
3. Advanced
Troubleshooting
Find patterns in instrument and service data to predict
incipient failures, included as predictive alerts in the
overall solution
Predict probabilities of root causes / component failures
based on recent patterns in data to guide remote services,
included as root cause and next best action suggestion in
the overall solution
Advanced Service Analytics (ASA)
Framework for building predictive models
24
PREPARATION OF MODEL INPUTS
Create raw tables for
indicator generation
Compile
model input
Raw alarms
Raw QC
Raw calibration
Raw states
Raw counters
Analytical
base table,
aggregated
to daily
indicators
MVP 2
Predictive
models
Prioritised backlog of
failure modes for
modelling ranked
regarding
DEFINITION OF FAILURE MODES
Group critical alarm codes to
failure events
Failure Mode 1
Failure Mode 2
Failure Mode 3
Extract additional failure modes
from service activities
Failure topic 1 derived from
activity description
Failure topic 1 derived from
activity description
Define and implement modelling framework
 Mapping rule from inputs to outputs
 Hold-out set for validation
 Validation metrics to compare and accept models
Setup and data science exploration and computation
environment
 Shared server for data storage and processing
 Repository for code versioning and exchange
 Platform for big data processing and deep learning capabilities
Introduction
From data to insights
From insights to production
25
Learnings
Lessons learned - Key success factors for data science
Easy to work with
Business stakeholders
appreciate the data science
team‘s ability to quickly respond
to their needs. Easy
communication, quick decisions,
fast moving PoVs.
1
Business proximity and
literacy
Data scientists have to acquire a
deep understanding about how
the business works, their needs
and priorities via direct
stakeholder interactions. PoVs
are jointly executed with a high
commitment and trust from both
sides, business and data
science.
2
Business impact by
innovation
By working closely with the
business stakeholders, data
science focuses on relevant
topics and maximizes impact of
outcomes. PoVs drive innovative,
impactful products and reduce
implementation risk. Reduction of
time2market is key.
3
This translates into some aspects to consider for the future
development on data science
Provide business proximity
by being where the business
is. Continue developing
business literacy to
proactively drive business
innovation by data science.
Increase the presence
of data science
Support the change towards
a data-driven culture by
internally marketing success
stories, interacting with
business via ideation and
design thinking workshops to
generate innovative ideas
(=experiments).
Help establish a data-
driven culture
Once business stakeholders
see the value potential by data
science they want to exploit it
asap. Accelerating
productionization by providing
an advanced analytics platform
for data science and an
enterprise data platform are key
elements.
Reduce time-to-market to
maximize value-add
Data Science and Business Proximity
Embedded data scientists and efficient productionization
Product Owner
Business Analyst
Data Engineer
Product Owner Business Analyst
Execution Team (PoV)
Business
IT Data
Science
IT
Execution Team (Productionize) Execution Team (PoV)
UX UI Designer
Architect
Data Scientist
Data Scientist
Developers
Line of Business A Line of Business B …
Embedded Data
Scientist
Summary
Final thoughts
 Run many data science experiments to explore your ideas.
 Data quality can easily be your limiting factor…
 Quickly understand which ideas have innovation potential.
 Develop prototypes, MVPs to further understand the obstacles to
production.
 As you move from experiment to production your team compositions
changes from data scientists to data/software engineers/UI designers.
 Involve the right skills at the right time to minimize time-to-market.
29
Doing now what patients need next

Data Science at Roche: From Exploration to Productionization - Frank Block

  • 1.
    Data Science atRoche Diagnostics - From Exploration to Productionisation Predictive Analytics World for Business, 18-19 Nov 2019, Berlin Dr. Frank Block, Head Roche Diagnostics IT Data Science
  • 2.
    Introduction From data toinsights From insights to production 2 Learnings Disclaimer: The views expressed in this presentation are the personal views of the presenter and not those of Roche.
  • 3.
    3 The Diagnostics DataScience Team Works End-to-End Data science lifecycle from idea to production
  • 4.
    Data-driven innovation process Severalselection gates define the path towards production Ideas Try Develop Deploy & Maintain 4* PoV: proof-of-value Follow-up PoV Selectinnovativeproducts Selectpromisingideas Initial PoV* Selectideas
  • 5.
    R&D Commercial Globalfunctions Overview of data science activities Example PoVs and business value addressed 5 TopicsValue  More efficient R&D process  Use of AI to support R&D  AI for Solution Selling  Tender intelligence  Model-based opportunity scoring  Next best sales activity  Cross- /Up-selling  Process yield, root cause analysis, critical process parameter mining  Predictive maintenance  Forecasting sales and demand  Complaint handling with AI  Cost reduction  Better algorithms for better products  Better customer experience  Increase conversion rate  Maximise customer lifetime value  Reduce cost of sales  Reduce standard manufacturing costs  Reduce service costs  Minimise supply issues  Increase “first call resolution” rate and customer satisfaction
  • 6.
    Introduction From data toinsights From insights to production 6 Learnings
  • 7.
    From data toinsights — example: enhancing production 7 1 Problem 2 Root cause analysis 3 Improve production process We have an issue with the yield for the production of a specific module. In March some parts of the process moved to a new location. → Is this move the reason for the yield issues? Question
  • 8.
    Transmitted light detector Stray light detector Optical fibres Capillary with beads solution Beads TheModule 8 f1(transmitted light) Measurement ~ f2(stray light) 1 1 2 2 Capillary with beads solution Optical fibres Laser diodes Laser diodes connectors Transmitted light detector Stray light detector
  • 9.
    9 Making data whisper... Let’s do some more tests... The decrease in successful test results: 1. is not correlated with climate data 2. is not due to the change of location 3. concerns the calibration phase only 4. is correlated with resistance for the diode 4: 850nm
  • 10.
    ...and experts generatedideas for new experiments... 10 Replaced with camera Camera image
  • 11.
    0° rotation 45°rotation 90° rotation ...which generated further data and led to the identification of the root cause... 11 capillary An unexpected red dot!
  • 12.
    ...EUREKA! 12 Light passes underneath the capillaryalmost without any absorption which leads to a distorted measurement! Optical fibres Photodiode capillary
  • 13.
    ...the root causecould be identified 13 Root cause Improvement Benefit In March, the supplier started printing a label on the light guide. Since then, the assembler turned the guide so that the label would always point upwards… A new software has been put in place in order to assist the operator while rotating the optical fibre in the optimal setting. Significant increase of yield.
  • 14.
    Introduction From data toinsights From insights to production 14 Learnings
  • 15.
    Some examples ofdata science productionisation projects 15 R&D Commercial Global functions Phase in / Phase out optimise product replacements Digital customer experience Optical feature monitoring for sensor production Deep learning-based Classification of sensor images Machine learning and text analytics to support case investigation Financial forecasting & planning Advanced service analytics
  • 16.
    Sensor image processing 16 Opticalcriticalprocess parameterminingand monitoring Automatedin-process control 2019 2020 2017 PoV1a - Sensor Image Processing Image feature extraction 2018 PoV 2 – Critical process parameter (CPP) mining Image feature extraction from complex sensors PoV 1b - Sensor Image Processing Feature-based Neural Network Image Classifier Product 1 v1.0 - Optical CPP monitoring system deployed on large interactive screens PoV 4 - Enhanced feature detection algorithms Develop better algorithms, further automation Product 1 v2.0 - Optical CPP monitoring system for sensors Enhanced version on data warehouse
  • 17.
    Sensor image processing 17 Opticalcriticalprocess parameterminingand monitoring Automatedin-process control 2019 2020 2017 PoV1a - Sensor Image Processing Image feature extraction 2018 PoV 2 – Critical process parameter (CPP) mining Image feature extraction from complex sensors PoV 1b - Sensor Image Processing Feature-based Neural Network Image Classifier Product 1 v1.0 - Optical CPP monitoring system deployed on large interactive screens PoV 4 - Enhanced feature detection algorithms Develop better algorithms, further automation Product 1 v2.0 - Optical CPP monitoring system for sensors Enhanced version on data warehouse
  • 18.
    Sensor image processing 18 Opticalcriticalprocess parameterminingand monitoring Automatedin-process control 2019 2020 2017 PoV1a - Sensor Image Processing Image feature extraction 2018 PoV 2 – Critical process parameter (CPP) mining Image feature extraction from complex sensors PoV 1b - Sensor Image Processing Feature-based Neural Network Image Classifier Product 1 v1.0 - Optical CPP monitoring system deployed on large interactive screens PoV 4 - Enhanced feature detection algorithms Develop better algorithms, further automation Product 1 v2.0 - Optical CPP monitoring system for sensors Enhanced version on OPS data warehouse PoV 3 - Deep learning- based sensor qualification Deep learning-based classifiers for all 10 sensors, and benchmarking against feature-based neural classifier PoV 5 - Prepare for production Add transfer learning, new cameras / images, validation of algorithms Product 2 v1.0 - Early sensor defect detection system Automated sensor image classification-based on deep learning
  • 19.
    Case handling support 19 (DataScience) PoCs 2019 2020 2017 2018 The Indy Workshop Shaping the vision and selecting use cases Data Science Quick Win In-house models for selected use cases: 1. Case Classifier 2. Similar Case Search Productionisation project The project will deploy the case classifier in 2019 and similar case search in 2020.
  • 20.
    Using AI modelsto classify cases 20 AI modelInput - case
  • 21.
    Using AI modelsto classify cases 21 Doesn’t look like a serious case Looks like a serious case AI modelInput - case Output - classification response (score)
  • 22.
    Similar case search(prototype) 22 Base case Explanatory module Available search methods Top 10 similar cases
  • 23.
    Visualise system healthindicators based on automatically applied expert rules in a dashboard (based on instrument data & service related data) Advanced service analytics Remote diagnostics & predictive maintenance 23 1. Advanced Proactive Maintenance Dashboard 2. Predictive Maintenance Analytics 3. Advanced Troubleshooting Find patterns in instrument and service data to predict incipient failures, included as predictive alerts in the overall solution Predict probabilities of root causes / component failures based on recent patterns in data to guide remote services, included as root cause and next best action suggestion in the overall solution
  • 24.
    Advanced Service Analytics(ASA) Framework for building predictive models 24 PREPARATION OF MODEL INPUTS Create raw tables for indicator generation Compile model input Raw alarms Raw QC Raw calibration Raw states Raw counters Analytical base table, aggregated to daily indicators MVP 2 Predictive models Prioritised backlog of failure modes for modelling ranked regarding DEFINITION OF FAILURE MODES Group critical alarm codes to failure events Failure Mode 1 Failure Mode 2 Failure Mode 3 Extract additional failure modes from service activities Failure topic 1 derived from activity description Failure topic 1 derived from activity description Define and implement modelling framework  Mapping rule from inputs to outputs  Hold-out set for validation  Validation metrics to compare and accept models Setup and data science exploration and computation environment  Shared server for data storage and processing  Repository for code versioning and exchange  Platform for big data processing and deep learning capabilities
  • 25.
    Introduction From data toinsights From insights to production 25 Learnings
  • 26.
    Lessons learned -Key success factors for data science Easy to work with Business stakeholders appreciate the data science team‘s ability to quickly respond to their needs. Easy communication, quick decisions, fast moving PoVs. 1 Business proximity and literacy Data scientists have to acquire a deep understanding about how the business works, their needs and priorities via direct stakeholder interactions. PoVs are jointly executed with a high commitment and trust from both sides, business and data science. 2 Business impact by innovation By working closely with the business stakeholders, data science focuses on relevant topics and maximizes impact of outcomes. PoVs drive innovative, impactful products and reduce implementation risk. Reduction of time2market is key. 3
  • 27.
    This translates intosome aspects to consider for the future development on data science Provide business proximity by being where the business is. Continue developing business literacy to proactively drive business innovation by data science. Increase the presence of data science Support the change towards a data-driven culture by internally marketing success stories, interacting with business via ideation and design thinking workshops to generate innovative ideas (=experiments). Help establish a data- driven culture Once business stakeholders see the value potential by data science they want to exploit it asap. Accelerating productionization by providing an advanced analytics platform for data science and an enterprise data platform are key elements. Reduce time-to-market to maximize value-add
  • 28.
    Data Science andBusiness Proximity Embedded data scientists and efficient productionization Product Owner Business Analyst Data Engineer Product Owner Business Analyst Execution Team (PoV) Business IT Data Science IT Execution Team (Productionize) Execution Team (PoV) UX UI Designer Architect Data Scientist Data Scientist Developers Line of Business A Line of Business B … Embedded Data Scientist
  • 29.
    Summary Final thoughts  Runmany data science experiments to explore your ideas.  Data quality can easily be your limiting factor…  Quickly understand which ideas have innovation potential.  Develop prototypes, MVPs to further understand the obstacles to production.  As you move from experiment to production your team compositions changes from data scientists to data/software engineers/UI designers.  Involve the right skills at the right time to minimize time-to-market. 29
  • 30.
    Doing now whatpatients need next