The document discusses a market basket analysis project conducted by researchers at Binghamton University, aimed at understanding customer behavior through data mining techniques. It outlines the methodology, including the use of the apriori algorithm to extract association rules from transaction data, and highlights the results and implications for retail decision-making. Additionally, it emphasizes the potential application of market basket analysis in various other fields beyond retail.


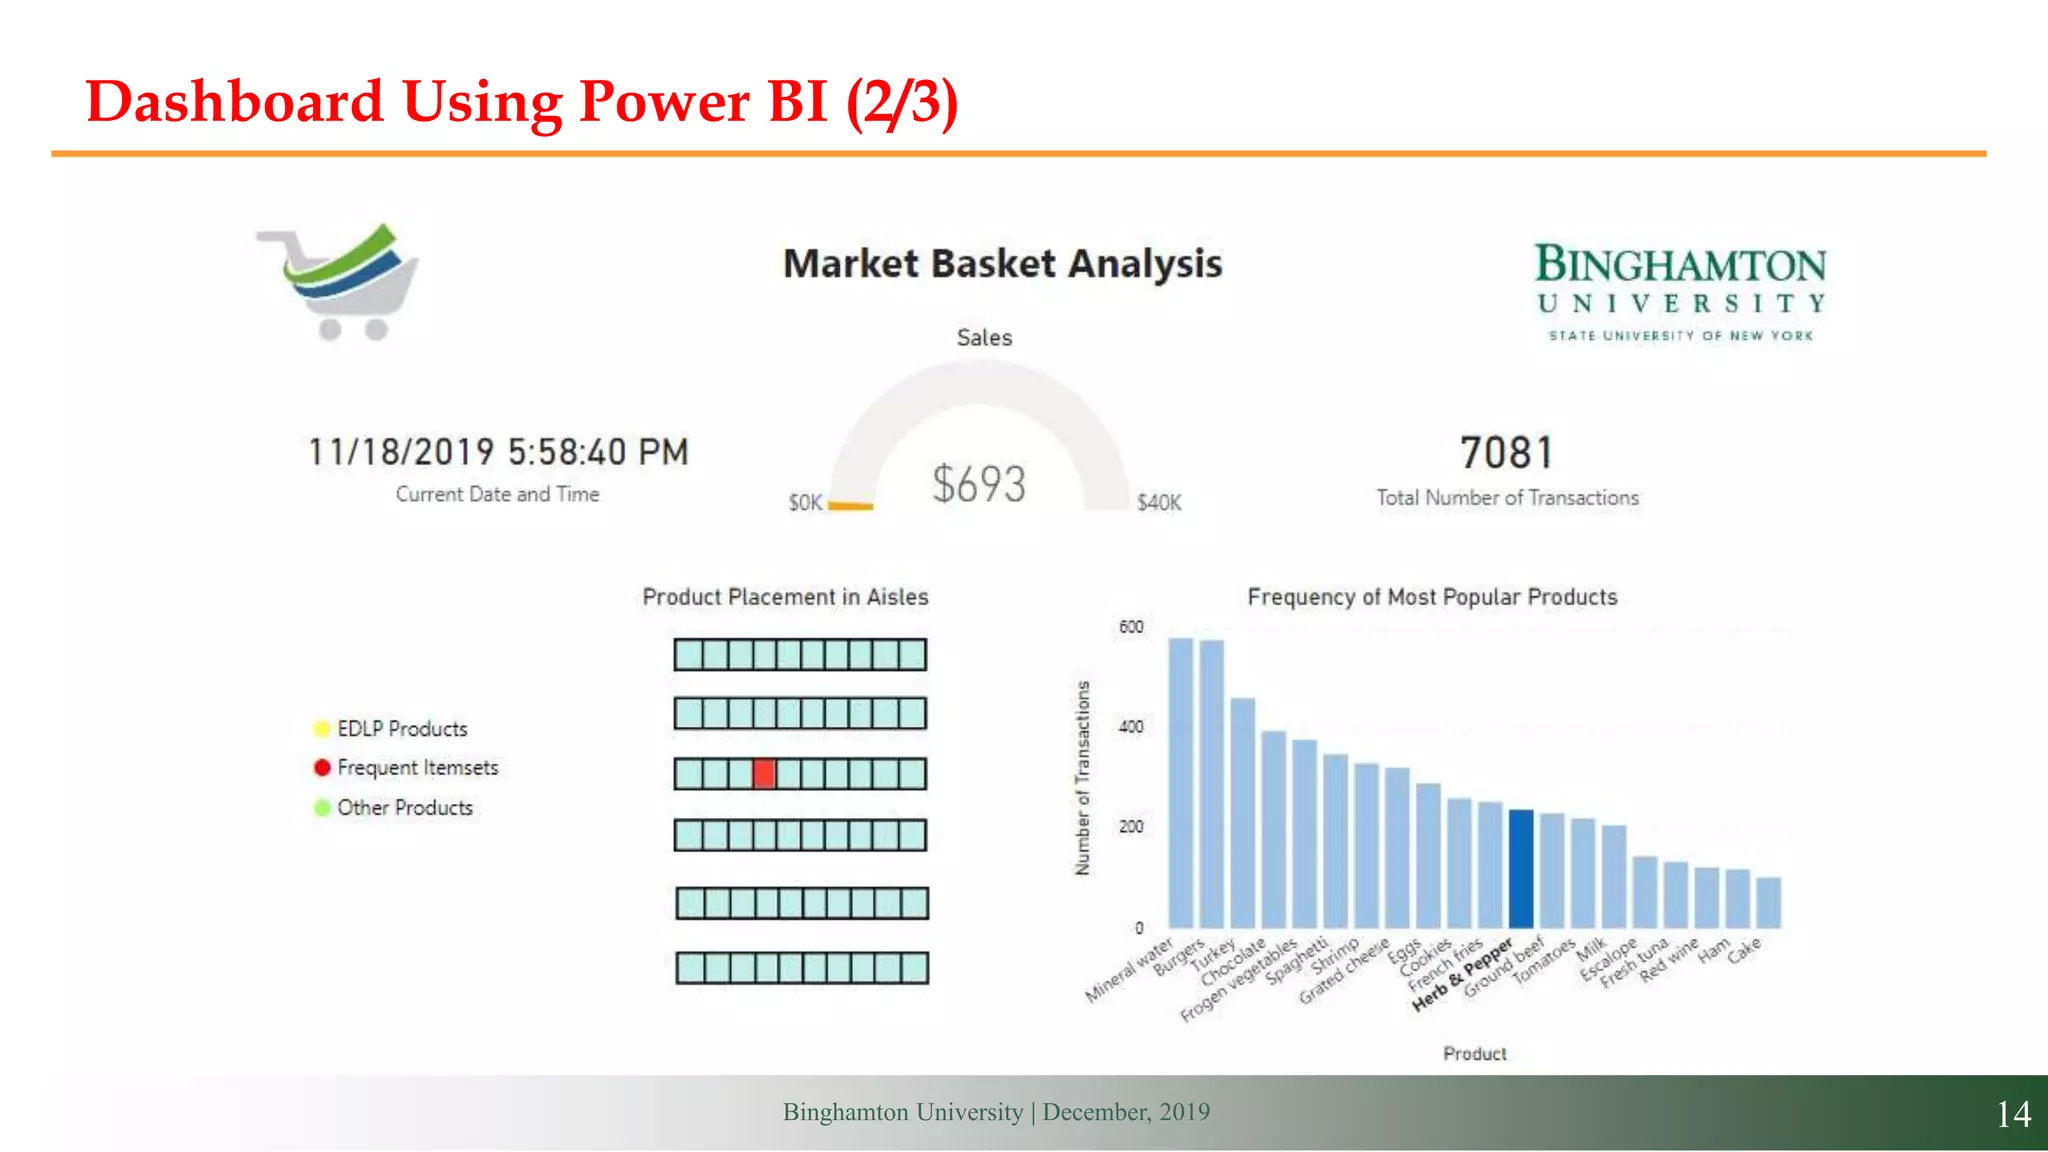
![10Binghamton University | December, 2019
Results of Apriori Algorithm
Association rules obtained
Bigger set of data can give more accurate rules
Knowledge is extracted
Rules obtained:
['pasta'] ['Almonds']
['Sugar’] ['Coffee']
['mushroom cream sauce’] ['escalope']
['herb & pepper'] ['noodles']
['tomato sauce'] ['noodles']
['whole wheat pasta'] ['olive oil']
Sugar
Coffee](https://image.slidesharecdn.com/datamininginmarketbasketanalysis-200611190843/75/Data-mining-in-market-basket-analysis-10-2048.jpg)