Download to read offline

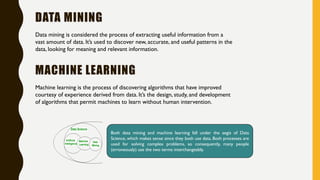
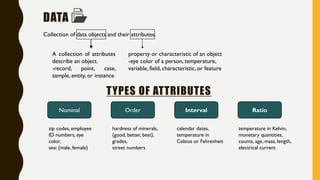
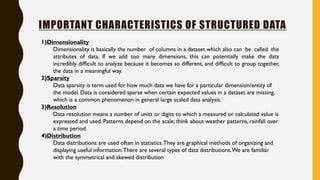
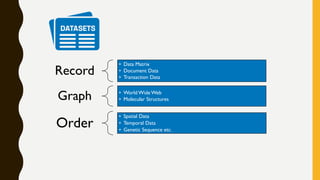
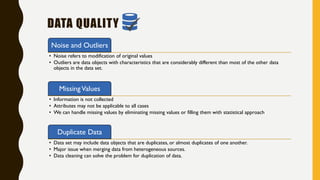
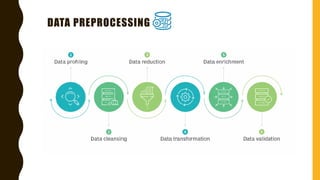
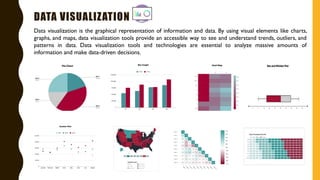
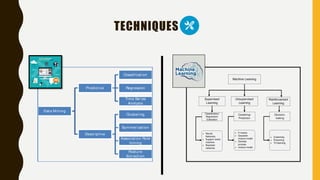
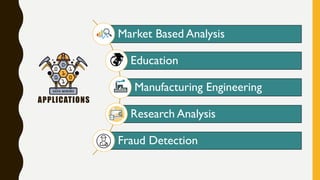
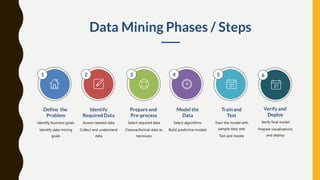


The document discusses data mining and machine learning, defining data mining as the extraction of useful information from vast datasets and machine learning as the development of algorithms that enhance through data experience. It highlights key characteristics of structured data such as dimensionality, sparsity, resolution, and distribution, along with common data quality issues like noise, outliers, and duplicates. Additionally, it emphasizes the importance of data visualization for understanding trends and informs various application areas including market analysis, healthcare, and manufacturing.


![[系列活動] 資料探勘速遊](https://cdn.slidesharecdn.com/ss_thumbnails/0114ycchendmquicktour-170110050658-thumbnail.jpg?width=640&height=640&fit=bounds)


![Wk. 3. Data [12-05-2021] (2).ppt](https://cdn.slidesharecdn.com/ss_thumbnails/wk-240205070901-8f81e253-thumbnail.jpg?width=640&height=640&fit=bounds)