Download to read offline

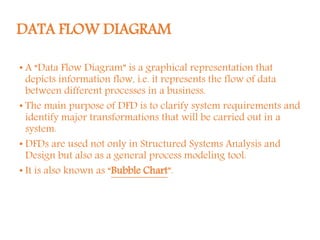
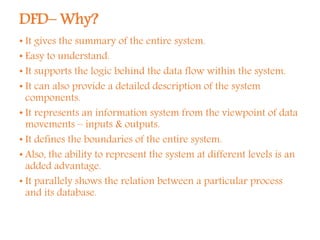
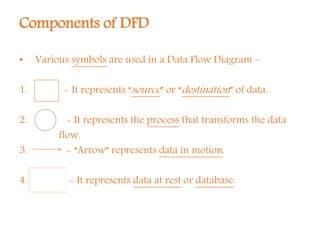
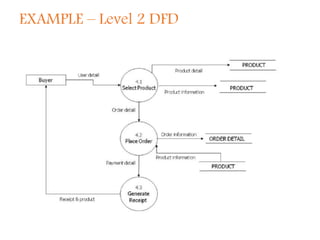


A Data Flow Diagram (DFD) is a graphical tool that illustrates the flow of data between processes in a business, clarifying system requirements and identifying major transformations. It employs various symbols to represent sources, processes, data flow, and databases, and is categorized into levels from context to more specific representations. DFDs facilitate understanding of system boundaries, data movement, and interprocess relationships, following conventions for clarity.