Downloaded 35 times


![• The following formula is for
(e.g., percent satisfied) based
on
on :
NZ × p(1 − p )
2
n=
NB 2 + [ Z 2 × p (1 − p)]
N – Population Size for 80% Confidence Level, Z = 1.28
Z – Z Statistic from normal distribution for 85% Confidence Level, Z = 1.45
P – Estimated Satisfaction Level for 90% Confidence Level, Z = 1.65
B – Margin of Error for 95% Confidence Level, Z = 1.96](https://image.slidesharecdn.com/customersatisfaction-110419224507-phpapp02/75/Customer-satisfaction-15-2048.jpg)

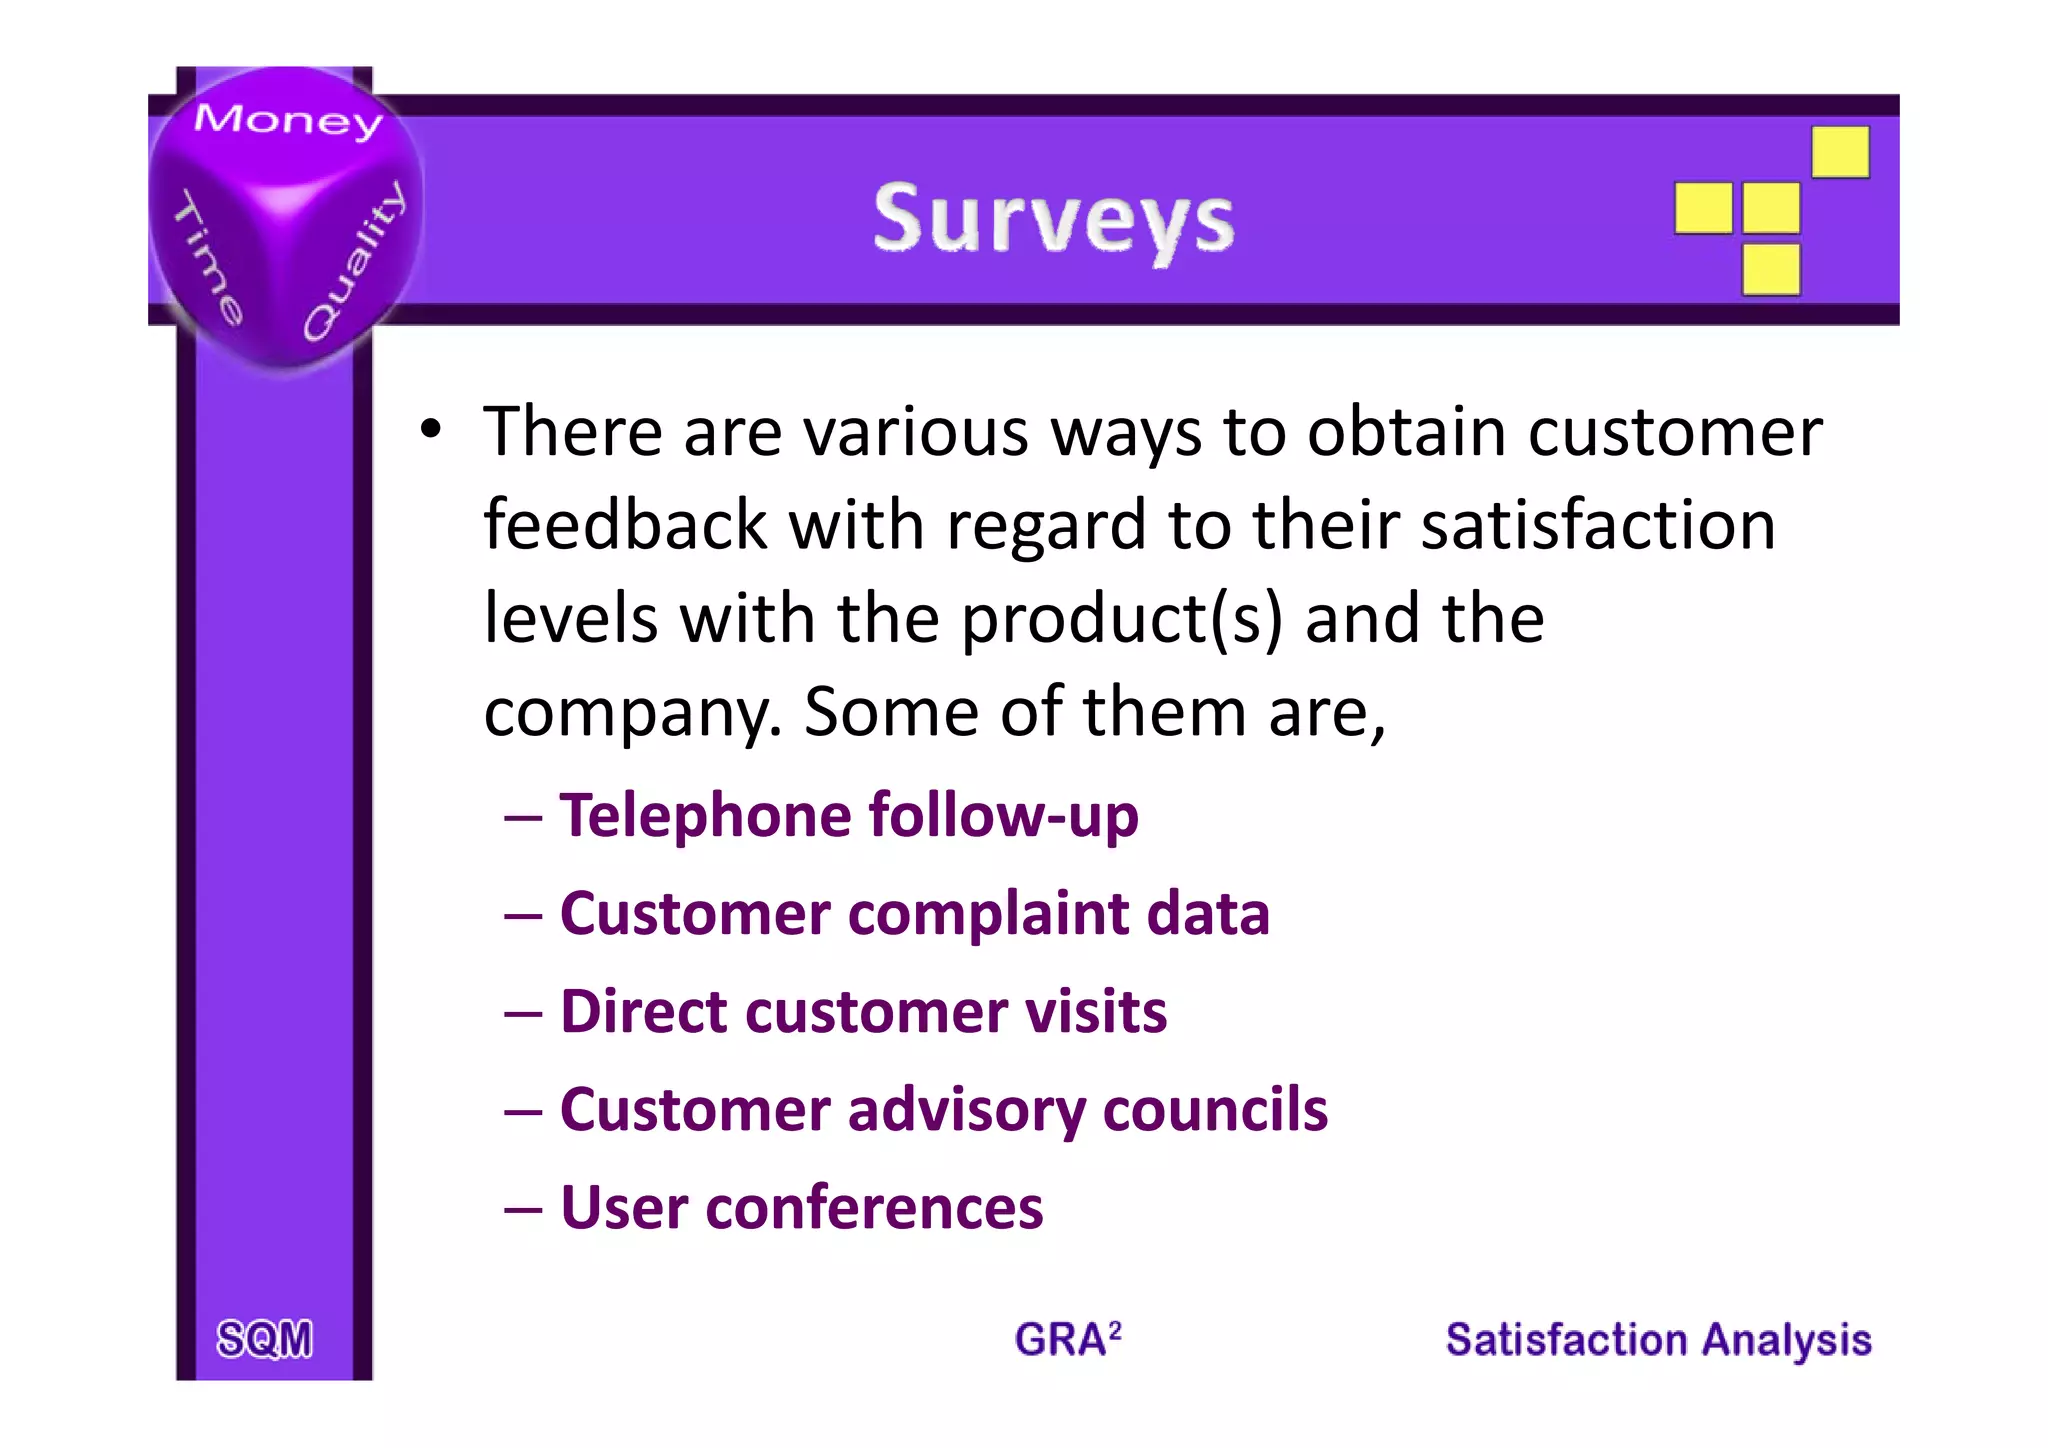
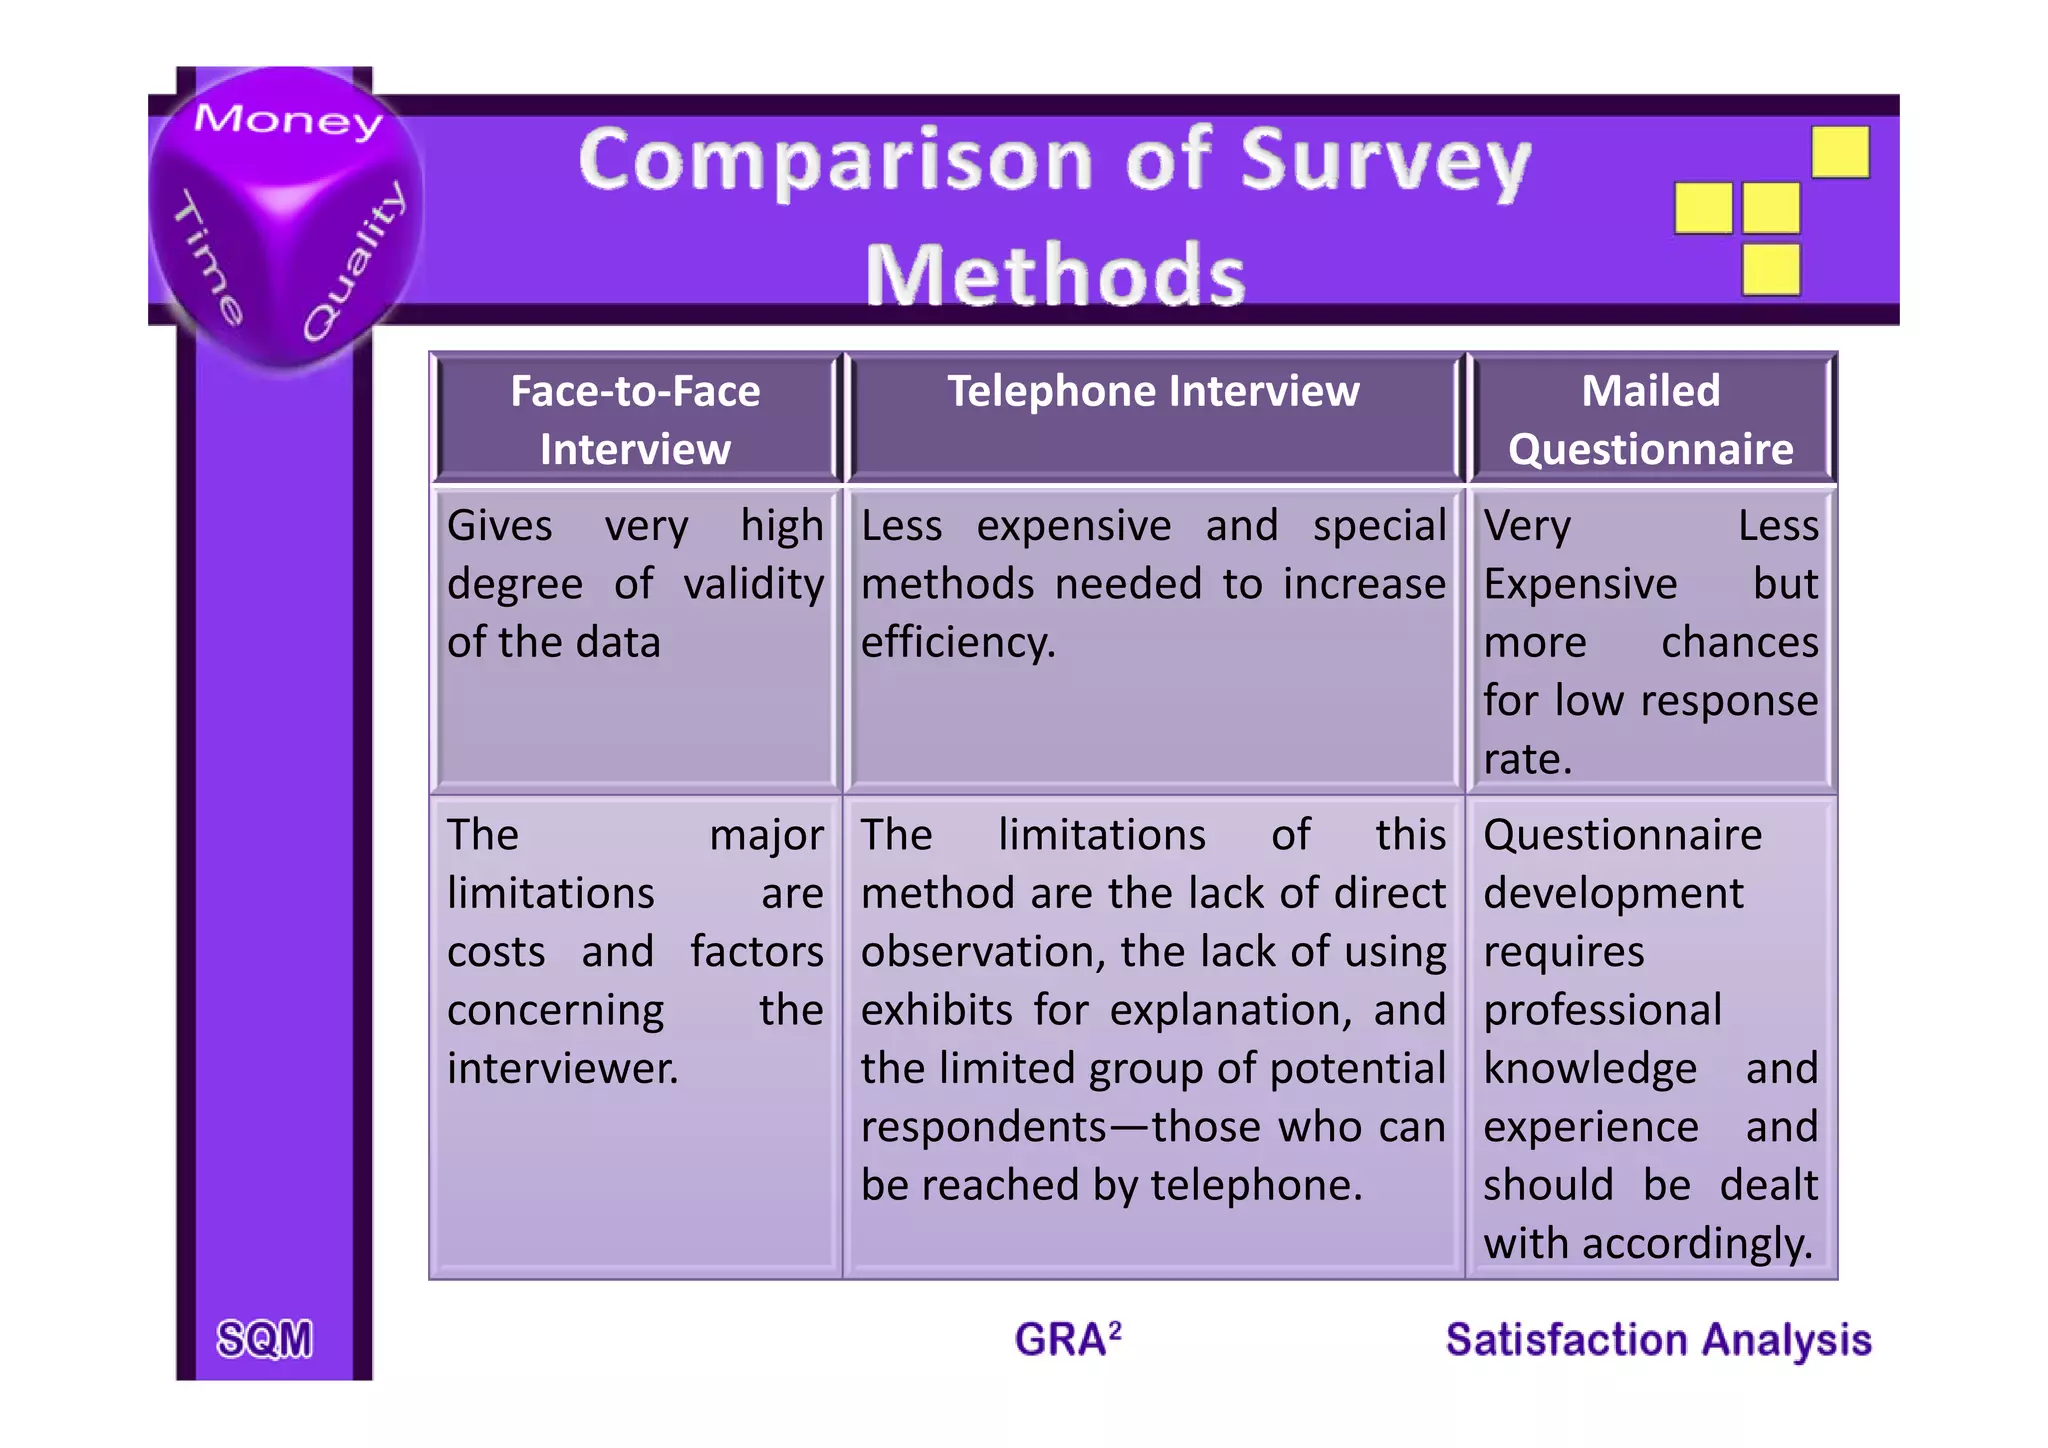
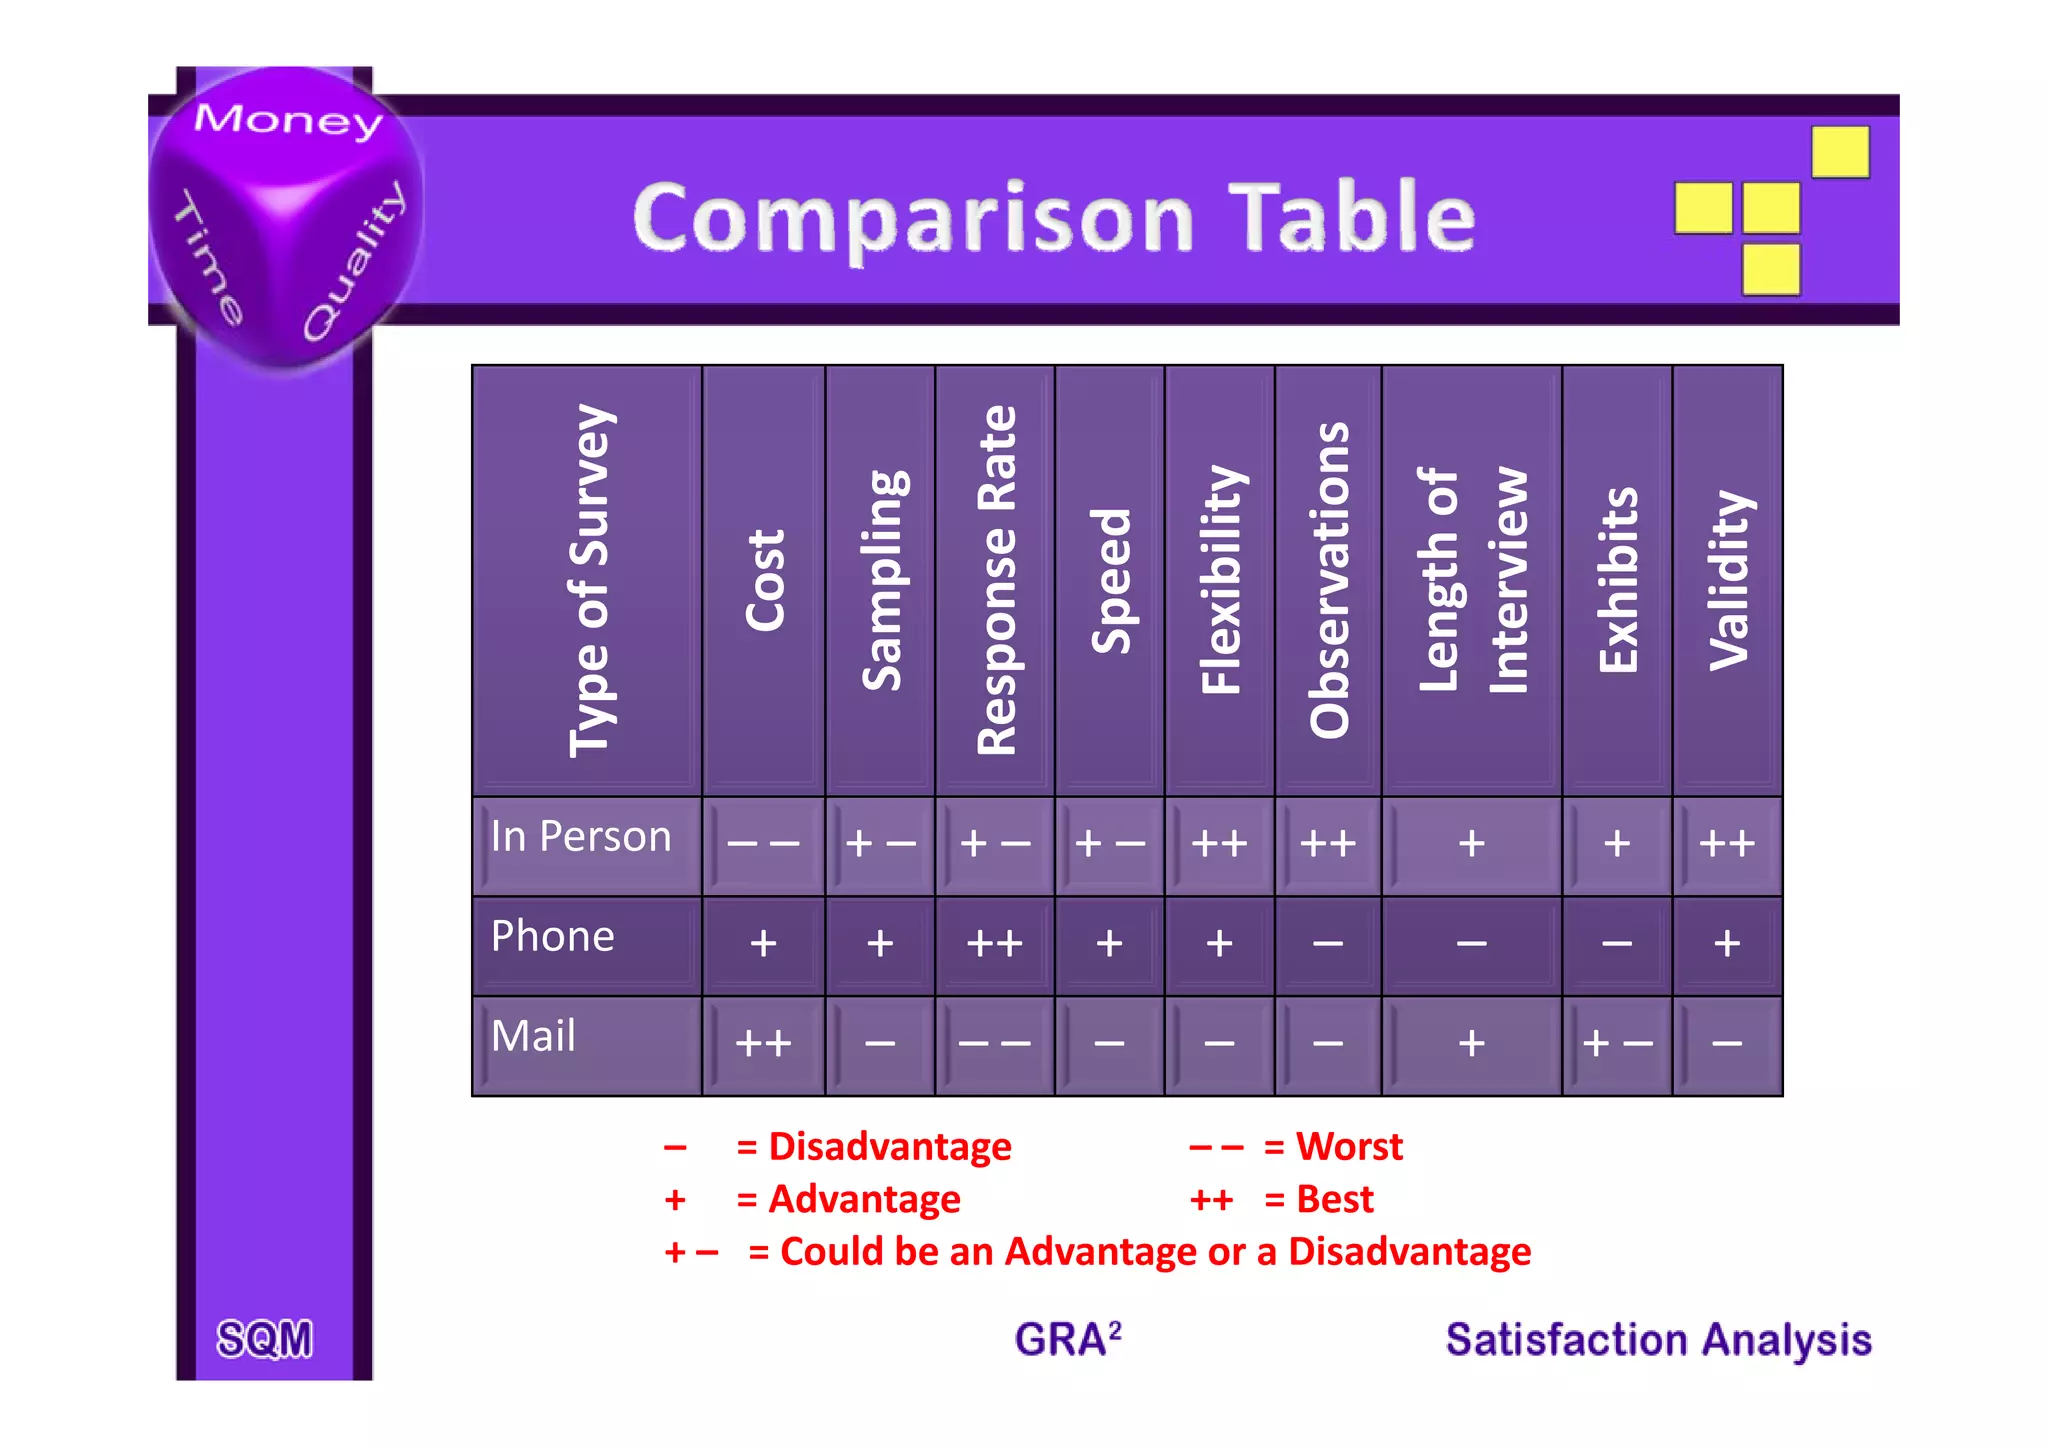
1. Customer satisfaction surveys are used to ensure customers have positive experiences and to understand future purchasing patterns. 2. There are various ways to obtain customer feedback, such as telephone calls, complaints, visits, and advisory councils. 3. The three most common survey methods are face-to-face interviews, telephone interviews, and mailed questionnaires, each with their own advantages and limitations.