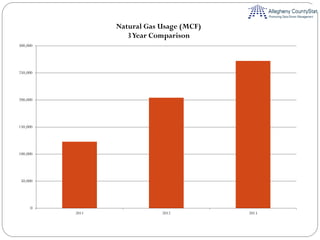
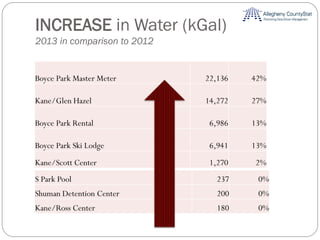
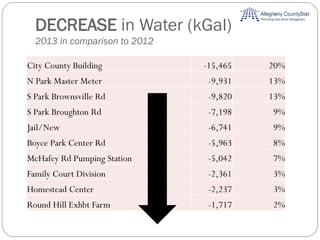
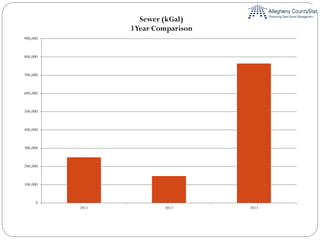
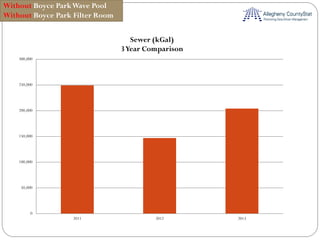
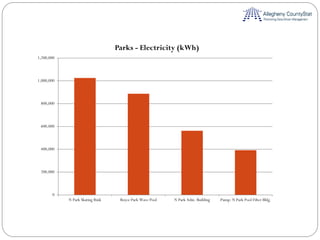
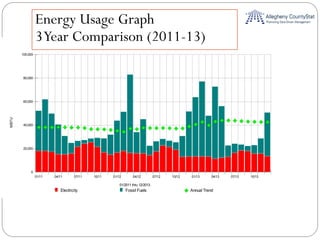
2. Outcomes
Make decisions on data presented
Identify ways to improve data collection and analysis
Establish roles and responsibilities of Departments and
County employees
Determine next steps
6. INCREASE in Electricity (kWh)
2013 in comparison to 2012
Allegheny County Medical Examiner 1146637 83%
Boyce ParkWave Pool 196794 14%
N Park Boat House 13226 1%
Light: S Express. Sect 18B 11496 1%
Light: S Express. Sect 14A 3784 0%
RadioTower: Chas. St. 2425 0%
Boyce Park Res 3-6 890 0%
HartwoodAcres Barn 24 0%
7. DECREASE in Electricity (kWh)
2013 in comparison to 2012
Jail/New -1472145 14%
County Office Building -727921 7%
Clack Center/Marine Hospital -608957 6%
Kane/Scott Center -513022 5%
Kane/McKeesport -511333 5%
S Park Master-Maint Complex -497979 5%
Family Court Division -463205 5%
Settler's CabinWave Pool -448465 4%
S Park Master-Feeder -431825 4%
Shuman Detention Center -403431 4%
9. Warehouse 1 7,877 37%
Shuman Detention Center 1,873 9%
Kane/Ross Center 1,197 6%
Boyce Park Ski Lodge 1,066 5%
Arsenal Health 988 5%
S Park Master-Feeder 825 4%
Ridge Road Maintenance Bldg 679 3%
S Side Garage 581 3%
INCREASE in Natural Gas (MCF)
2013 in comparison to 2012
10. DECREASE in Natural Gas (MCF)
2013 in comparison to 2012
Kane/Glen Hazel -6,212 -29%
Allegheny County Medical Examiner -2,919 -14%
Maint Bldg Elizabeth -1,256 -6%
Boyce Park Maint Center -1,003 -5%
N Park Master Meter -815 -4%
Hartwood Acres Mansion -664 -3%
S Park Fairground Cottage -611 -3%
Health Dept -512 -2%
Kane/McKeesport -479 -2%
Homestead Center -386 -2%
12. Boyce Park Filter Room 2,082,912 77%
Boyce ParkWave Pool 578,364 21%
Boyce Park Master Meter 22,136 1%
Kane/Glen Hazel 14,272 1%
Boyce Park Rental 6,986 0%
Boyce Park Ski Lodge 6,941 0%
Kane/Scott Center 1,270 0%
INCREASE in Water (kGal)
2013 in comparison to 2012
14. Boyce Park Master Meter 22,136 42%
Kane/Glen Hazel 14,272 27%
Boyce Park Rental 6,986 13%
Boyce Park Ski Lodge 6,941 13%
Kane/Scott Center 1,270 2%
INCREASE in Water (kGal)
2013 in comparison to 2012
S Park Pool 237 0%
Shuman Detention Center 200 0%
Kane/Ross Center 180 0%
15. DECREASE in Water (kGal)
2013 in comparison to 2012
City County Building -15,465 20%
N Park Master Meter -9,931 13%
S Park Brownsville Rd -9,820 13%
S Park Broughton Rd -7,198 9%
Jail/New -6,741 9%
Boyce Park Center Rd -5,963 8%
McHafey Rd Pumping Station -5,042 7%
Family Court Division -2,361 3%
Homestead Center -2,237 3%
Round Hill Exhbt Farm -1,717 2%
17. Without Boyce ParkWave Pool
Without Boyce Park Filter Room
0
50,000
100,000
150,000
200,000
250,000
300,000
2011 2012 2013
Sewer (kGal)
3Year Comparison
18. INCREASE in Sewer (kGal)
2013 in comparison to 2012
Without Boyce ParkWave Pool
Without Boyce Park Filter Room
Boyce Park Master Meter 54,736 71%
South Park Pool Sewage 12,888 17%
Boyce Park Ski Lodge 6,947 9%
Settler's Cabin Park Pump House 1,927 2%
Warehouse5 Hillcrest/Zimmerly Sewage 314 0%
Shuman Detention Center 200 0%
Health Dept 186 0%
Allegheny County Medical Examiner 114 0%
ThirdAvenueAttendant's Booth 38 0%
South Park-Stoltz Rd Sewage 20 0%
19. DECREASE in Sewer (kGal)
2013 in comparison to 2012
City County Building -15465 38%
Jail/New -7388 18%
Family Court Division -2345 6%
Homestead Center -2237 6%
Kane/McKeesport -2089 5%
South Park Baptist Rd.Sewage -2026 5%
Kane/Scott Center -1832 5%
S Park Pool -1586 4%
40th St Bridge -1406 3%
Kane/Ross Center -1191 3%
20. Highest Energy Index (Btu/SqFt/HDD/Yr)
Allegheny County PA
Year Ending 01/2014
Warehouse 3
Boyce Park Nature Center
Hartwood Acres Res 9-3
Warehouse 1
Allegheny County Medical Examiner
Hartwood Acres Mansion
NPark Nature Center
Settler's Cabin Wave Pool
Hartwood Acres Stable
NPark Adm. Building
0 200 400 600 800
21. Highest Energy Index (Btu/SqFt/HDD/Yr)
Allegheny County PA
Year Ending 01/2014
Warehouse 3
Boyce Park Nature Center
Hartwood Acres Res 9-3
Warehouse 1
Allegheny County Medical Examiner
Hartwood Acres Mansion
NPark Nature Center
Settler's Cabin Wave Pool
Hartwood Acres Stable
NPark Adm. Building
0 200 400 600 800
Demonstrates the needs for better metering
systems.
31. Jan 2014 Feb 2014
Anticipated
Completion time
3.8 Months
By June/July 2014
Total Hours 5076 3242
Weeks (based
on 80
hours/wk) 63.5 42
Weeks per
trade
(based on 6
primary trades) 10.5 6.75
With the Current 211 in Progress…
32. Challenges of Data Systems
Utility Manager Cityworks
+
Built acumen of how to use
system
Very well-organized data
Great Reporting capabilities
-
No Real-time Data - only on a
monthly basis
No integration with City works
+
Real time data
Rich data
-
More training required of staff
that use it
No integration with UM or
other programs