Download to read offline

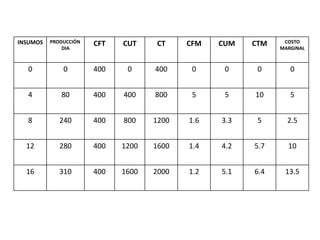
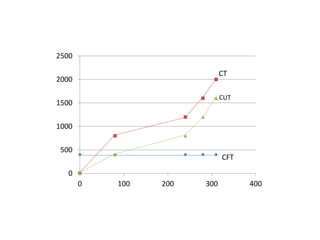
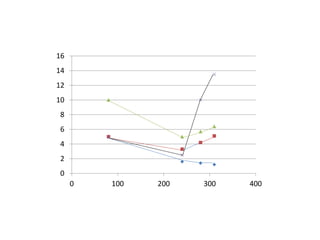

This document contains a table showing the daily inputs and costs of production over a period of 16 days. The table tracks the cumulative and marginal costs of various inputs including labor (CFT), materials (CUT), and total costs (CT) as production levels increase from 0 to 2000 units. Marginal cost per unit initially decreases but then increases as production volumes grow larger.


