Downloaded 44 times
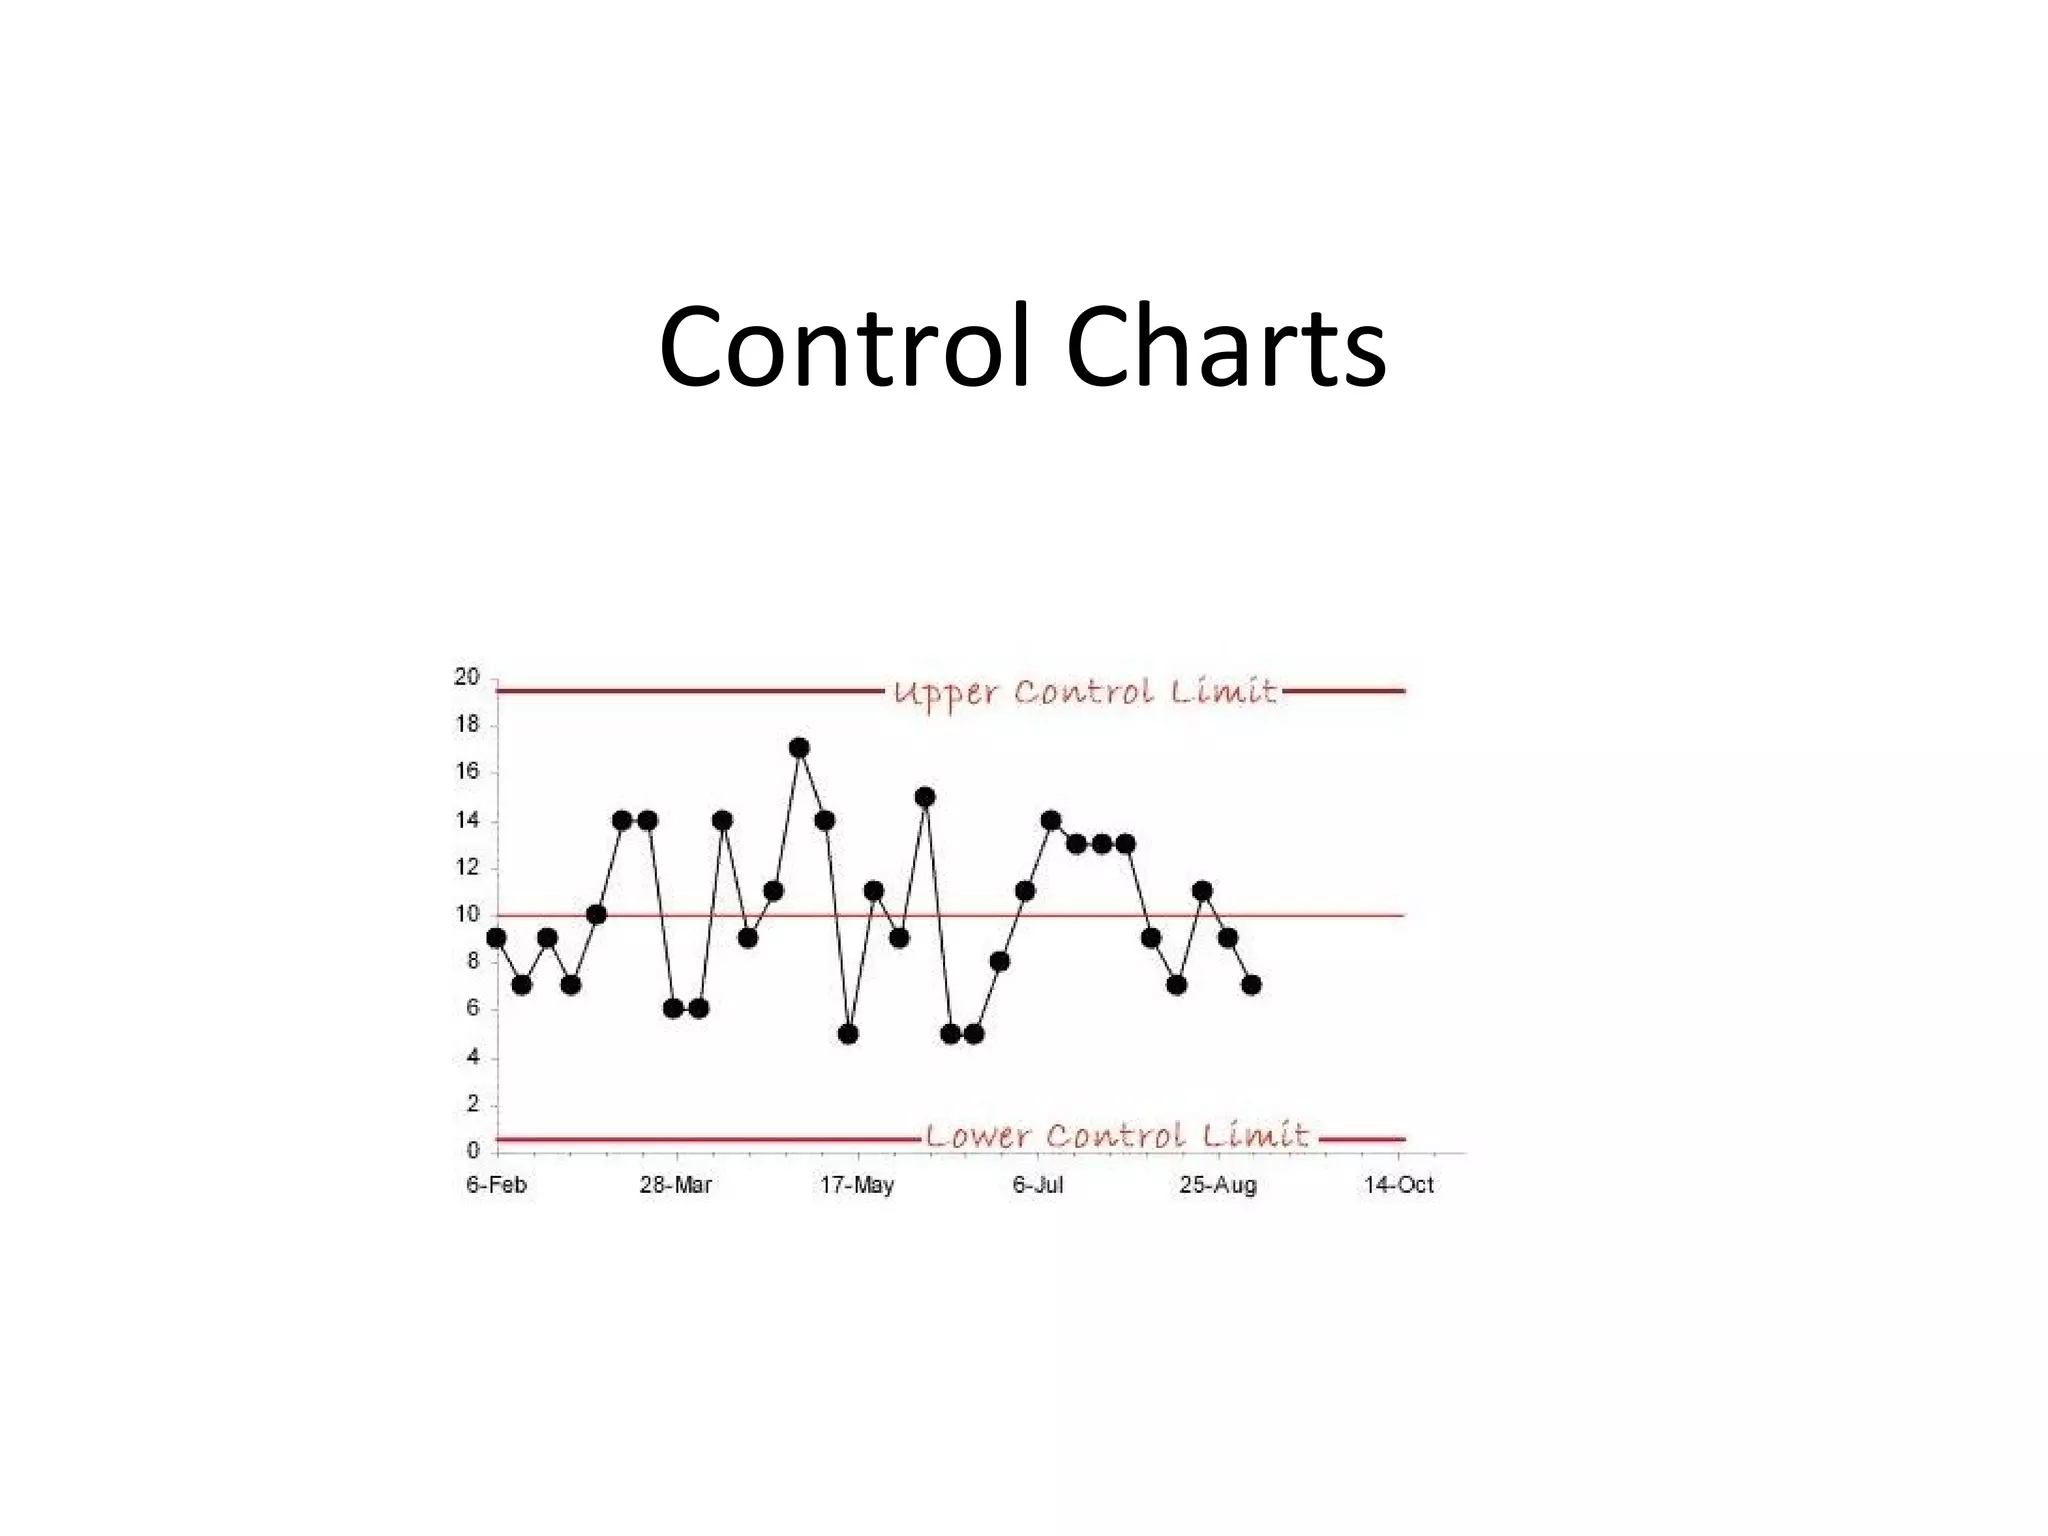
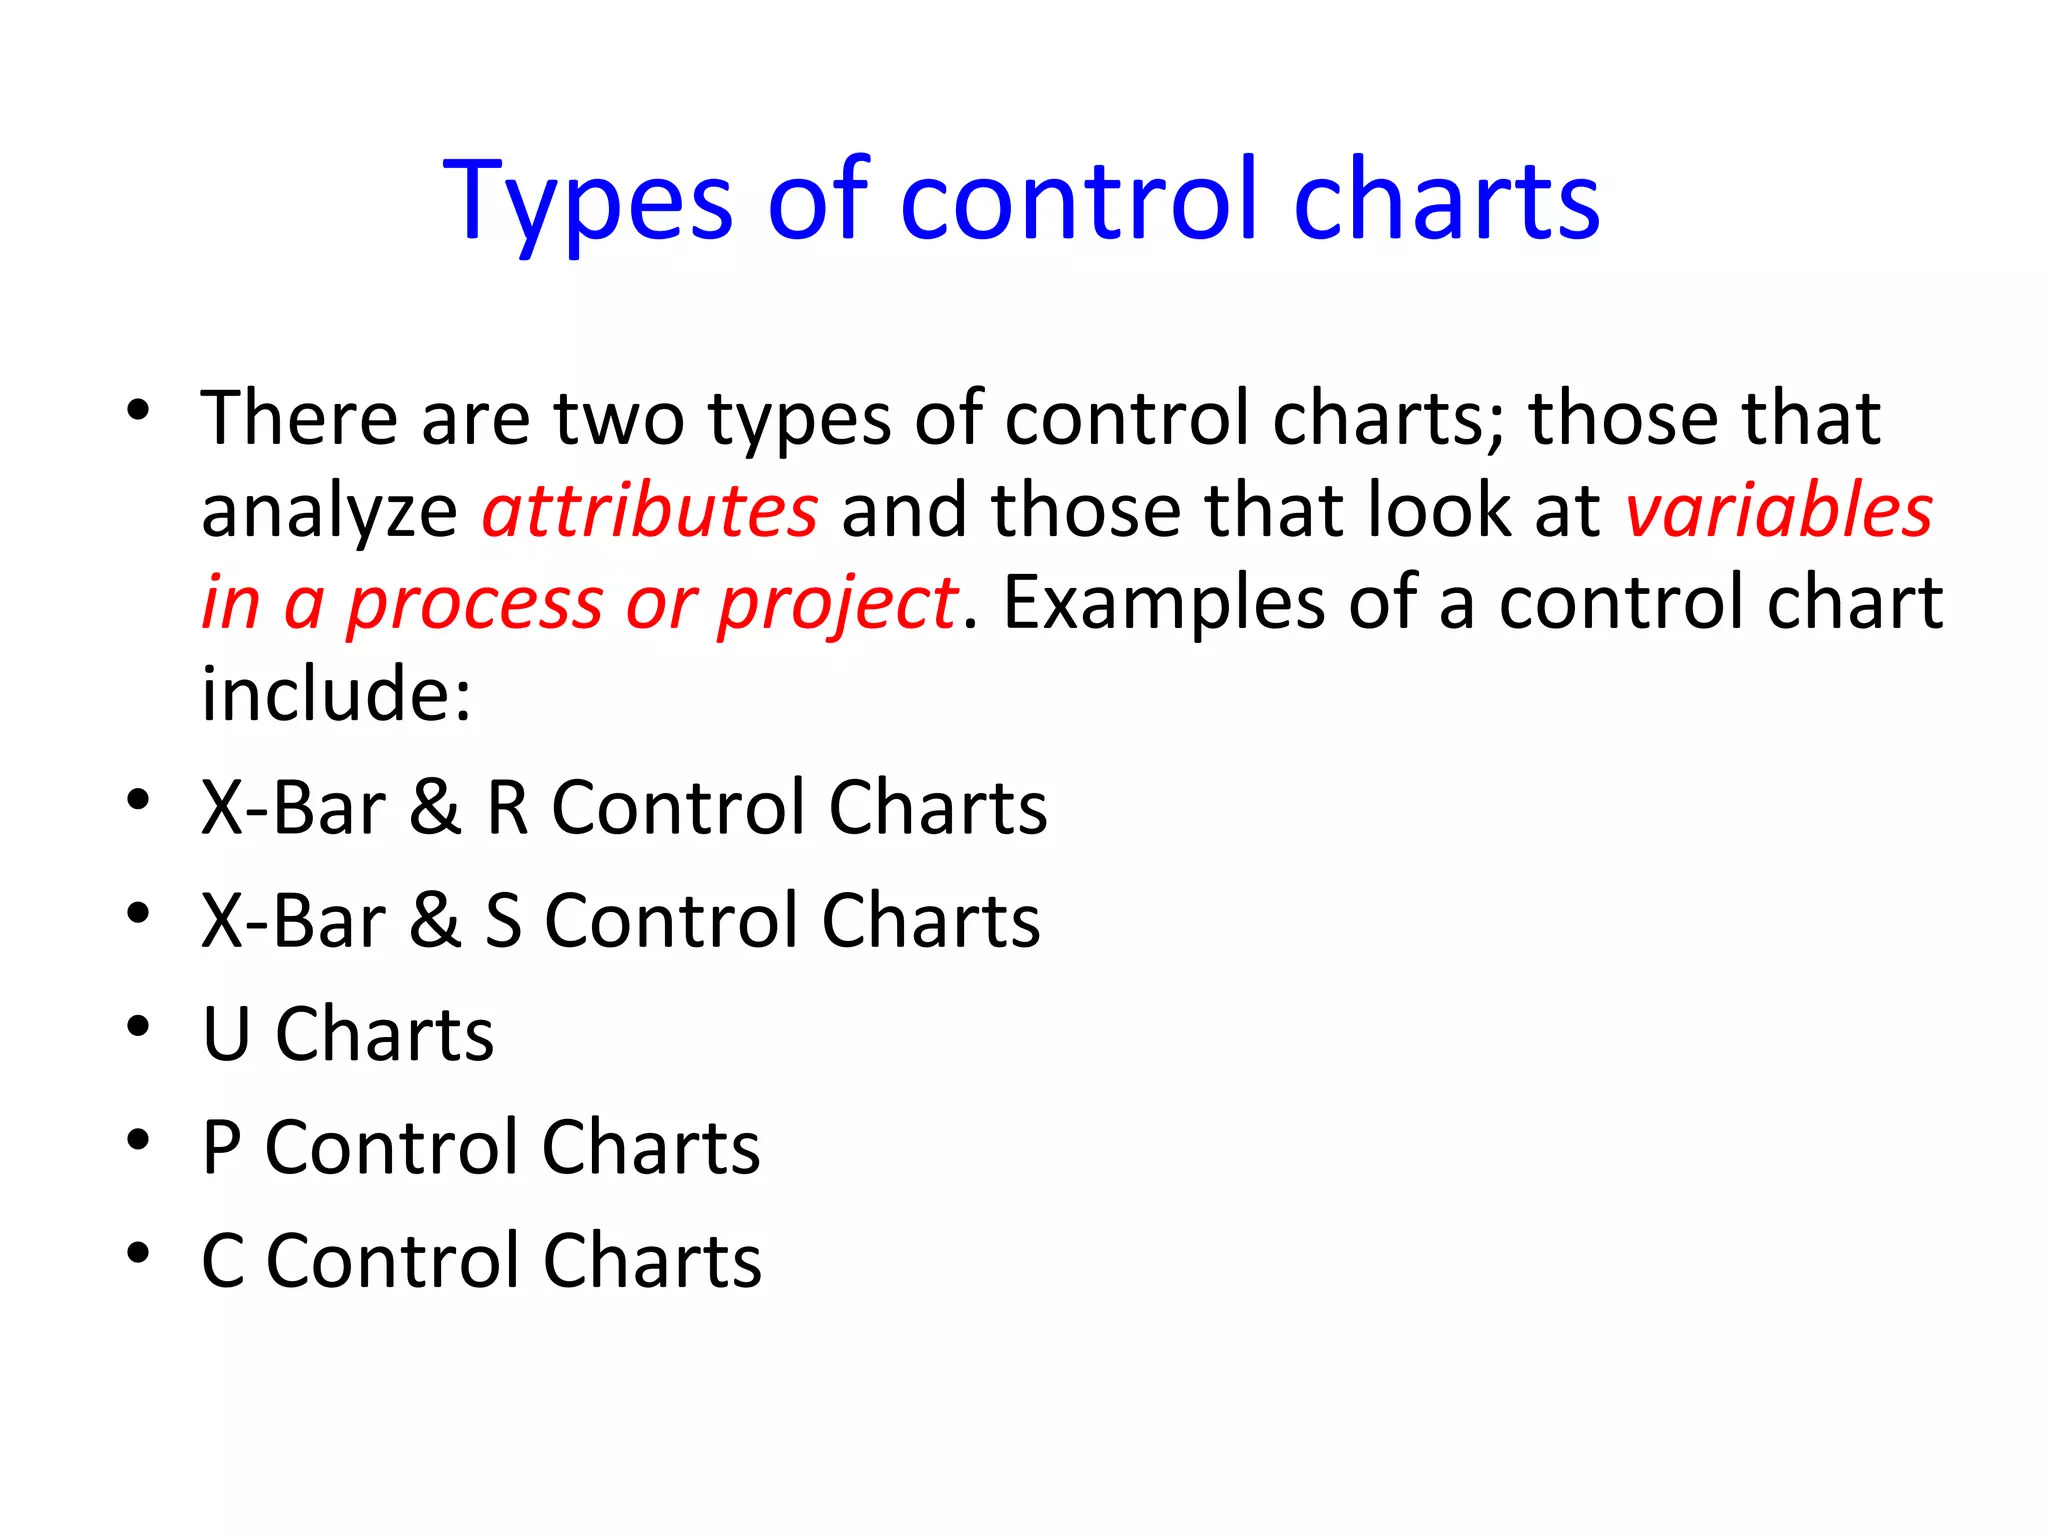
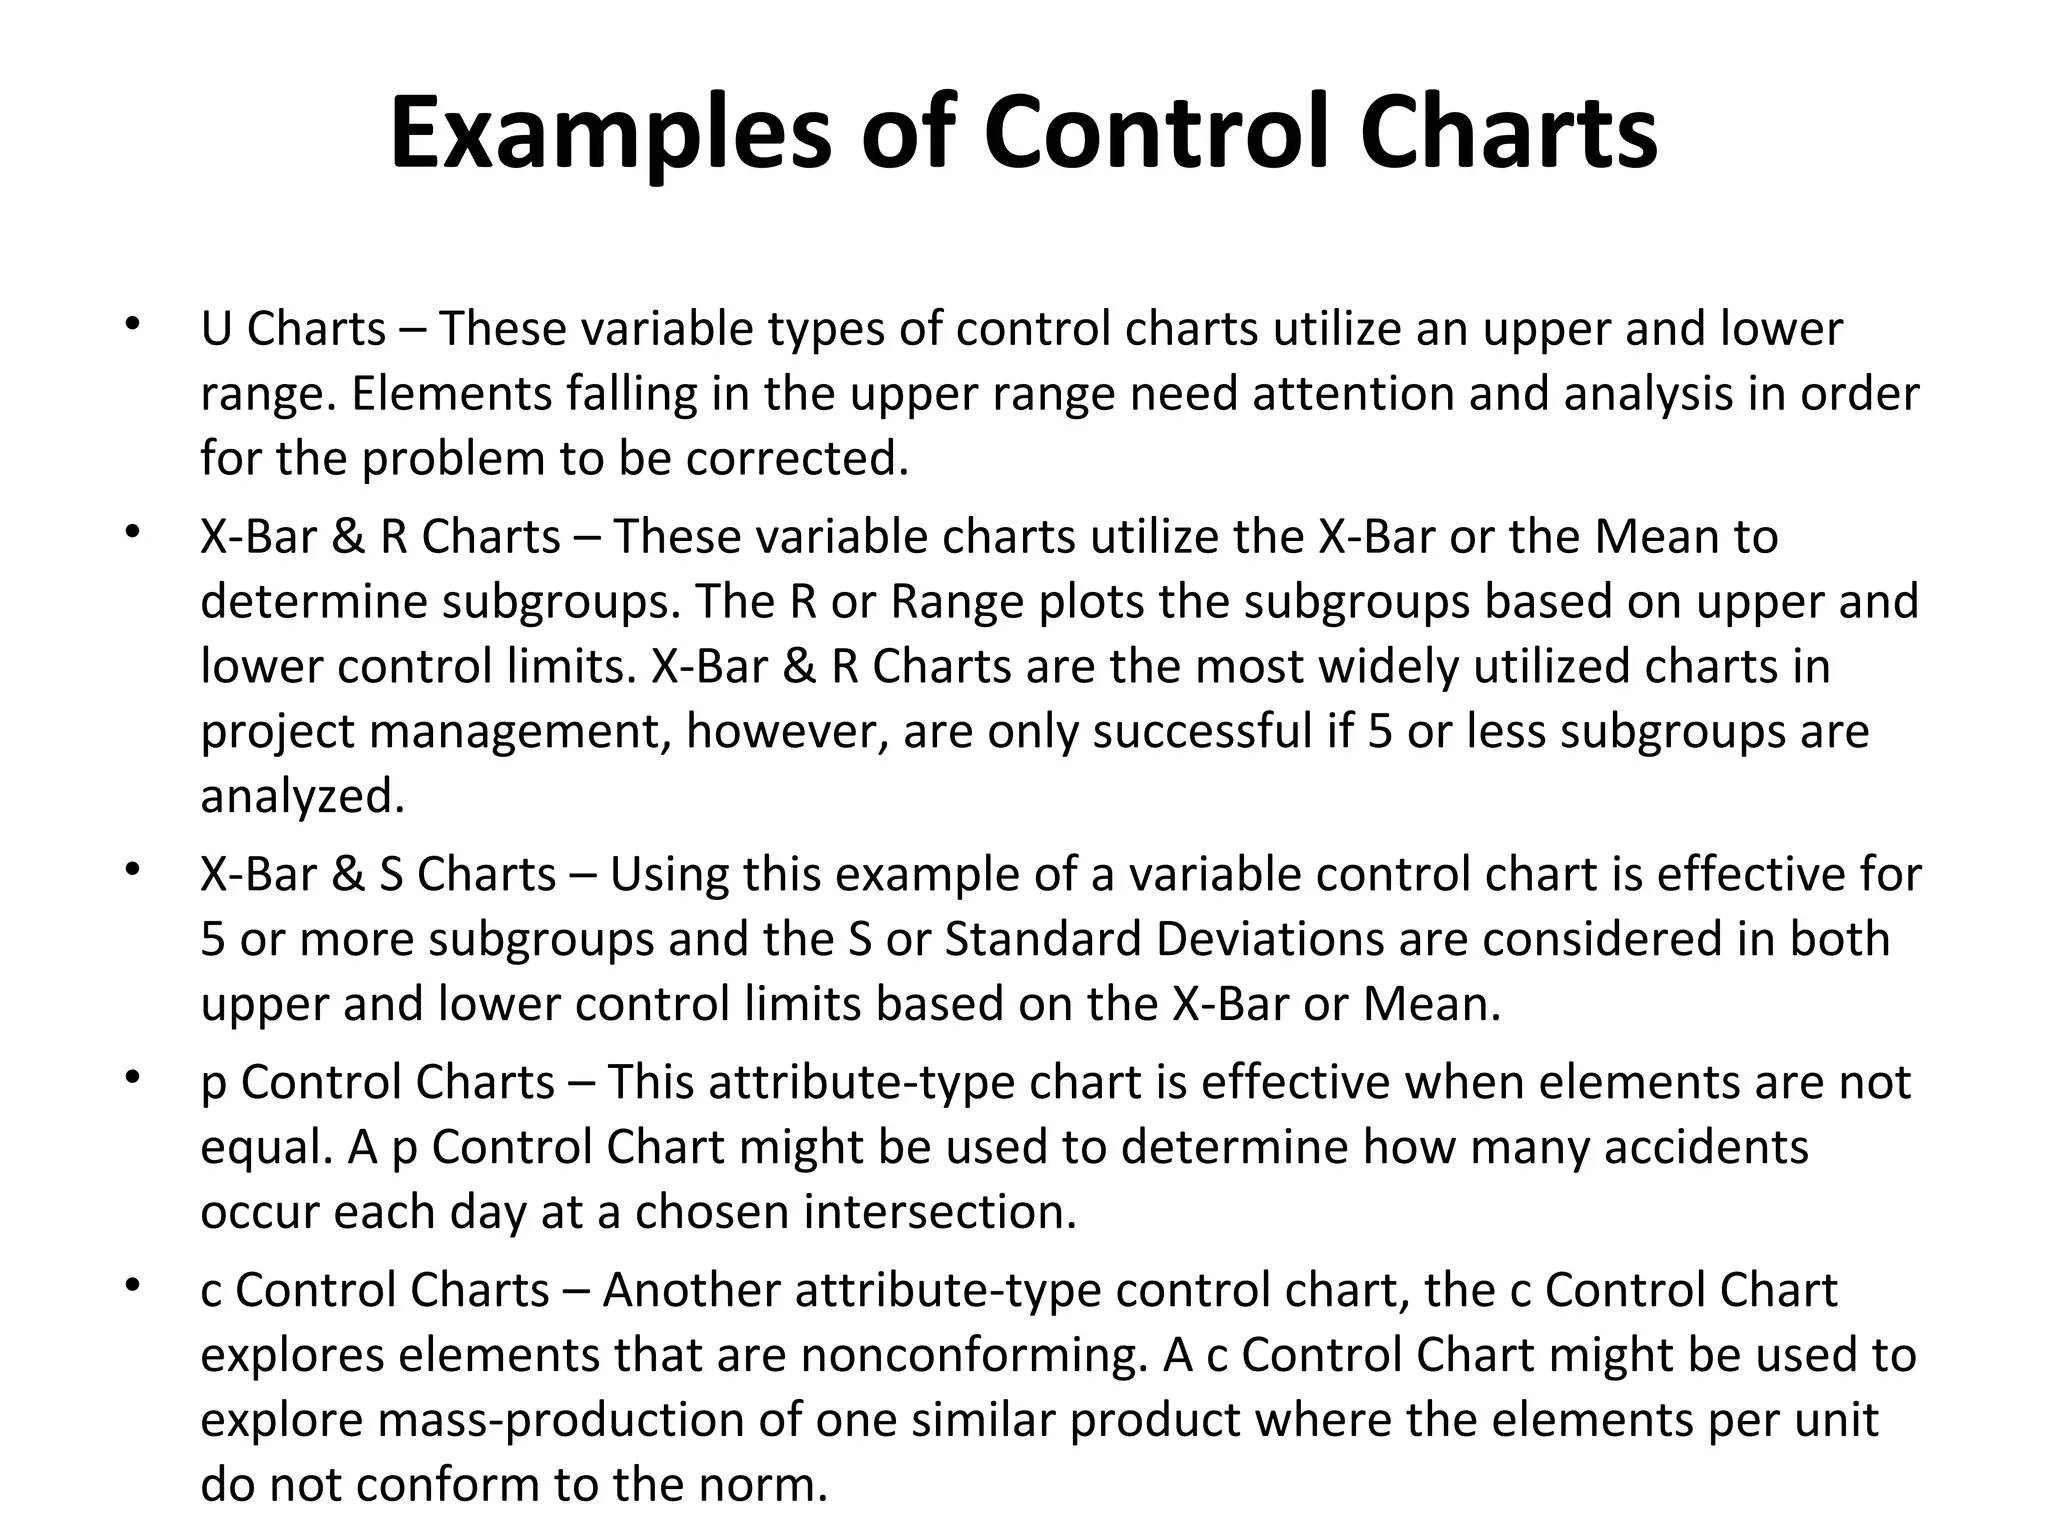
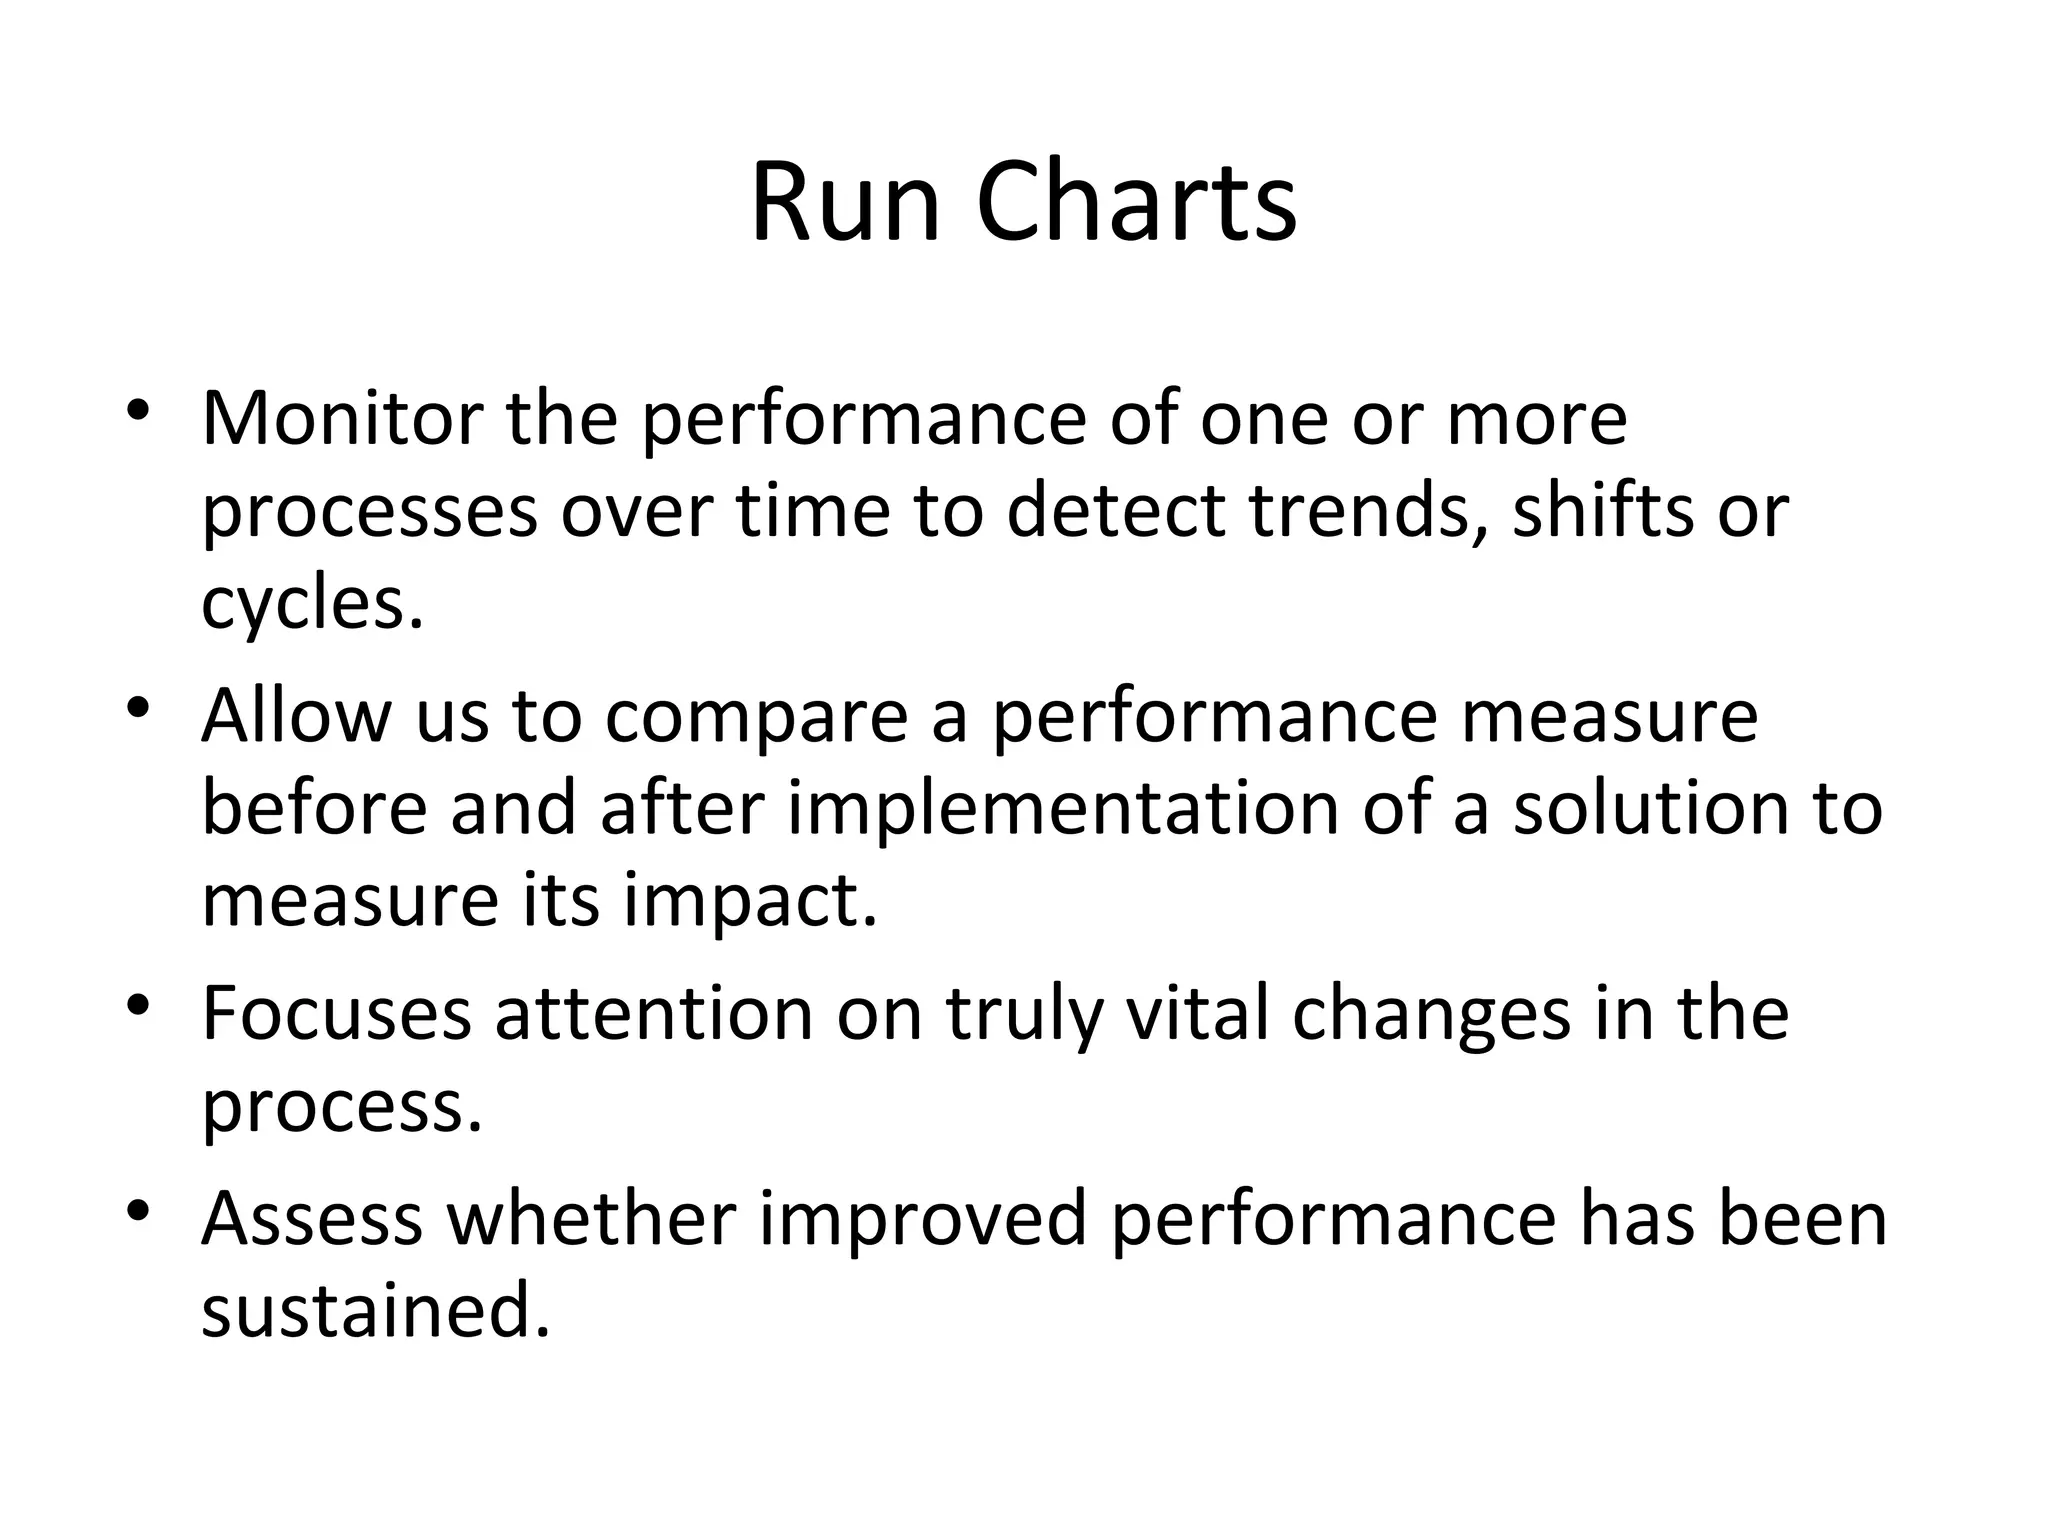
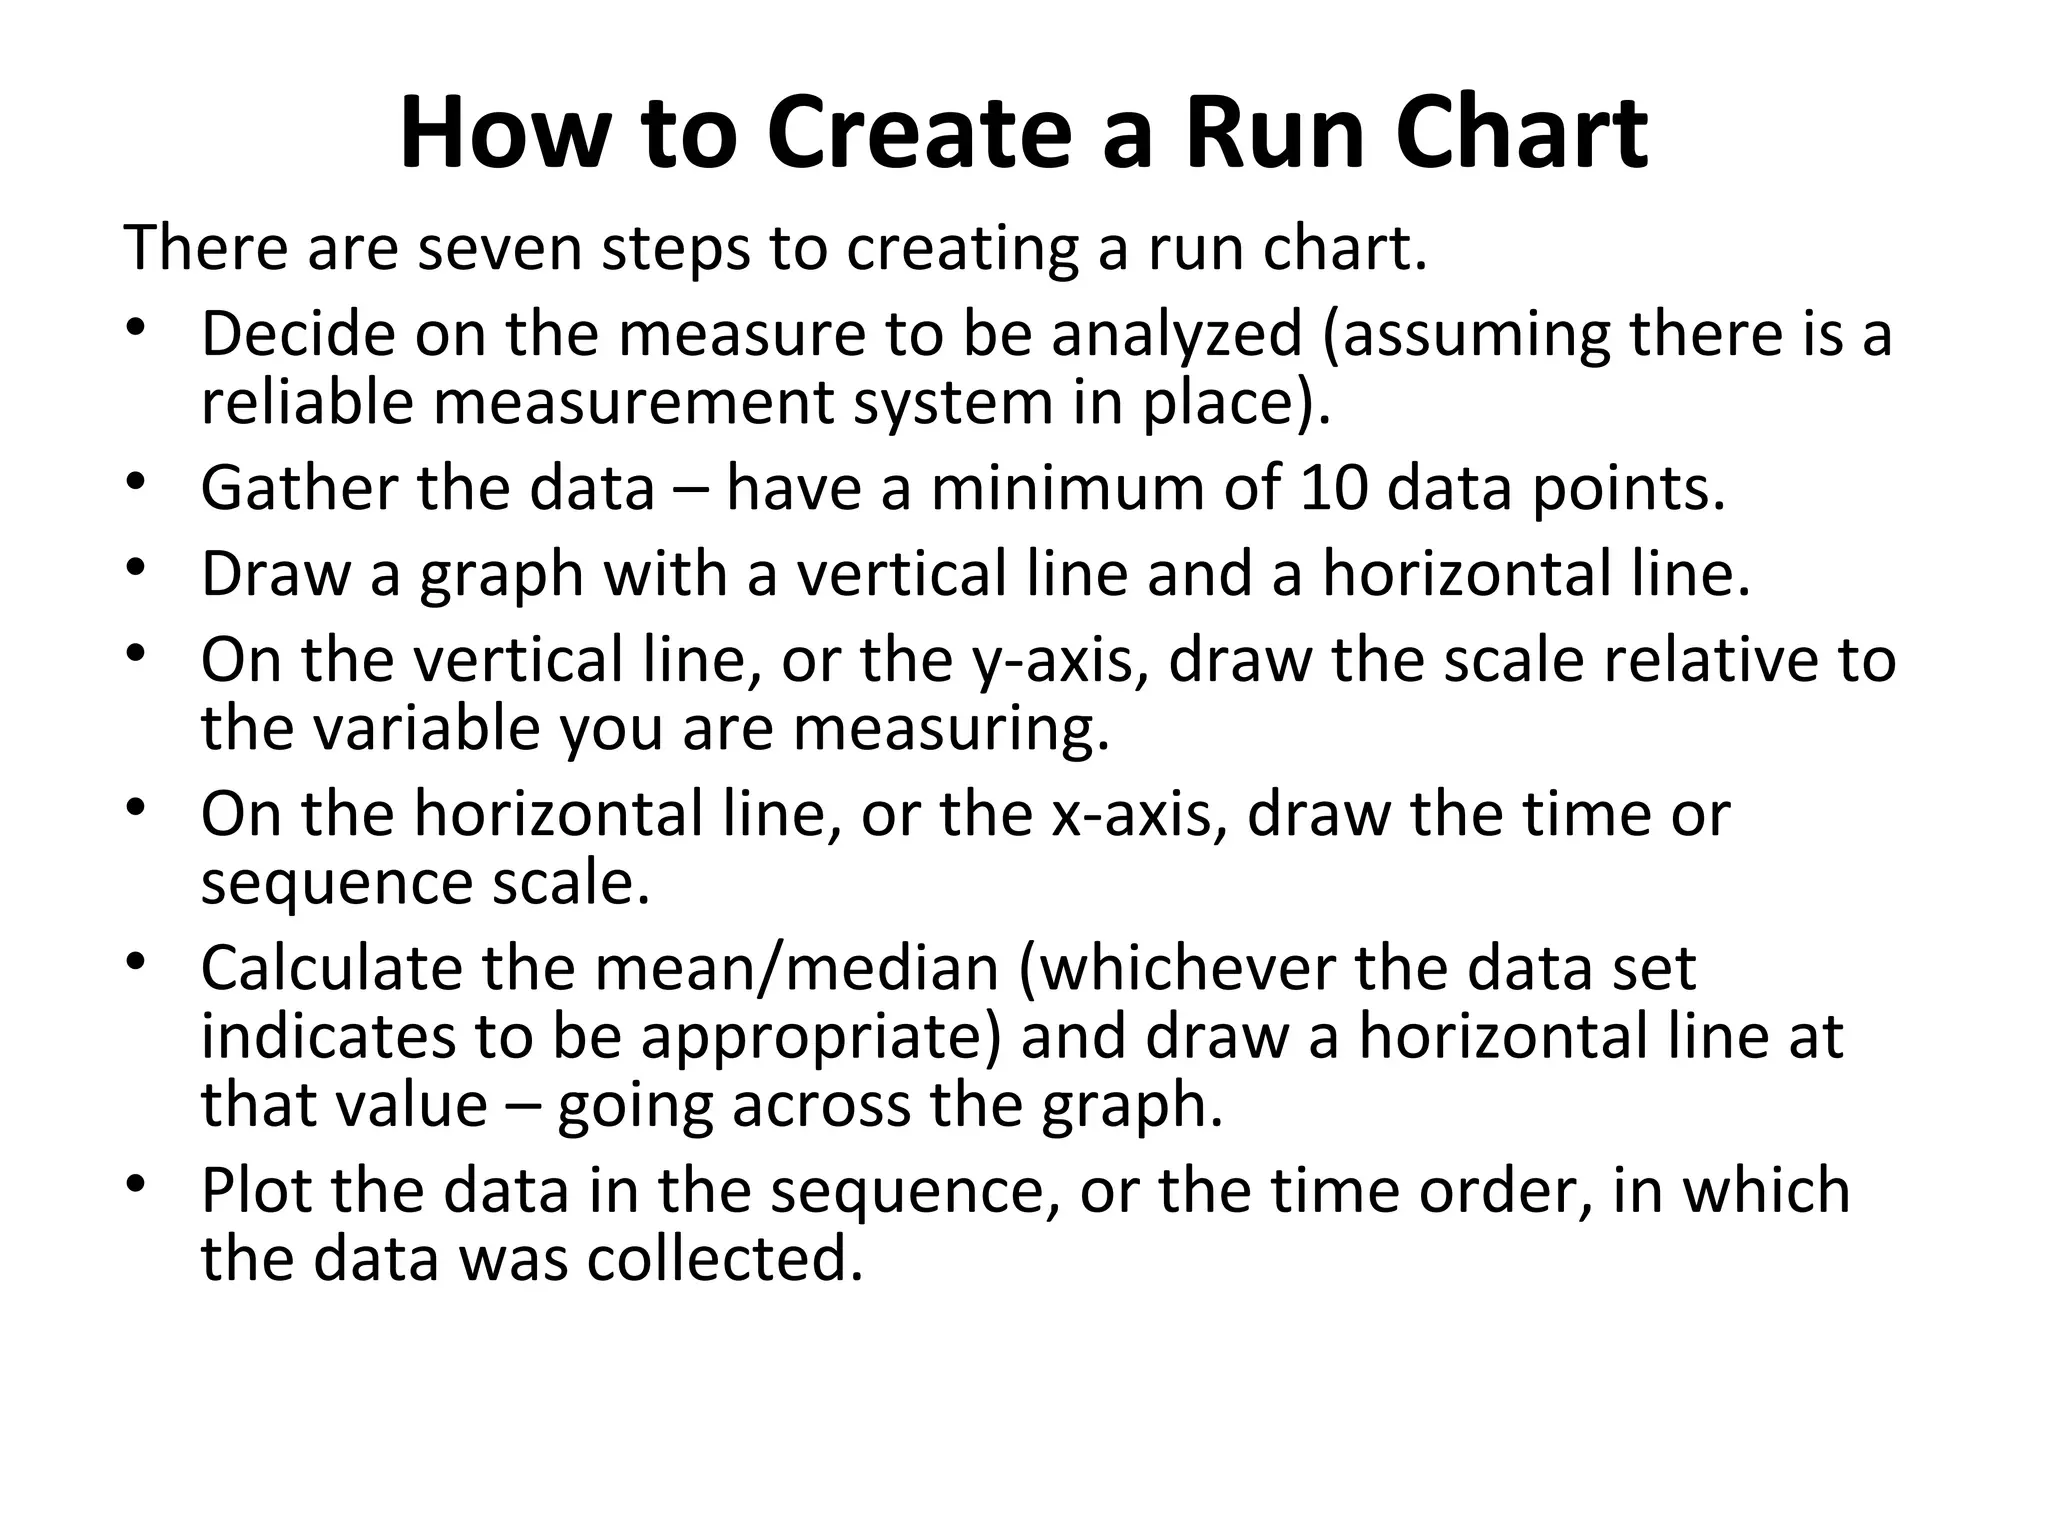
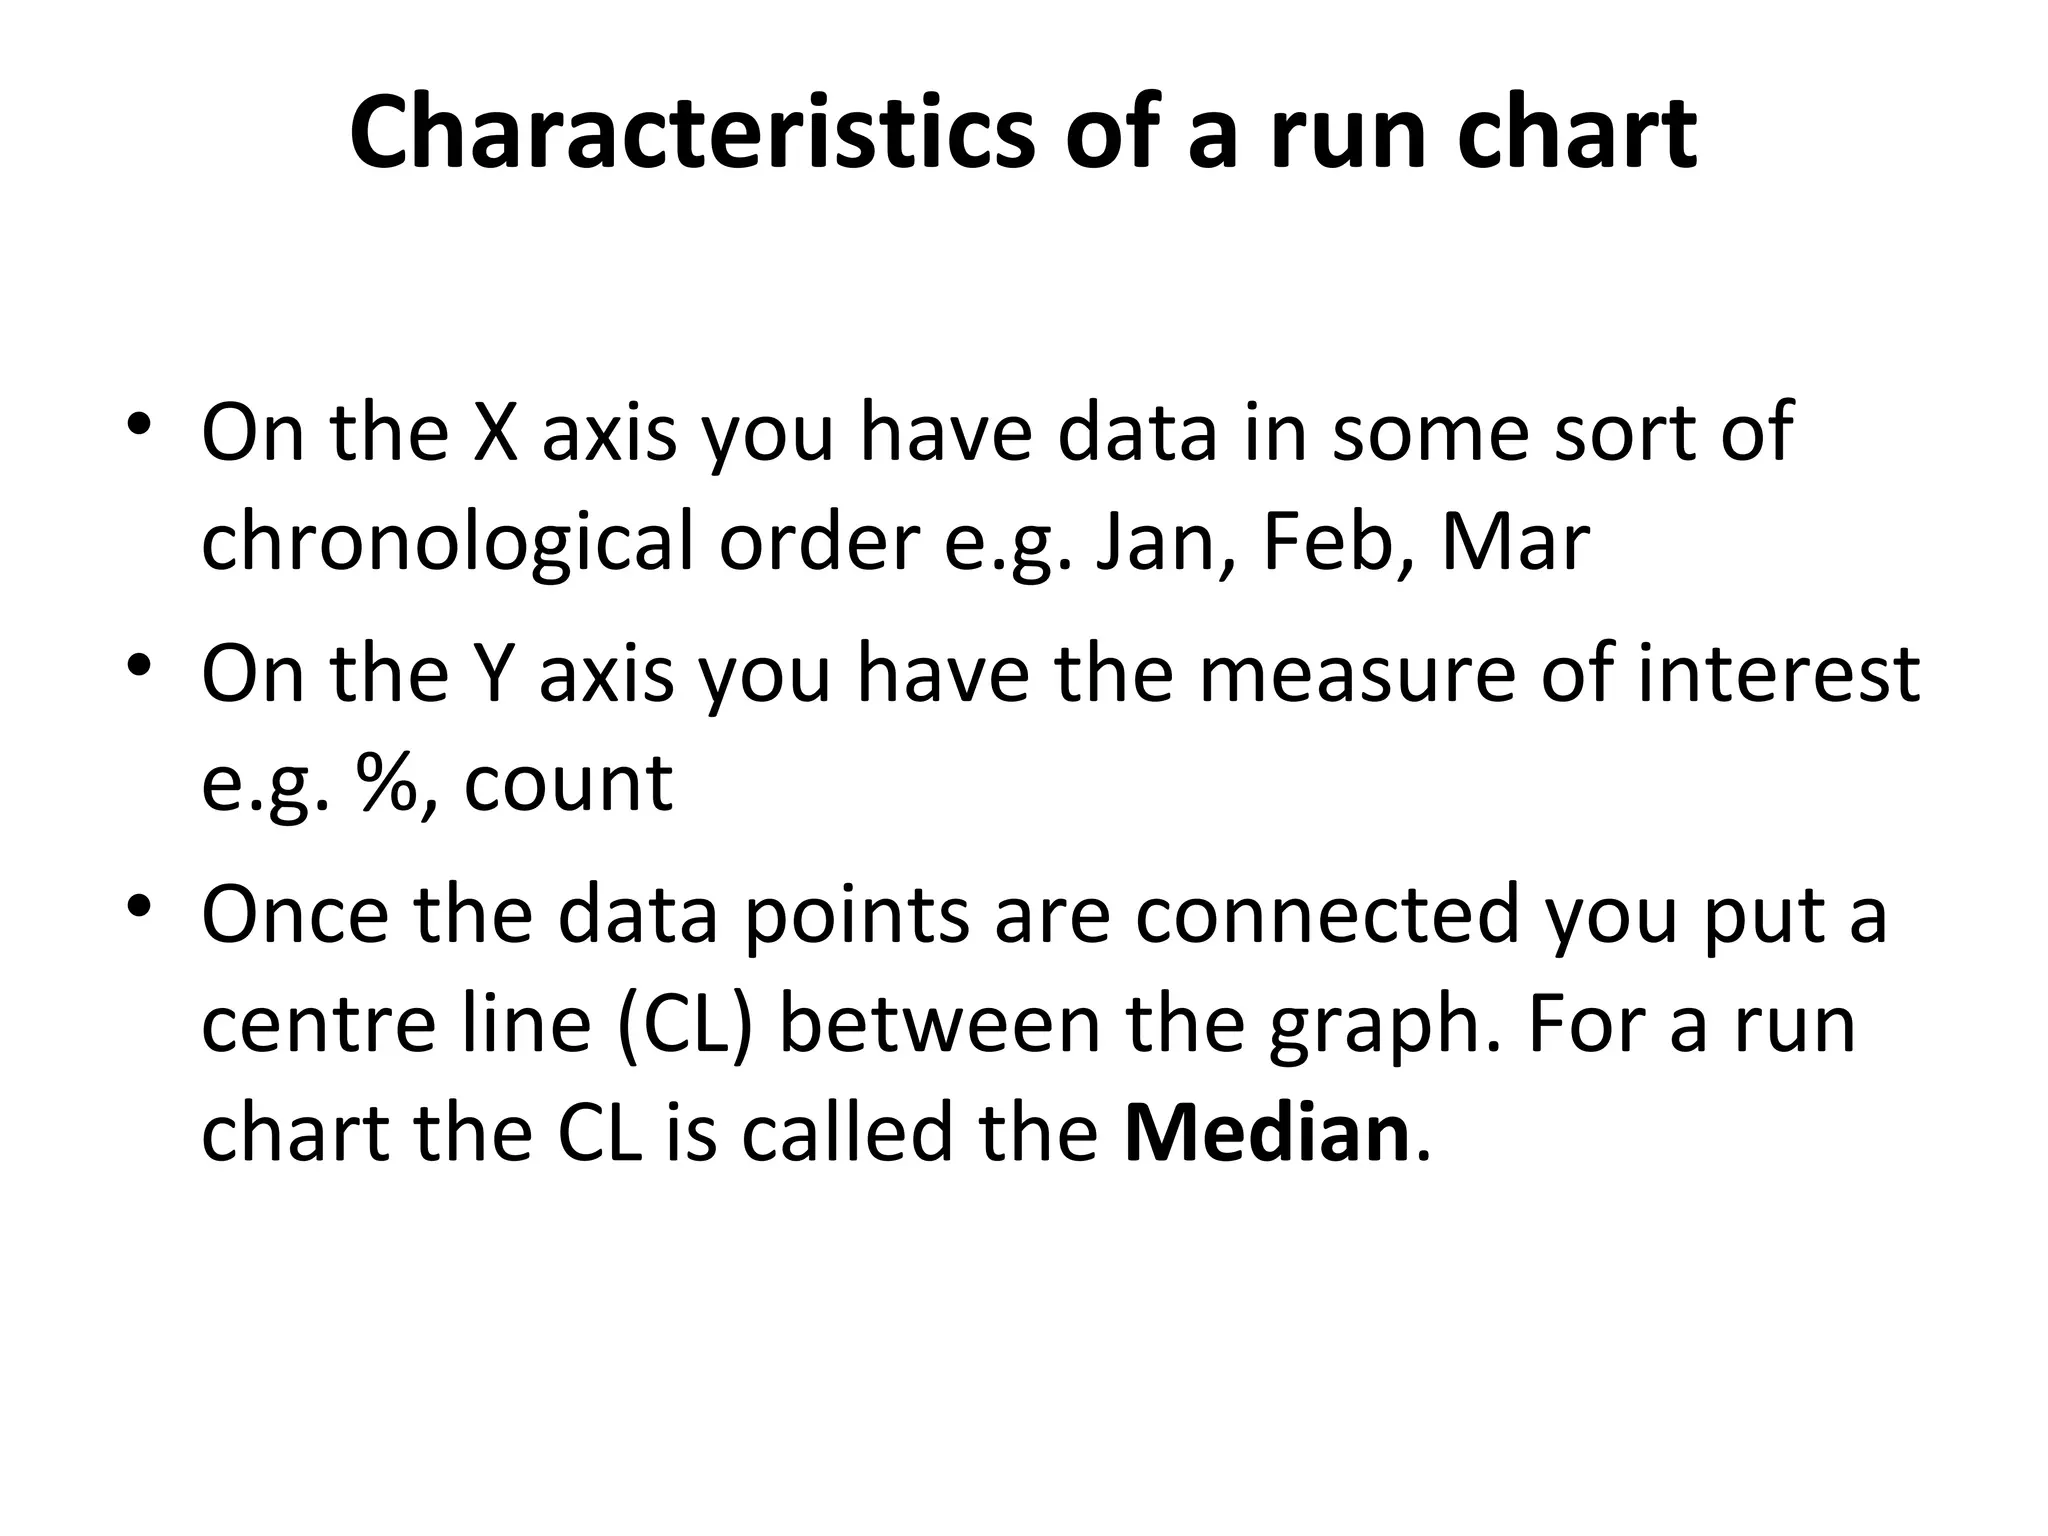
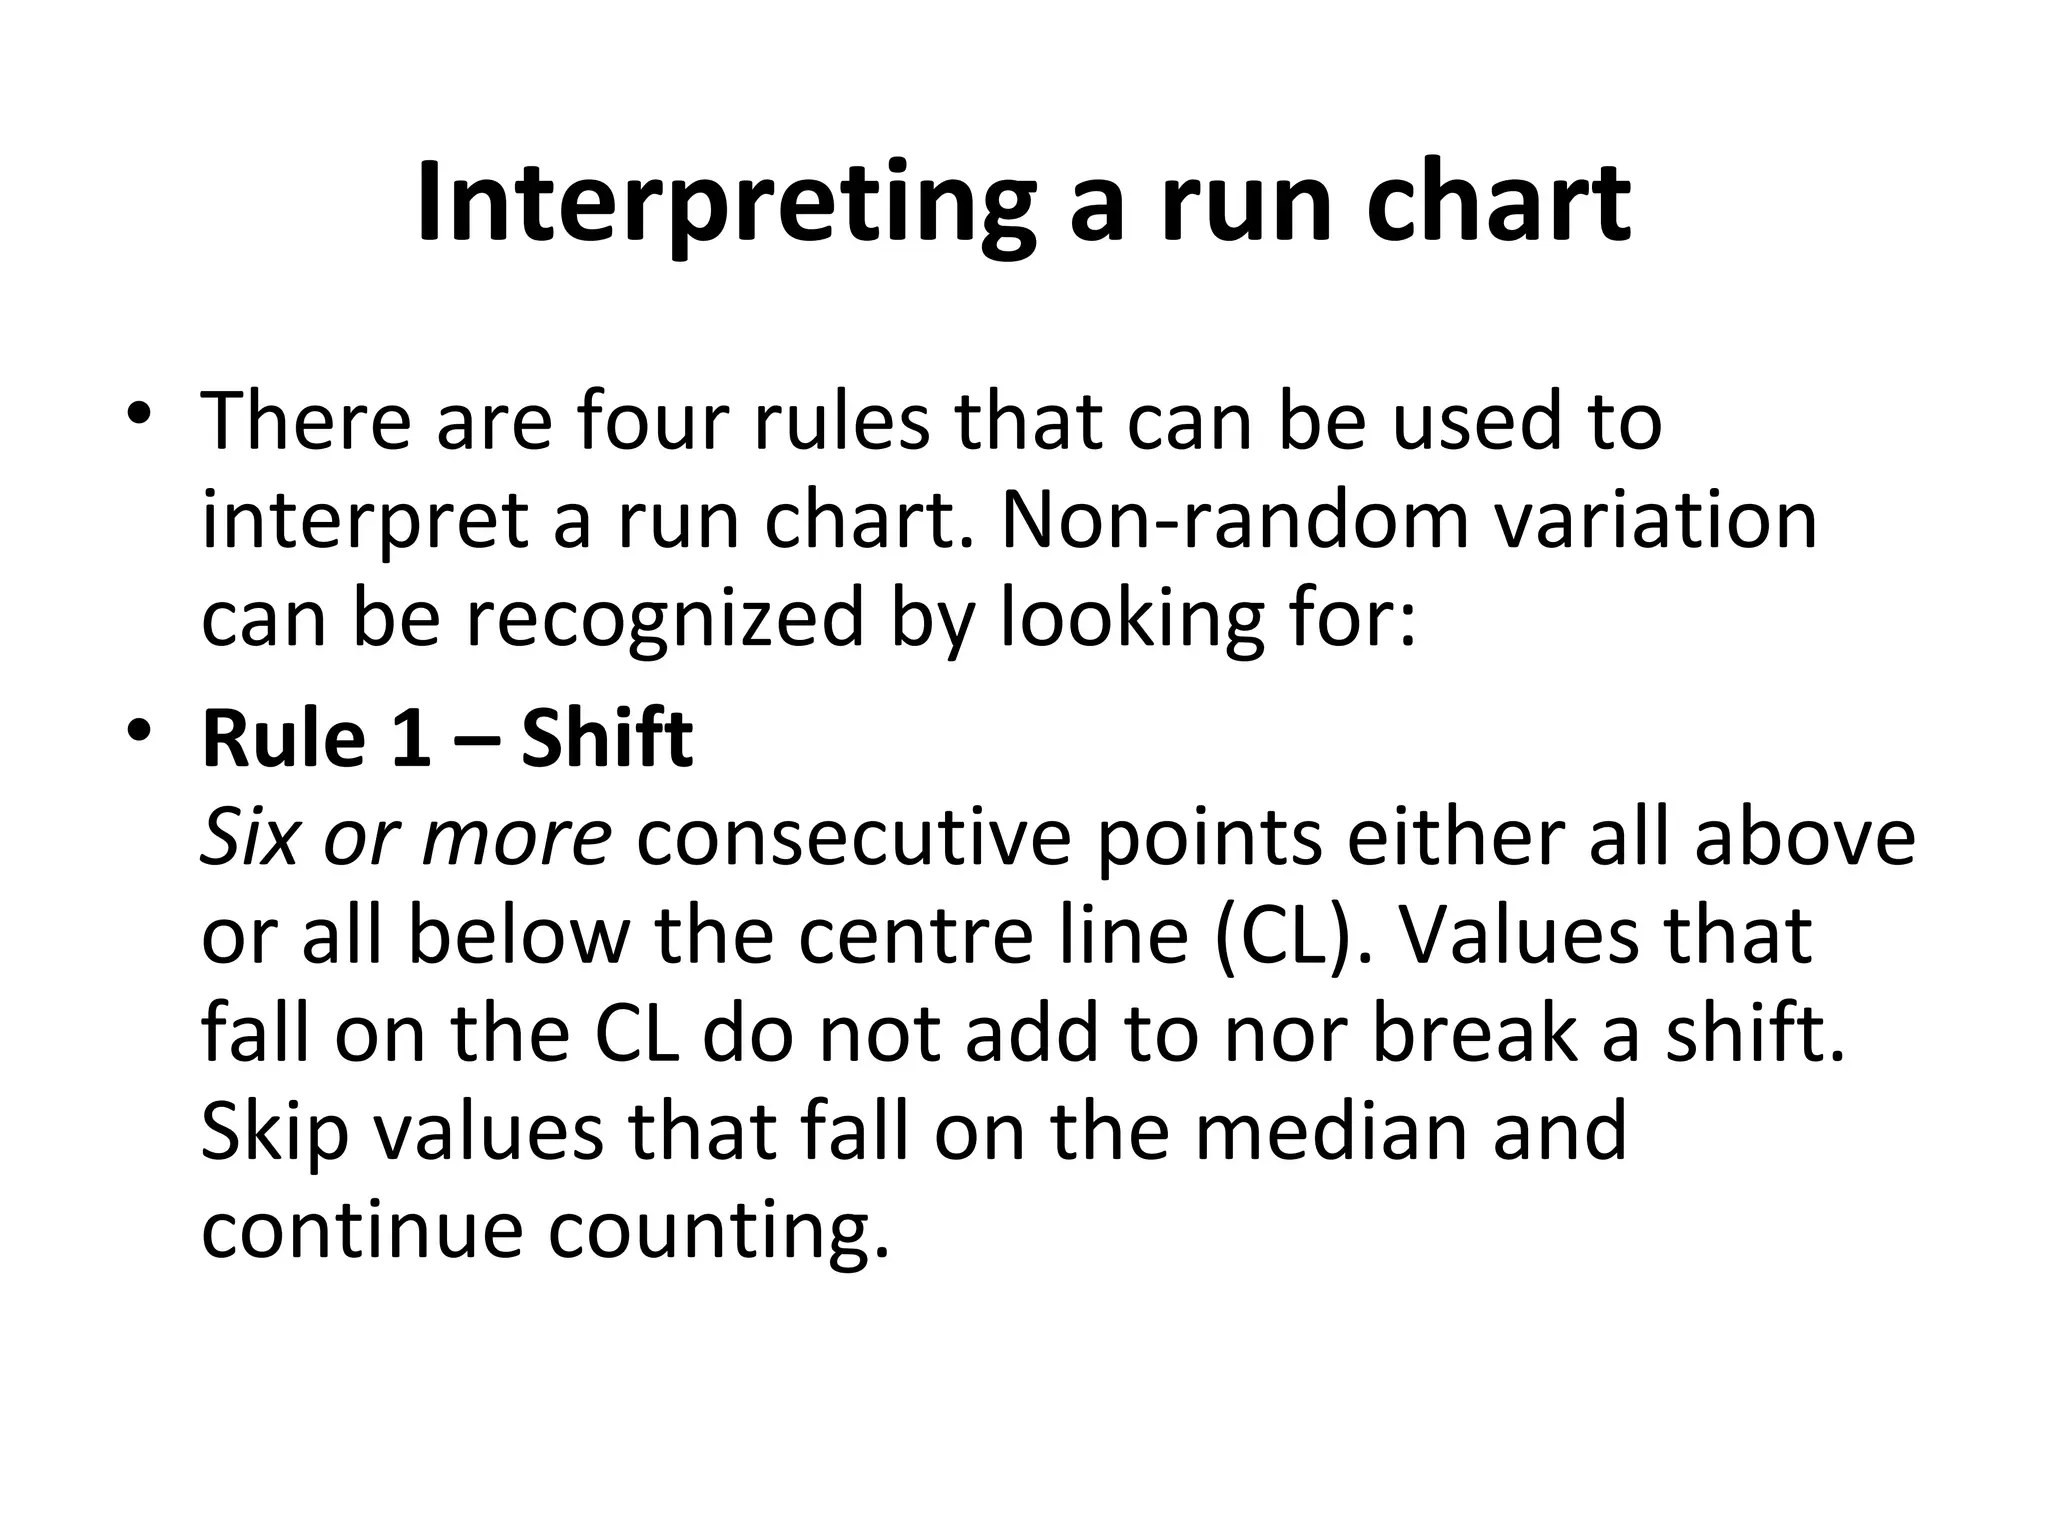

The document discusses control charts and run charts. Control charts were first developed by Walter Shewhart in 1924 to monitor process stability and control. They distinguish between common cause and special cause variation. Run charts plot process data over time to detect trends or shifts. They have seven steps: select a measure, gather minimum 10 data points, make a graph with vertical and horizontal axes, plot the data chronologically, and add a center line. Both charts aim to only address non-random variation warranting process improvement actions.


![Control Charts[1]](https://cdn.slidesharecdn.com/ss_thumbnails/controlcharts1-1226081330857138-9-thumbnail.jpg?width=640&height=640&fit=bounds)


![7 qc tools training material[1]](https://cdn.slidesharecdn.com/ss_thumbnails/7qctoolstrainingmaterial1-120925054558-phpapp02-thumbnail.jpg?width=640&height=640&fit=bounds)


