
Recommended
Recommended
More Related Content
Similar to Conference website analytics 2016 ytd - aug
Similar to Conference website analytics 2016 ytd - aug (6)
Recently uploaded
Recently uploaded (19)
Conference website analytics 2016 ytd - aug
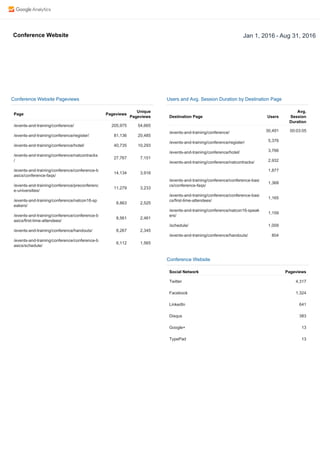
- 1. Jan 1, 2016 Aug 31, 2016Conference Website Conference Website Pageviews Page Pageviews Unique Pageviews 205,975 54,665 81,136 20,485 40,735 10,293 27,767 7,151 14,134 3,916 11,279 3,233 8,863 2,525 8,561 2,461 8,267 2,345 6,112 1,565 Users and Avg. Session Duration by Destination Page Destination Page Users Avg. Session Duration 30,491 00:03:05 5,376 3,766 2,932 /eventsandtraining/conference/ /eventsandtraining/conference/register/ /eventsandtraining/conference/hotel/ /eventsandtraining/conference/natcontracks/ 1,877 /eventsandtraining/conference/conferencebasi cs/conferencefaqs/ 1,368 /eventsandtraining/conference/conferencebasi cs/firsttimeattendees/ 1,165 /eventsandtraining/conference/natcon16speak ers/ 1,159 /schedule/ 1,009 /eventsandtraining/conference/handouts/ 804 Conference Website Social Network Pageviews Twitter 4,317 Facebook 1,324 LinkedIn 641 Disqus 383 Google+ 13 TypePad 13 /eventsandtraining/conference/ /eventsandtraining/conference/register/ /eventsandtraining/conference/hotel/ /eventsandtraining/conference/natcontracks / /eventsandtraining/conference/conferenceb asics/conferencefaqs/ /eventsandtraining/conference/preconferenc euniversities/ /eventsandtraining/conference/natcon16sp eakers/ /eventsandtraining/conference/conferenceb asics/firsttimeattendees/ /eventsandtraining/conference/handouts/ /eventsandtraining/conference/conferenceb asics/schedule/
- 2. 1/1/16 - 8/30/16 # ---------------------------------------- Page Pageviews Unique Pageviews Avg. Time on Page Bounce Rate /conference/ 205,095 54,424 0:00:25 0.26% /conference/register/ 80,736 20,378 0:00:34 0.29% /conference/hotel/ 40,474 10,232 0:00:57 0.22% /conference/natcontracks/ 27,551 7,102 0:00:30 0.00% /conference/conference-basics/conference-faqs/ 14,134 3,916 0:00:31 0.33% /conference/preconference-universities/ 11,207 3,216 0:00:28 0.41% /conference/natcon16-speakers/ 8,863 2,525 0:00:30 0.20% /conference/conference-basics/first-time-attendee 8,486 2,441 0:00:25 0.00% /conference/handouts/ 8,267 2,345 0:01:21 0.22% /conference/conference-basics/continuing-educati 6,013 1,660 0:00:32 0.23% 467,216 123,707 0:00:31 0.26% http://www.thenationalcouncil.org/events-and-training/conference/