Download as PDF, PPTX
![First step towards Model Based Fault Detection
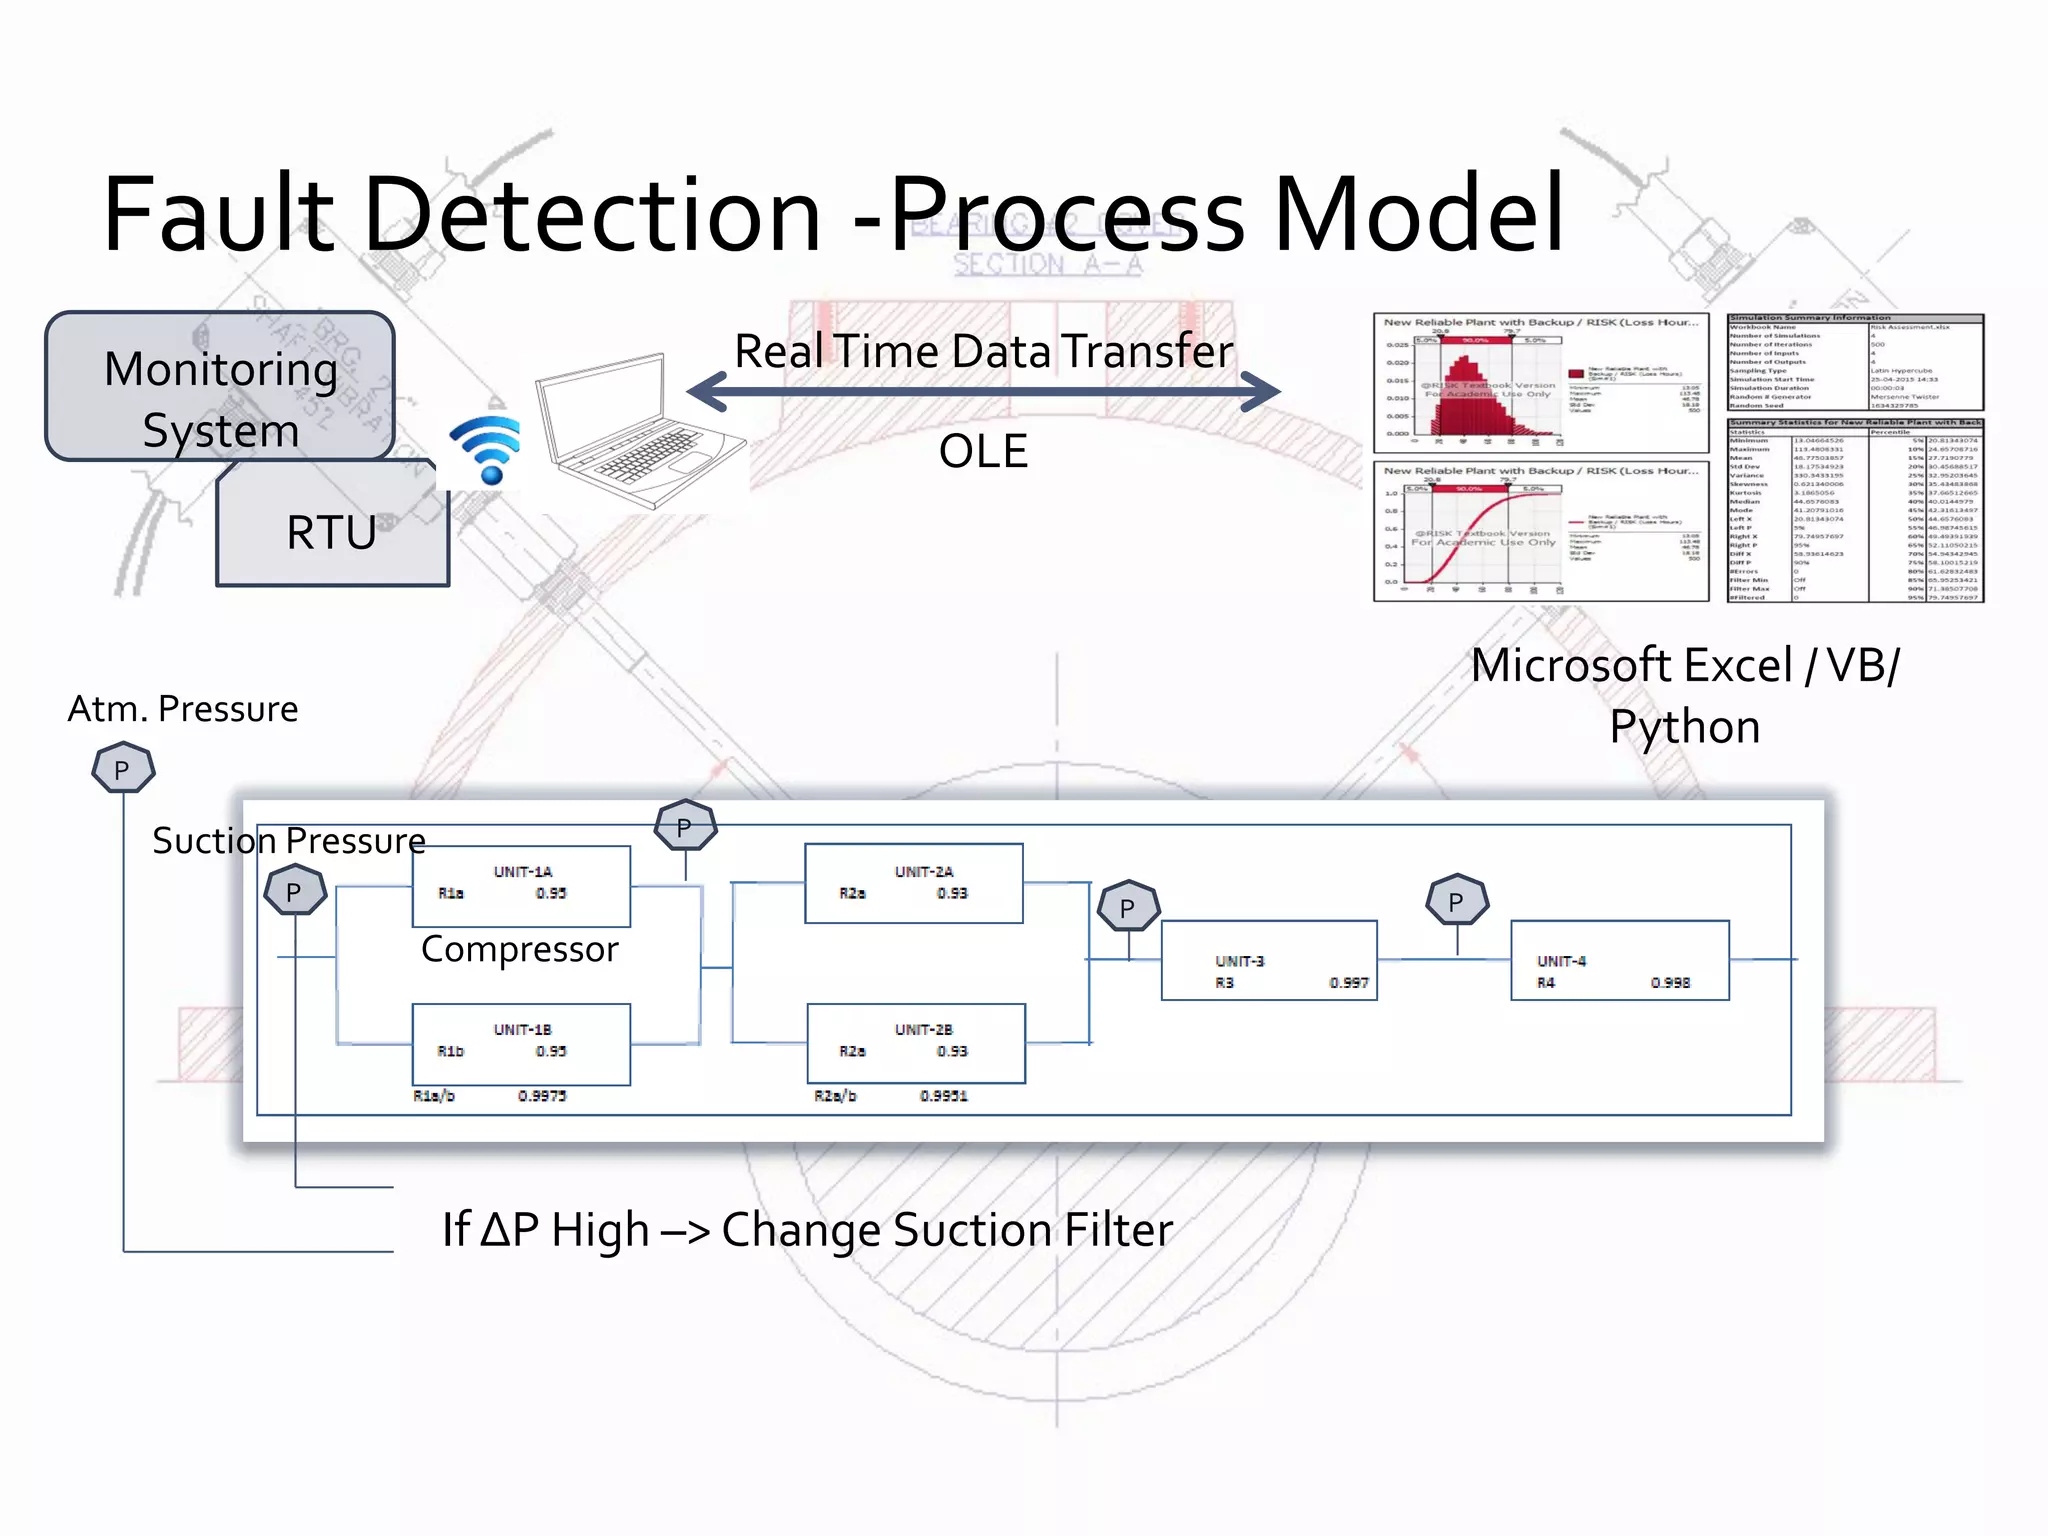
- By checking the plausibility of its indicated values (Rough Process Model)
- Using Microsoft Excel / VB / Python
- For above example:
IF [ΔP > ΔPmax] THEN [CHANGE SUCTION FILTER]
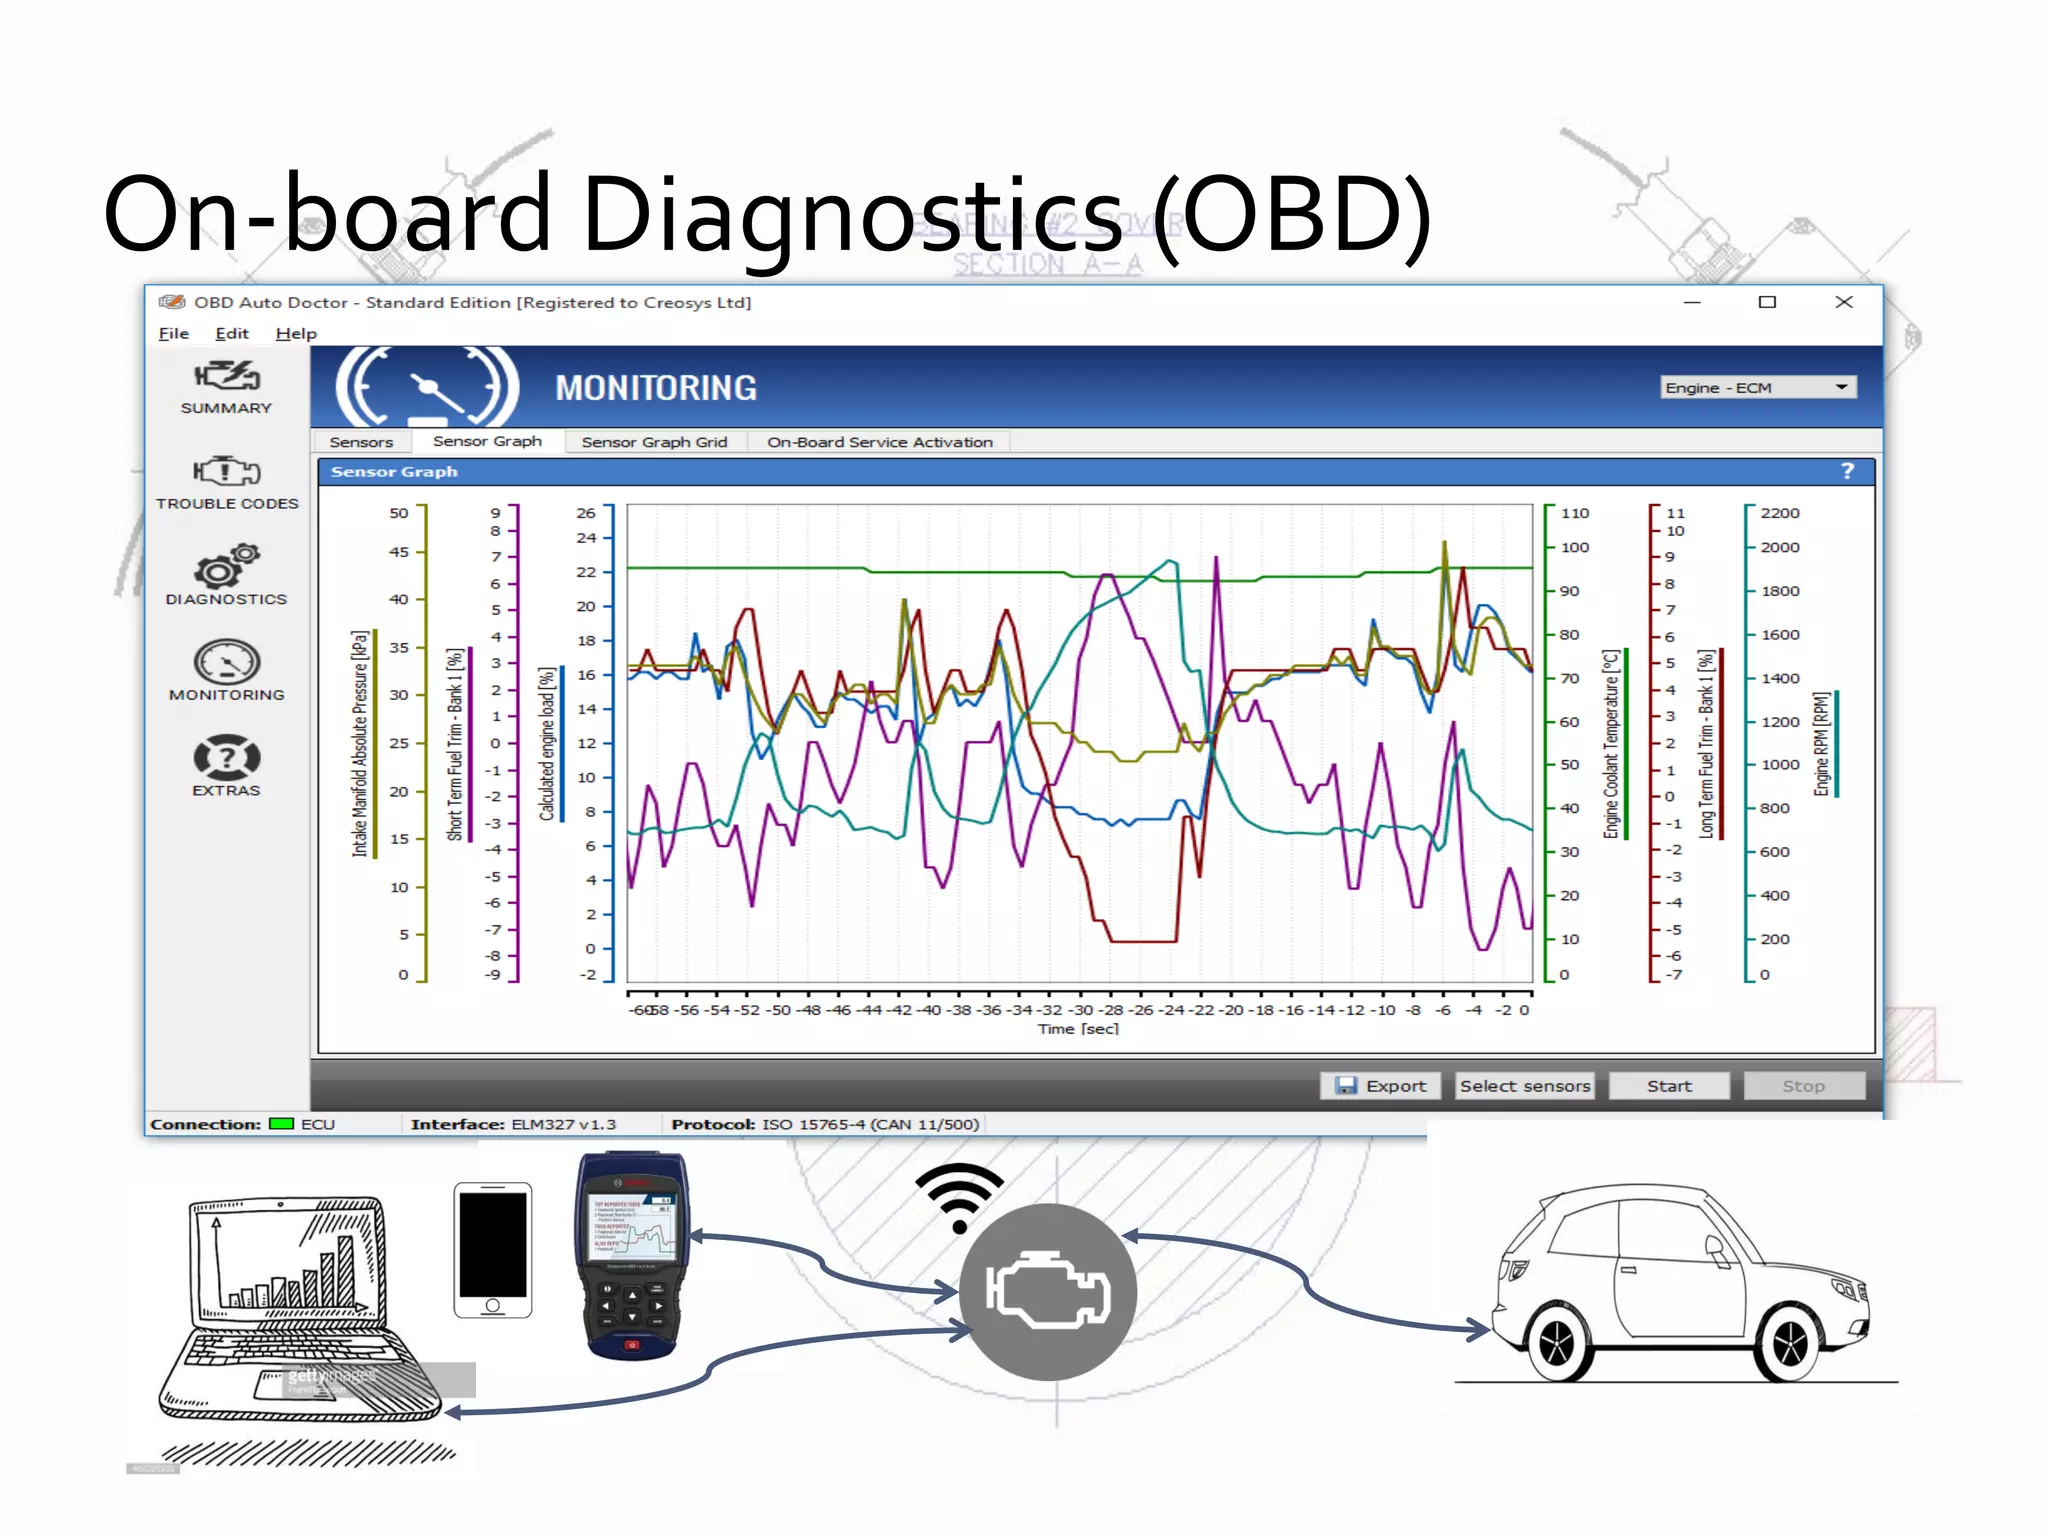
- More examples: Oil Pressure of engine Poil with speed N and C.W Tw
- IF[N < 2000 rpm] AND [Tw < 40 C]THEN [2.5 bar < Poil > 4 bar}
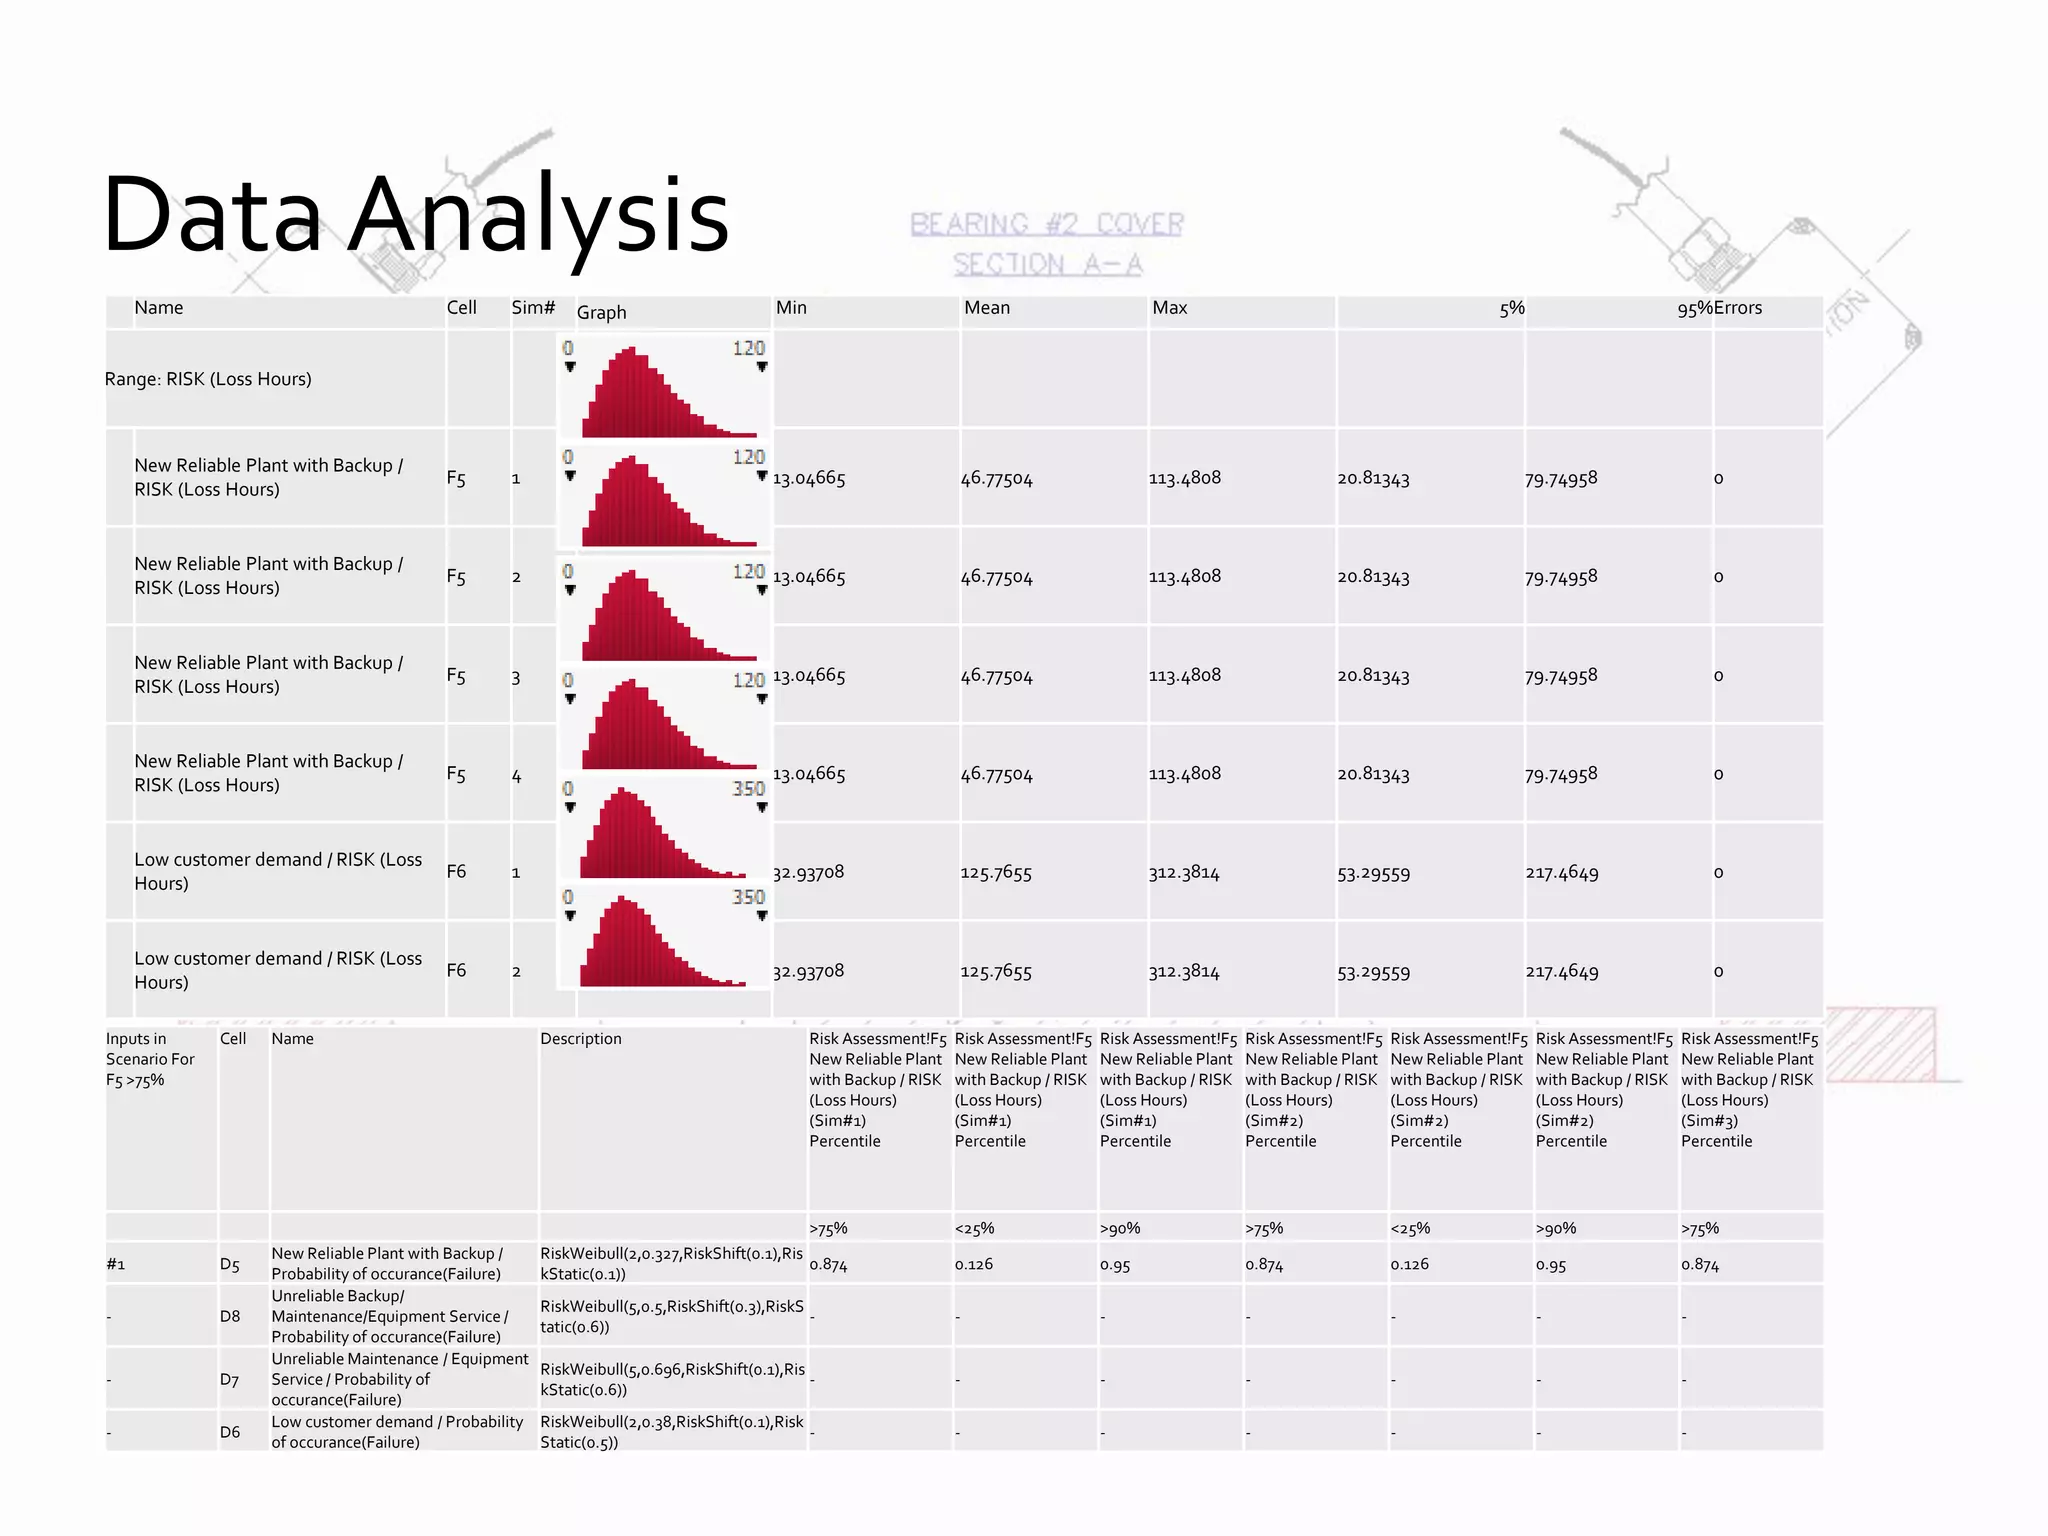
- Trend Analysis using “LOOKUP” function in Excel
- Use VBA macros to “Diagnose Faults”
Fault Diagnosis – Plausibility Checks](https://image.slidesharecdn.com/conditionmonitoring-170521165524/75/Condition-monitoring-9-2048.jpg)


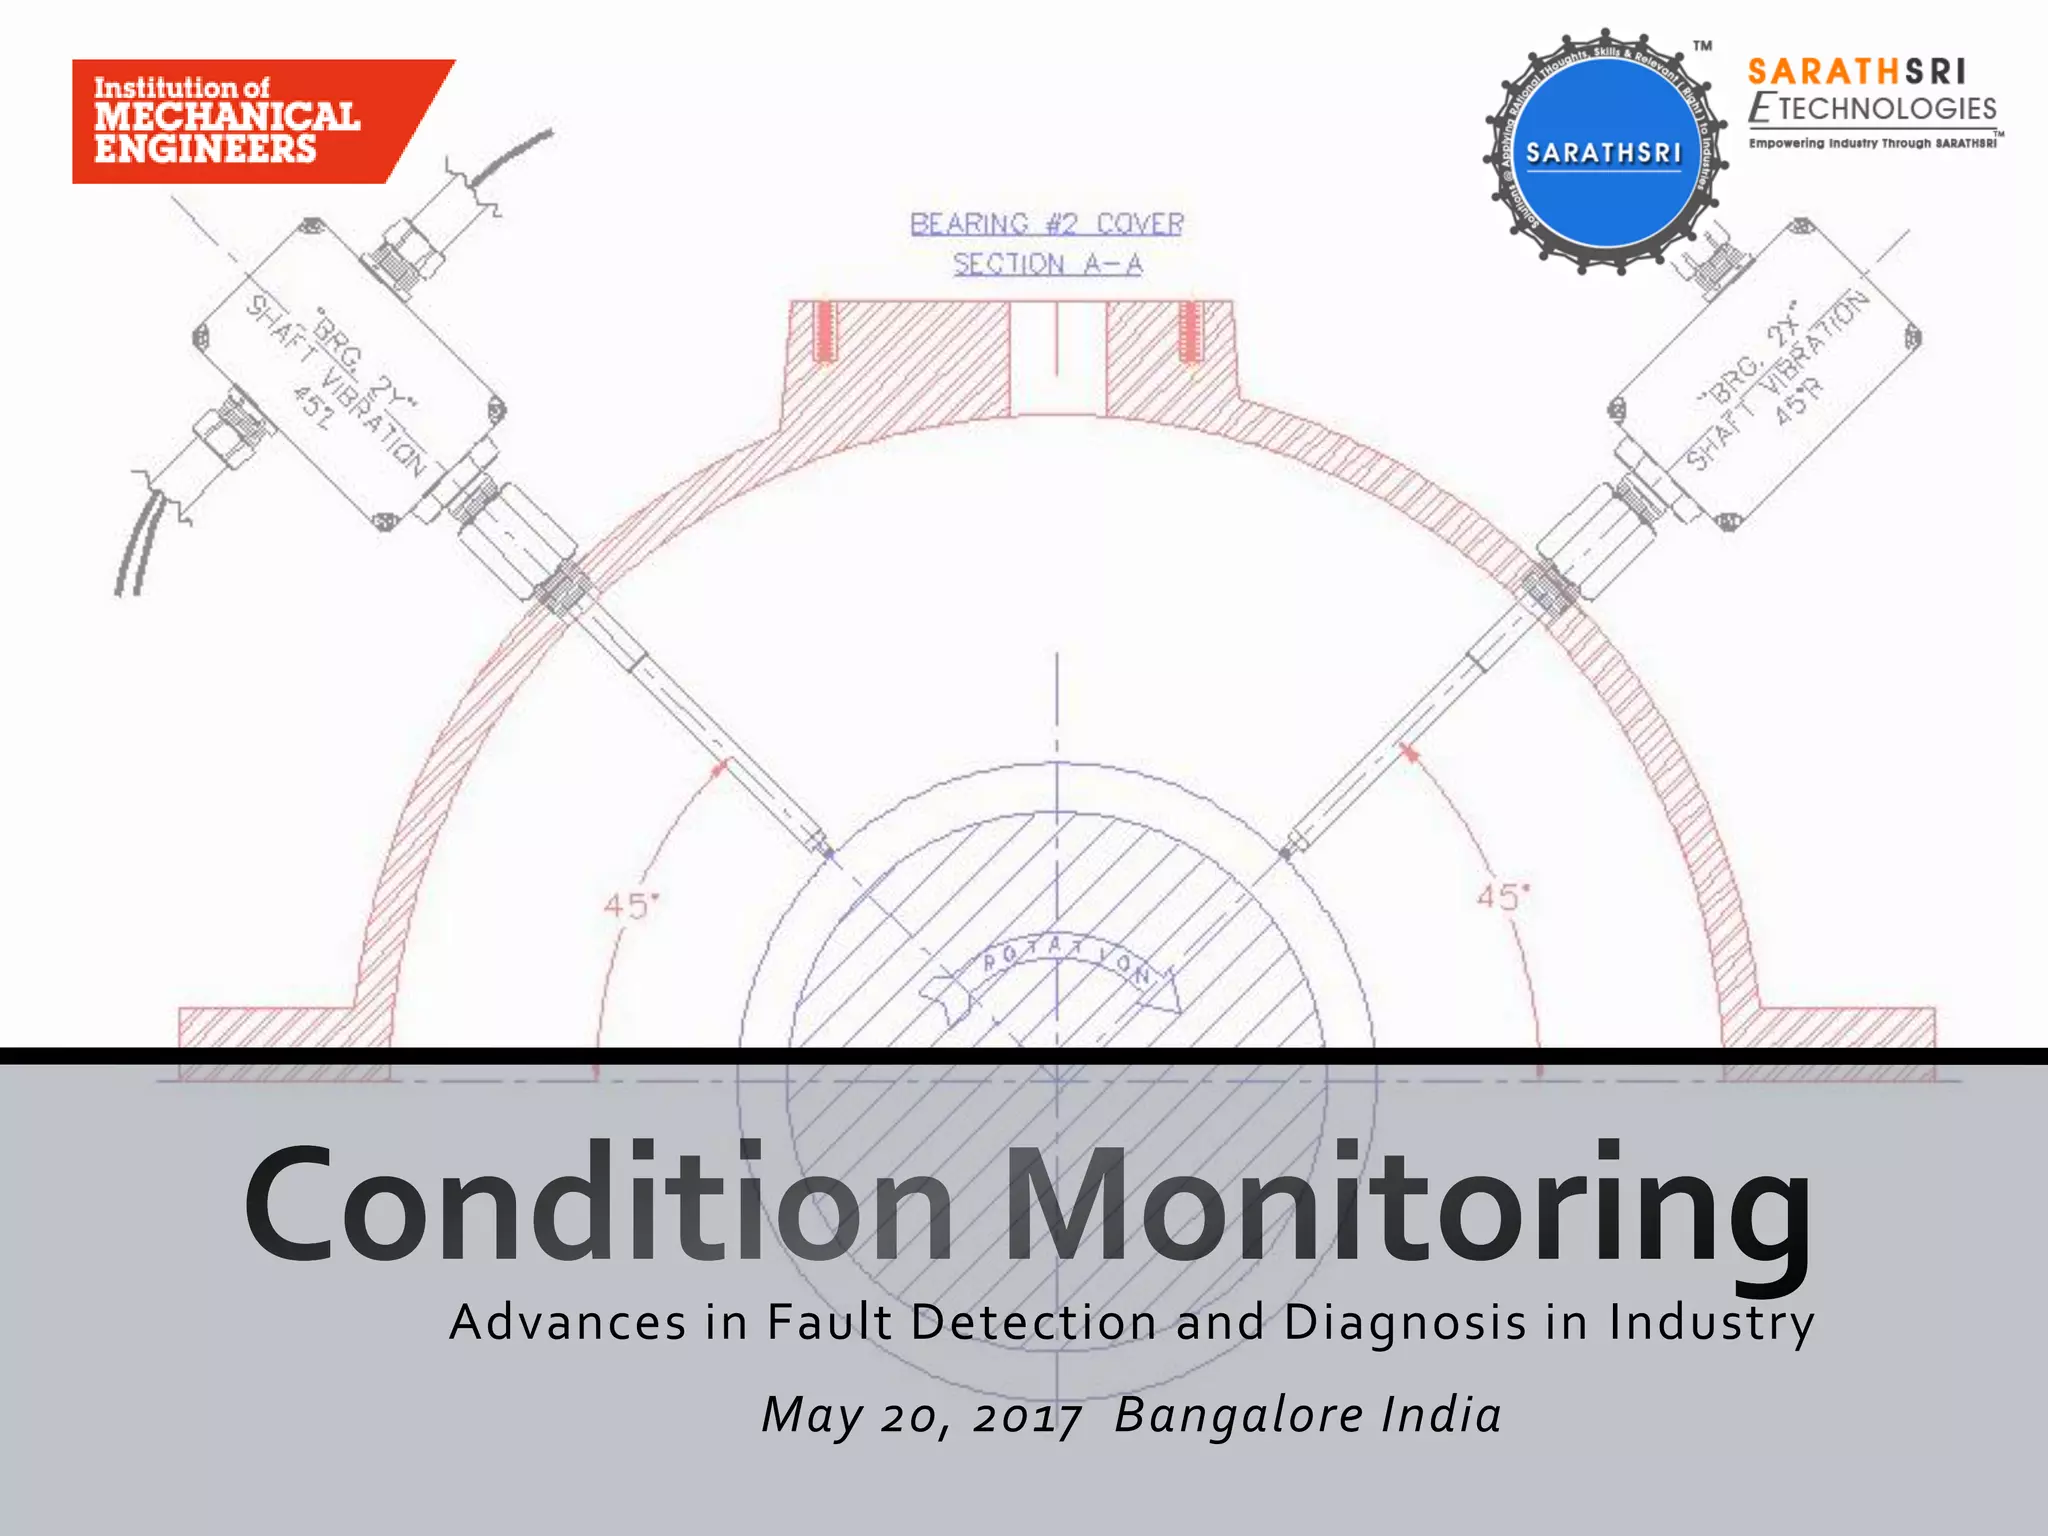
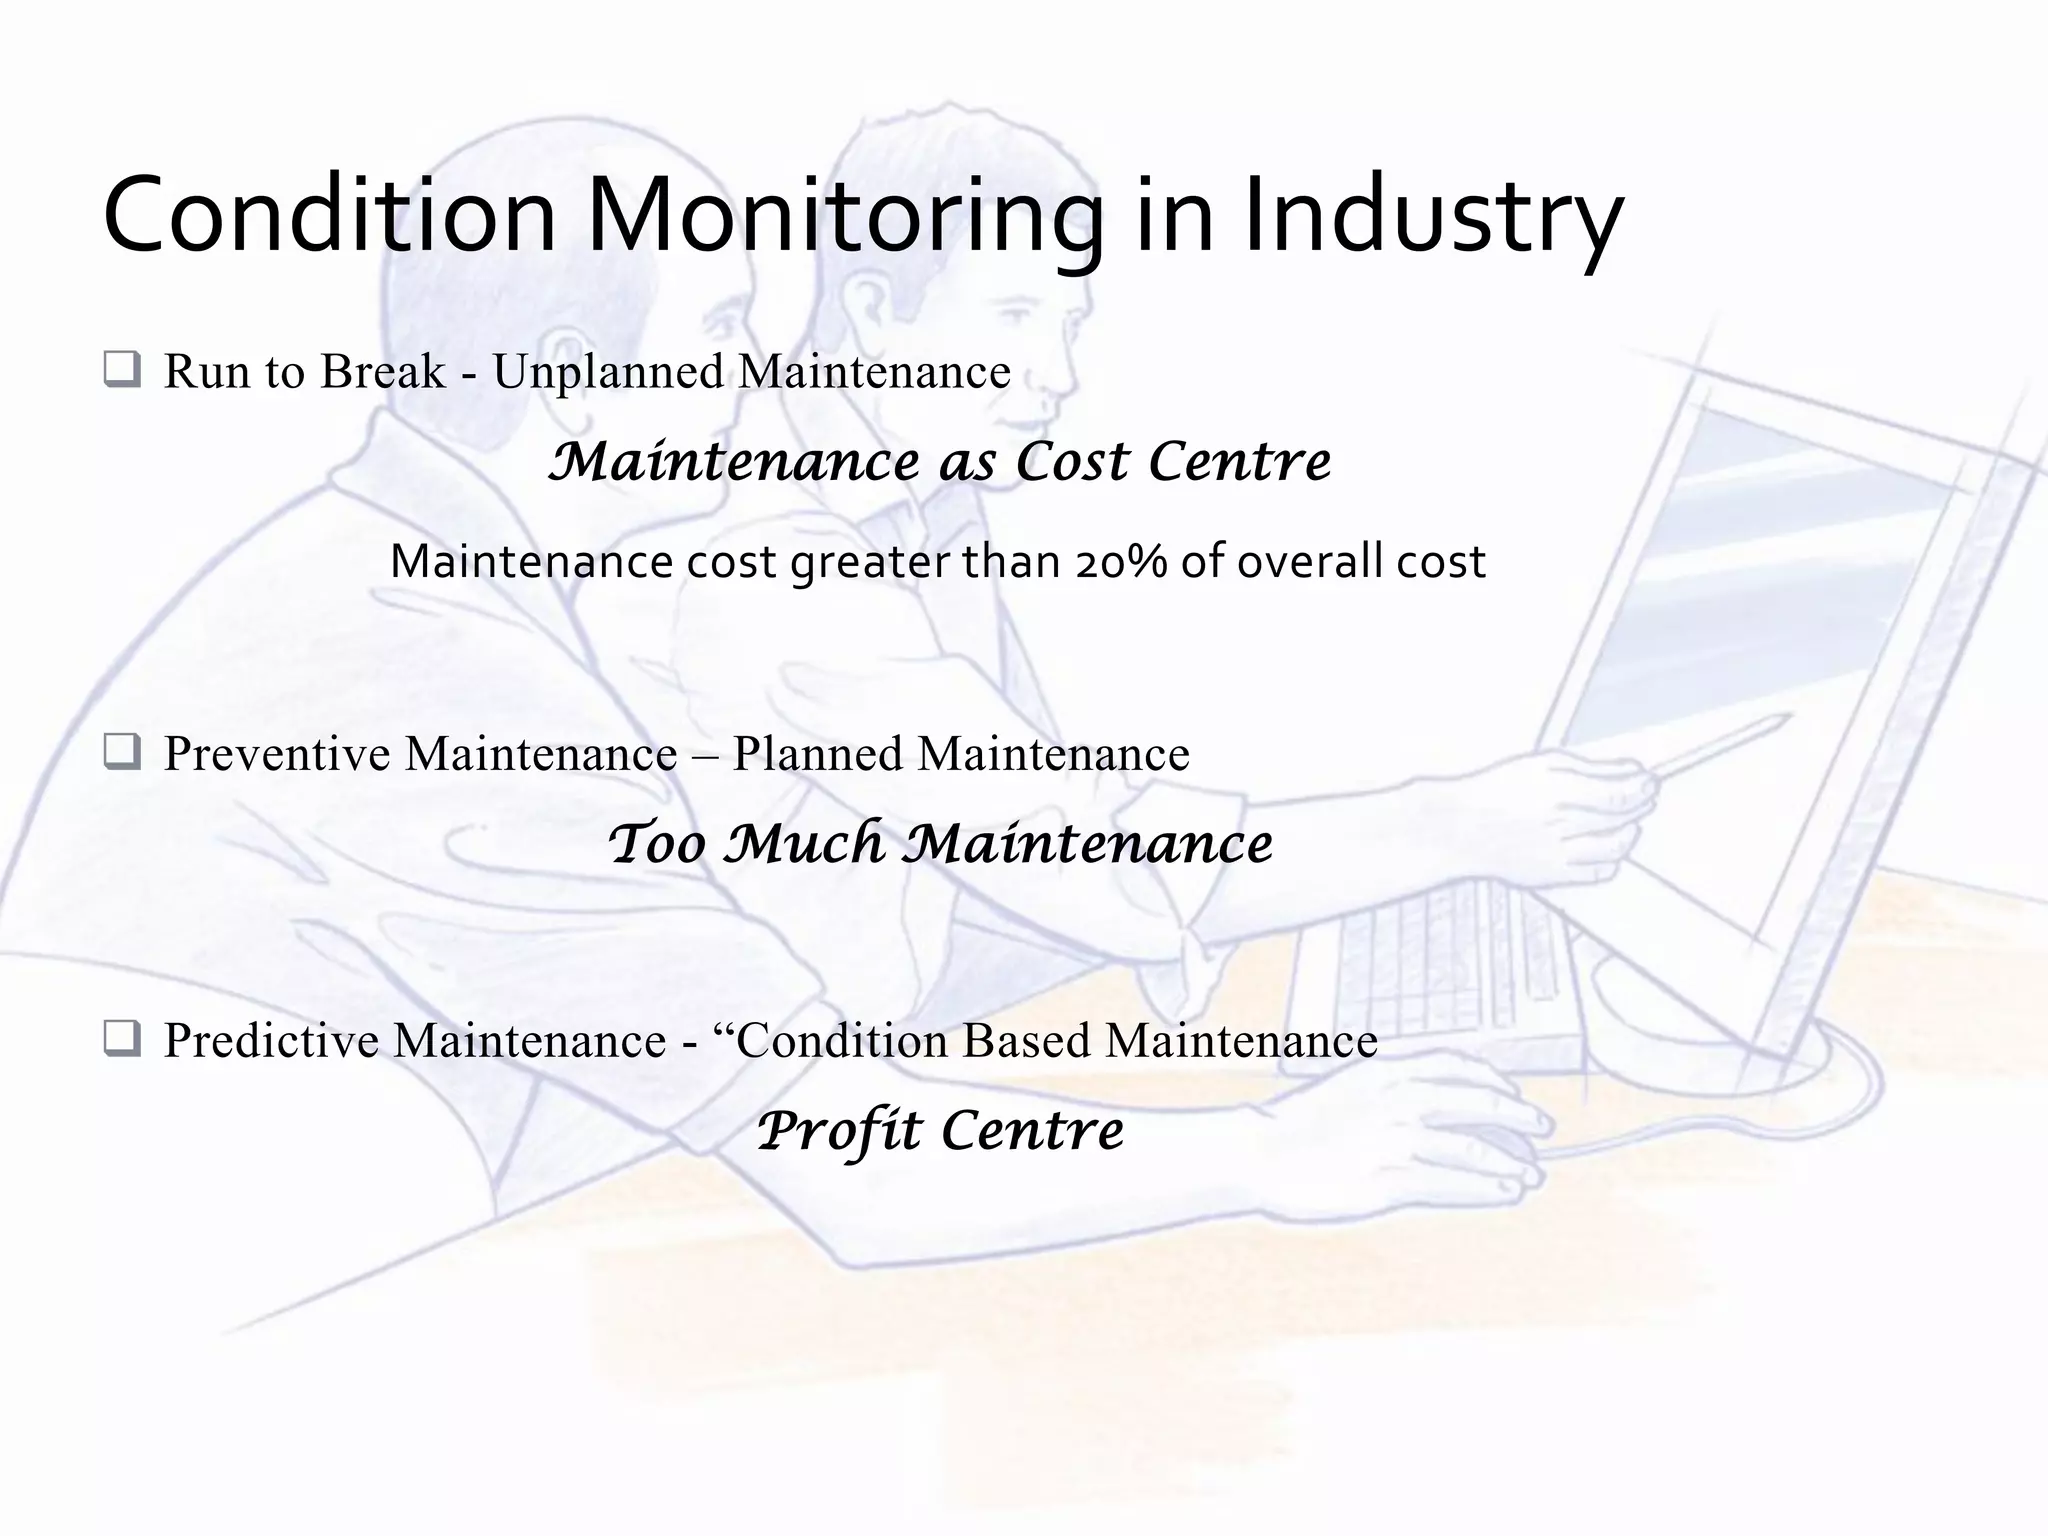
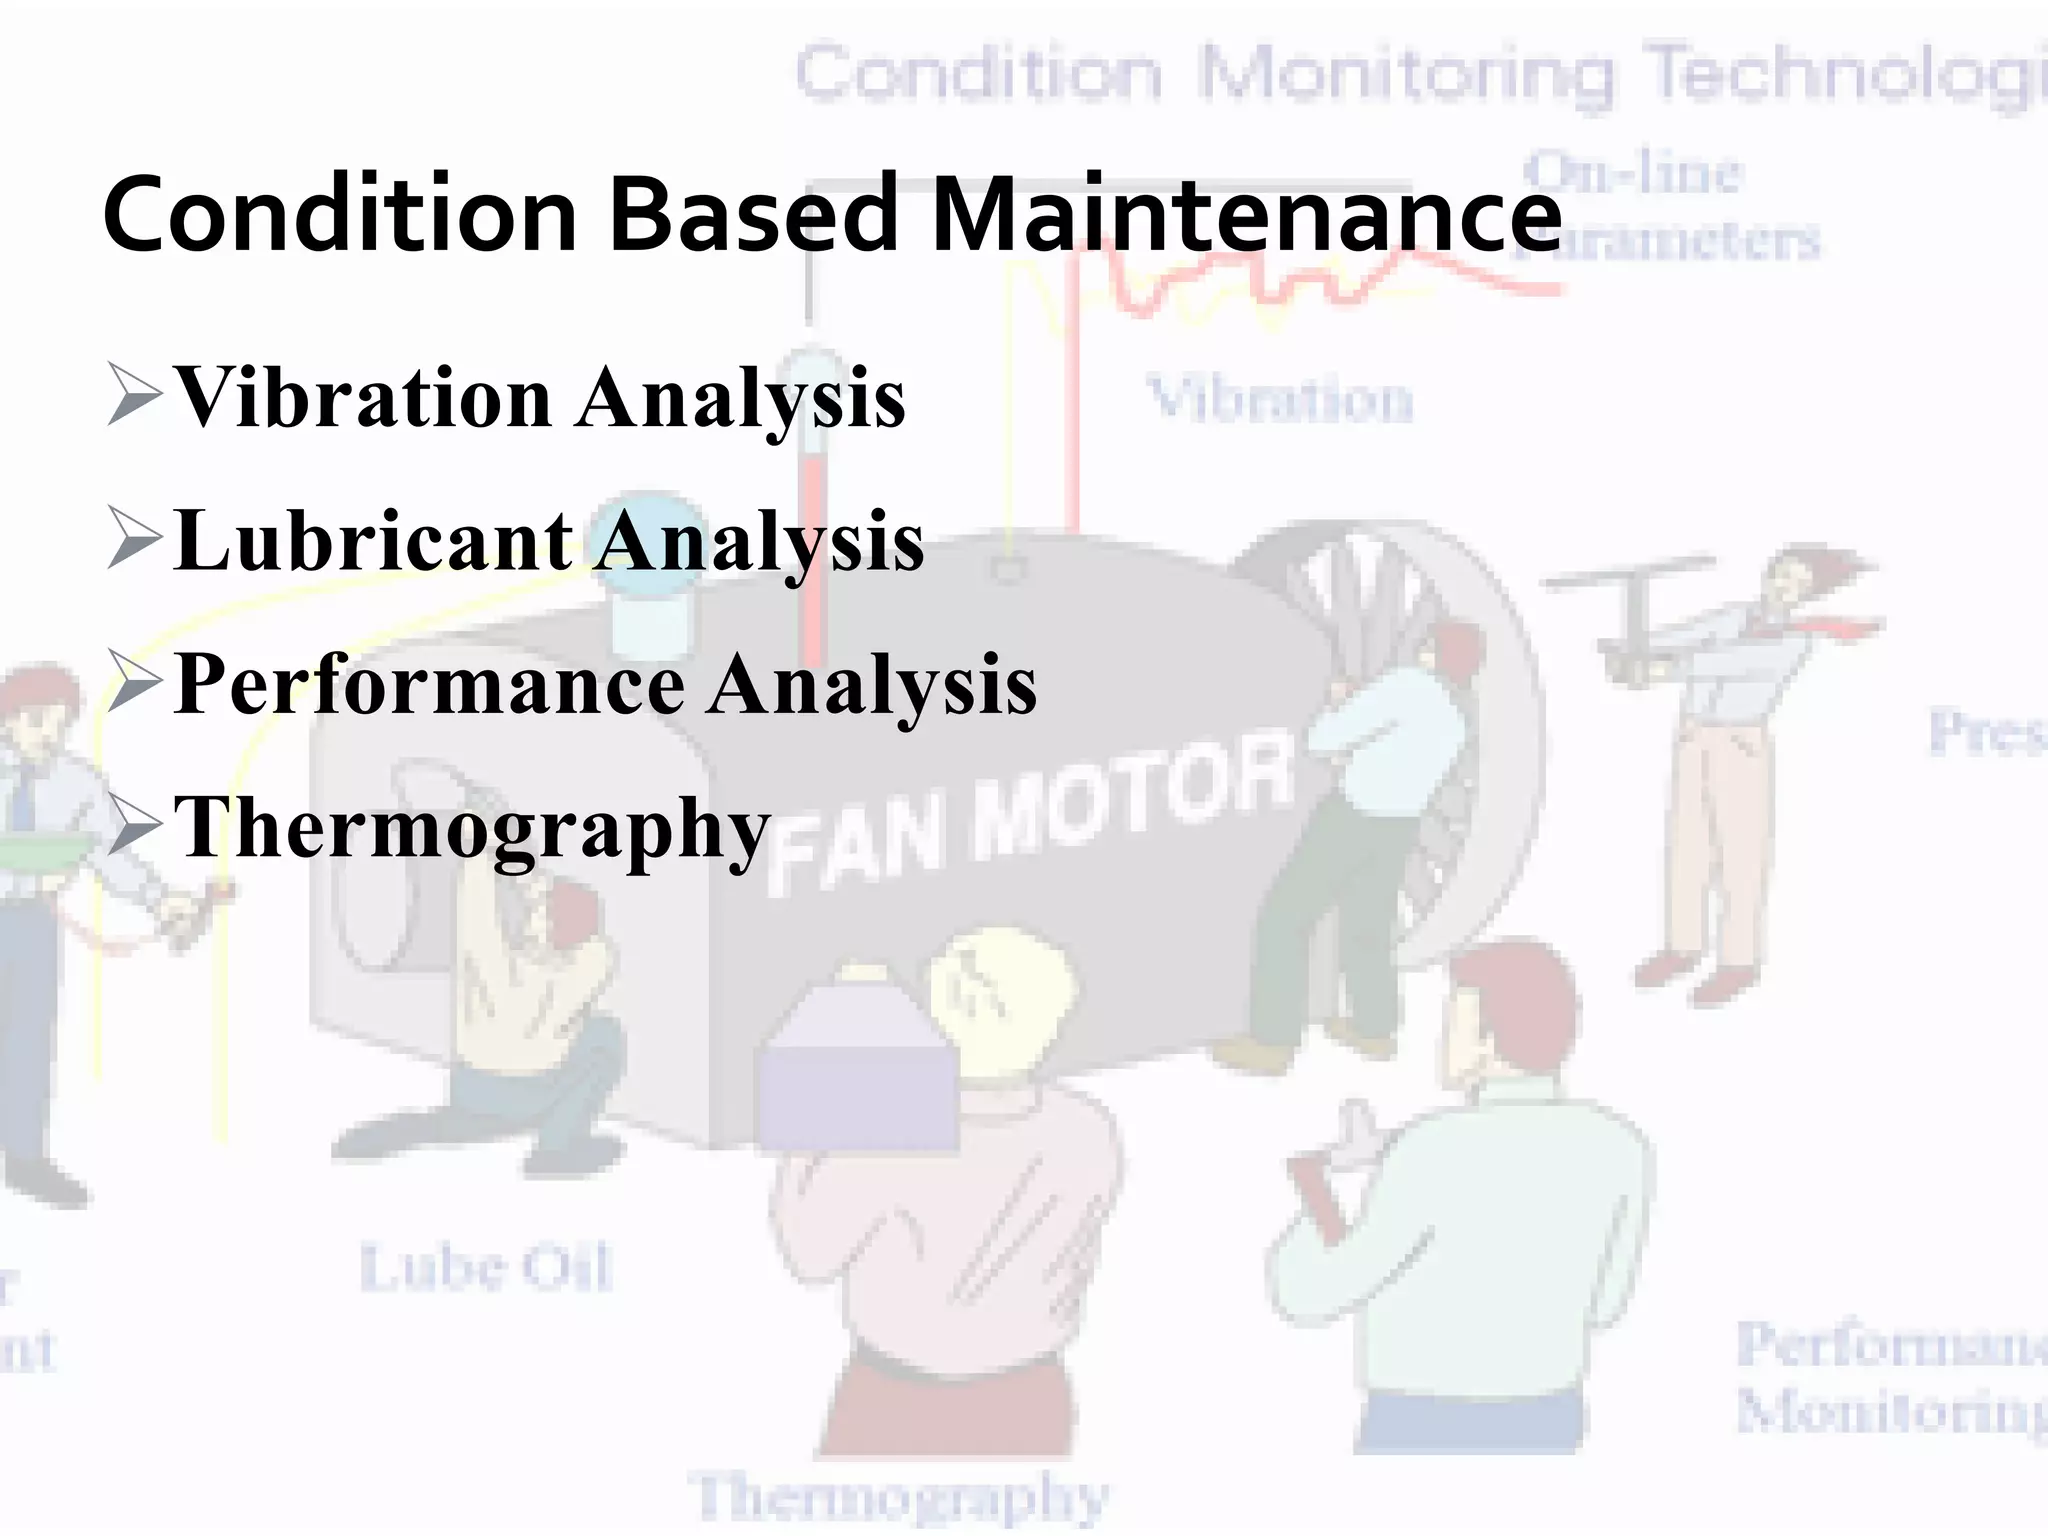
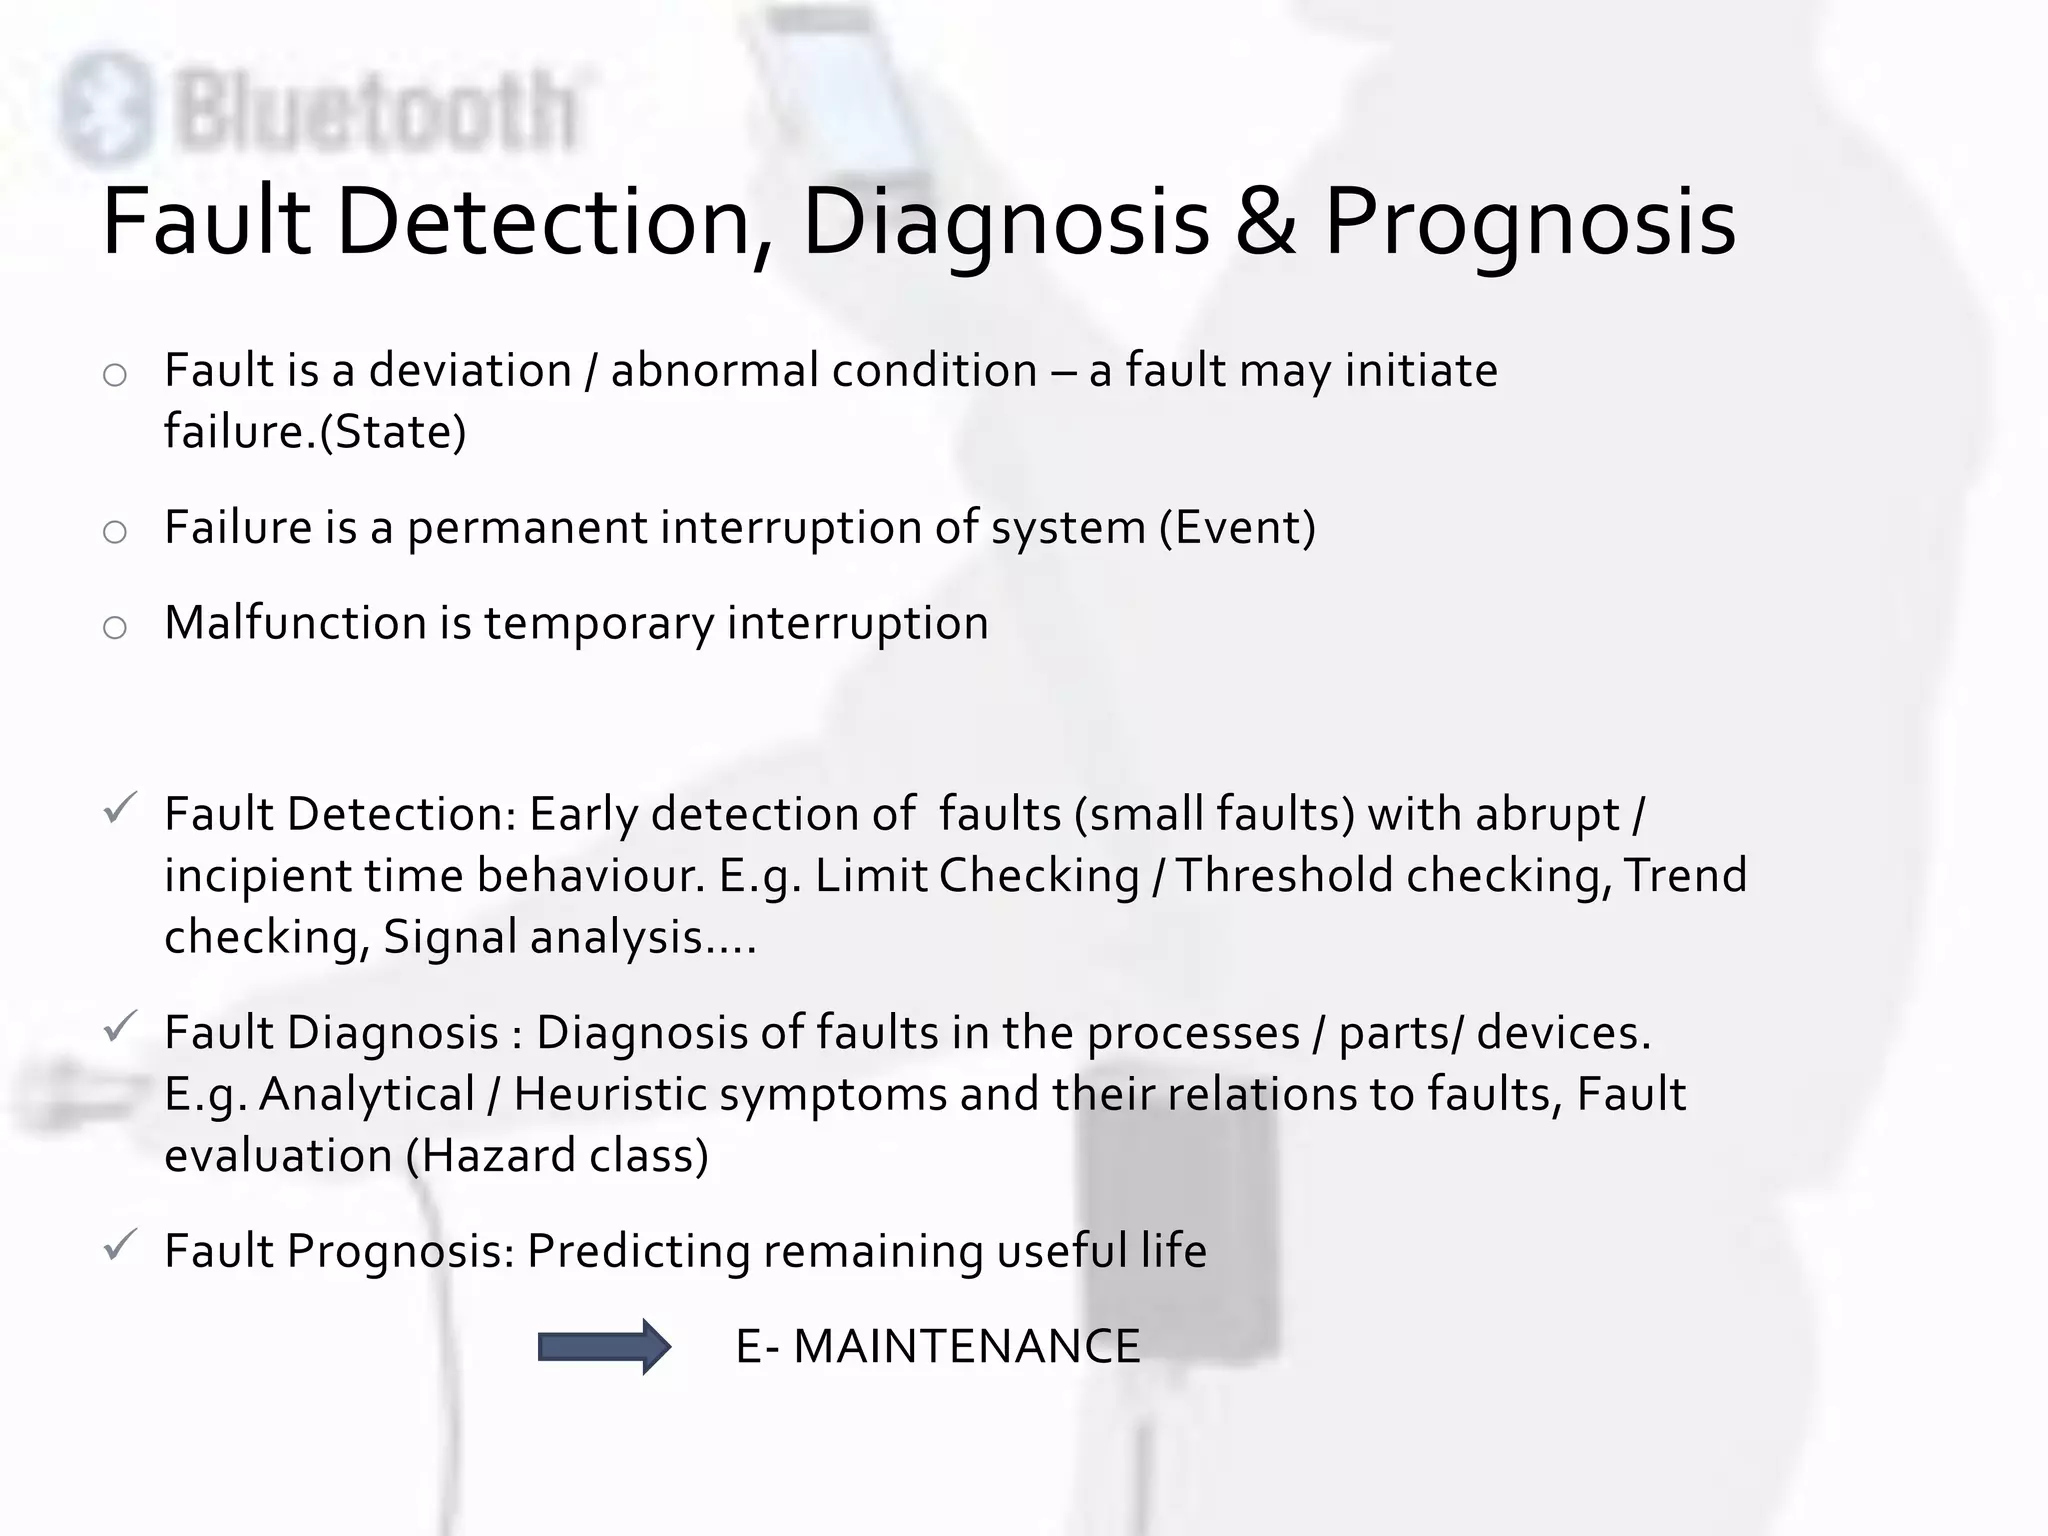
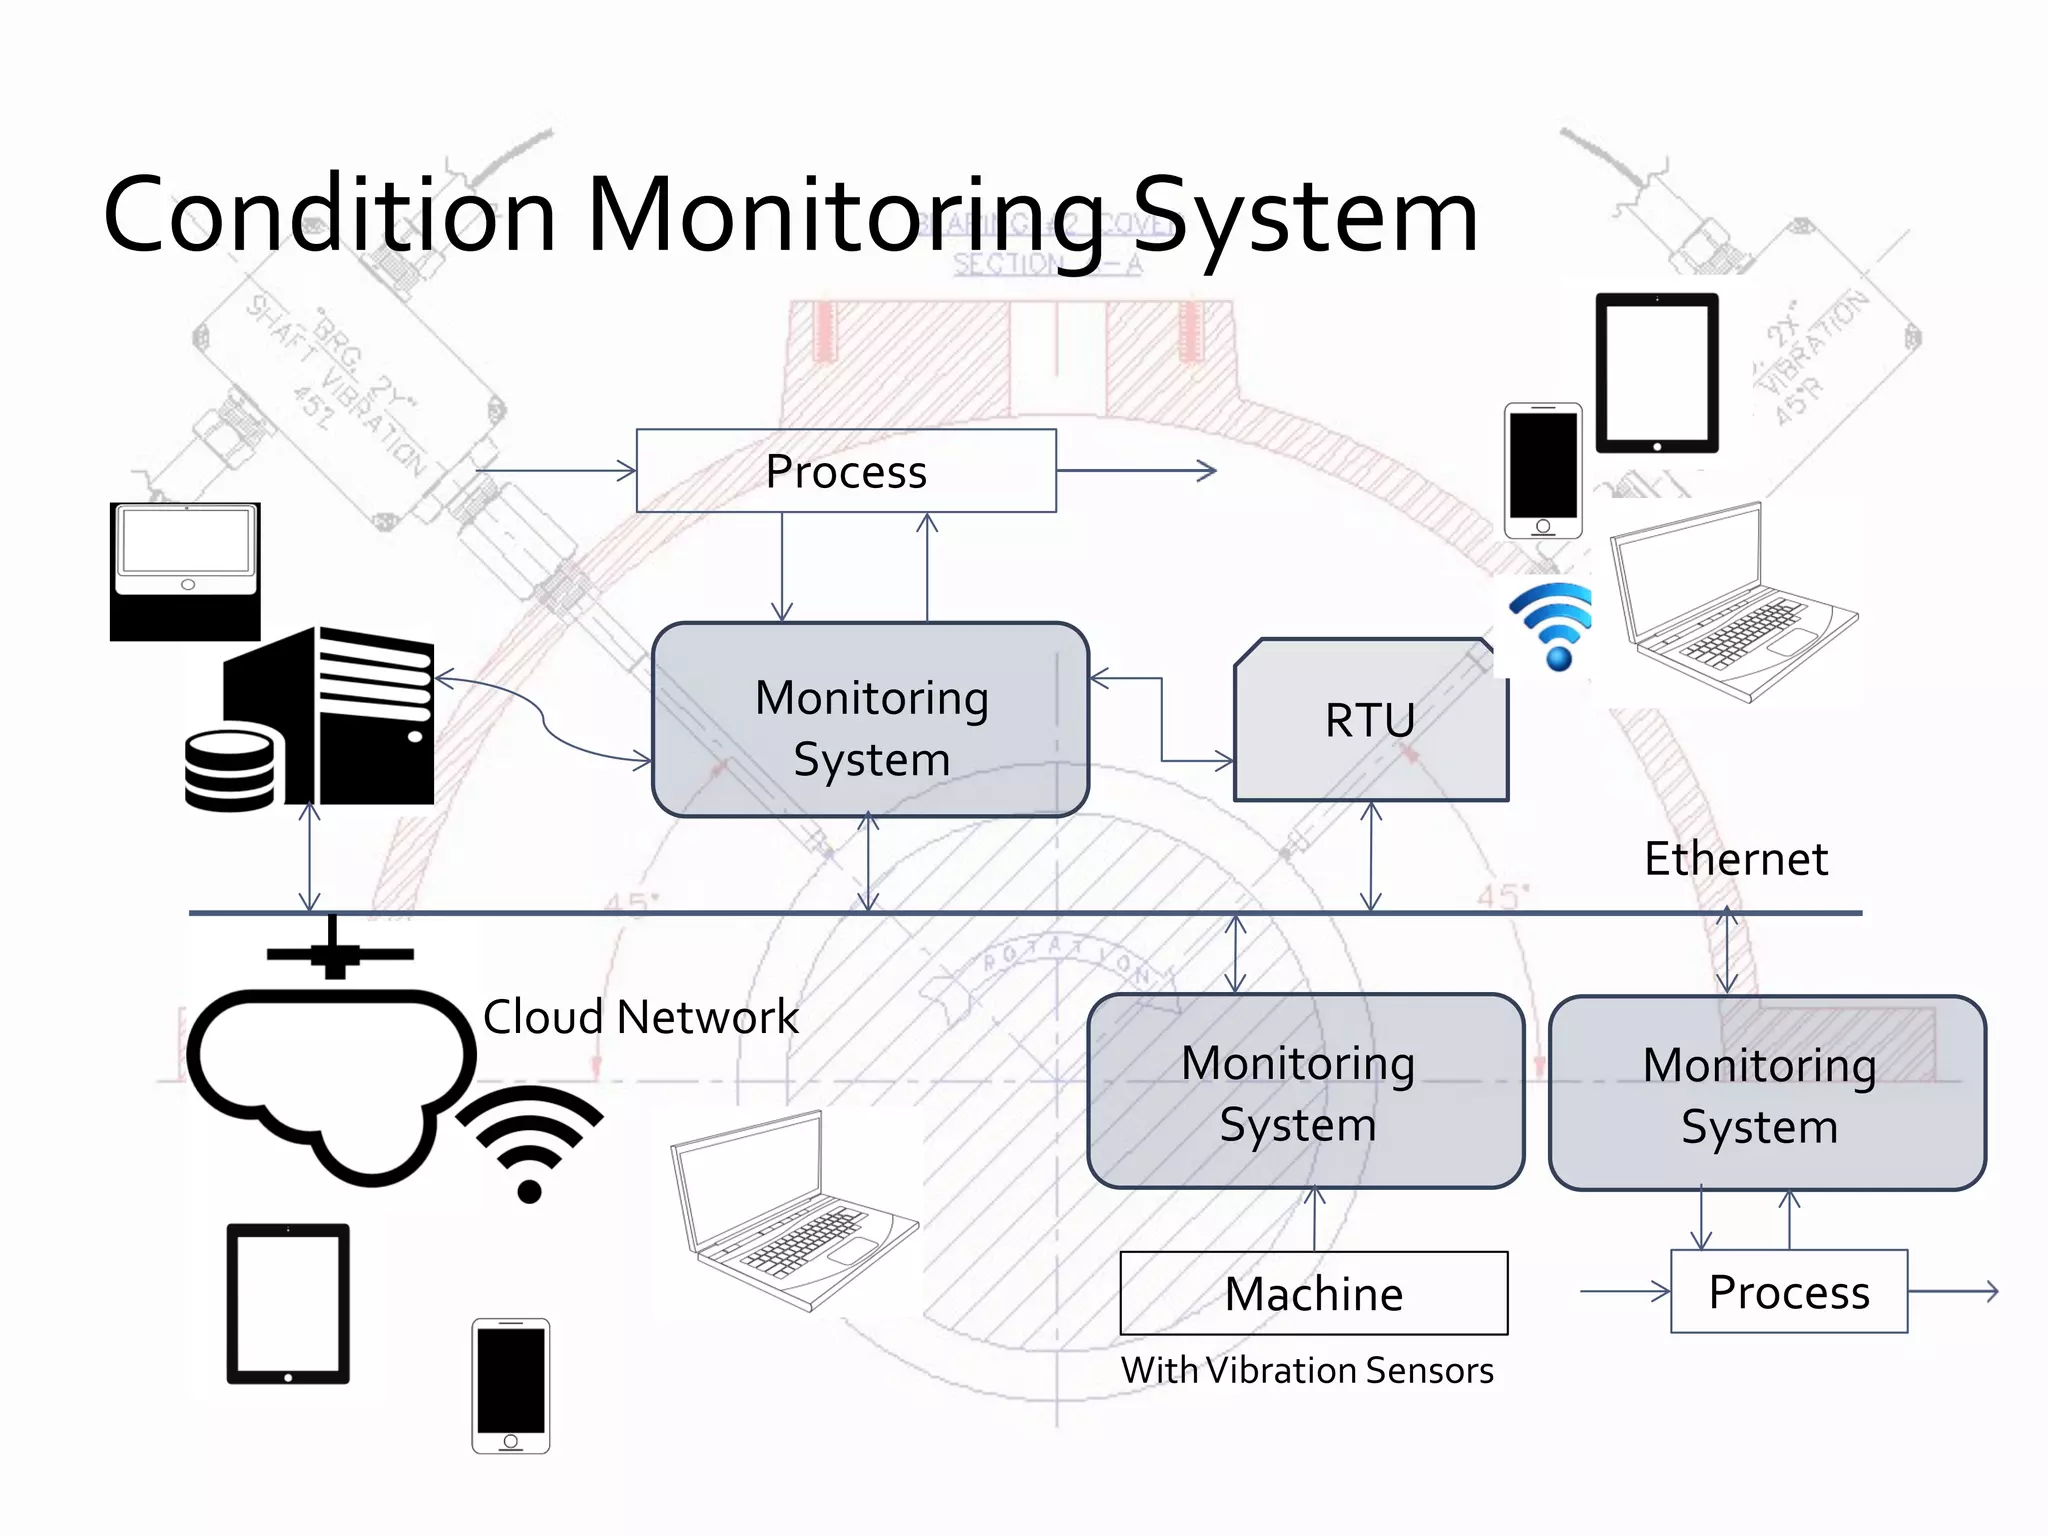
This document discusses advances in fault detection and diagnosis in industry. It covers condition monitoring techniques like vibration analysis, lubricant analysis, and thermography. It discusses the differences between fault, failure, and malfunction and describes fault detection as detecting small faults early through techniques like limit checking and trend analysis. Fault diagnosis involves diagnosing faults in processes, parts, and devices using analytical and heuristic methods. Condition monitoring systems are discussed along with fault detection models using process variables. Data analysis techniques and online enterprise asset management are also covered.