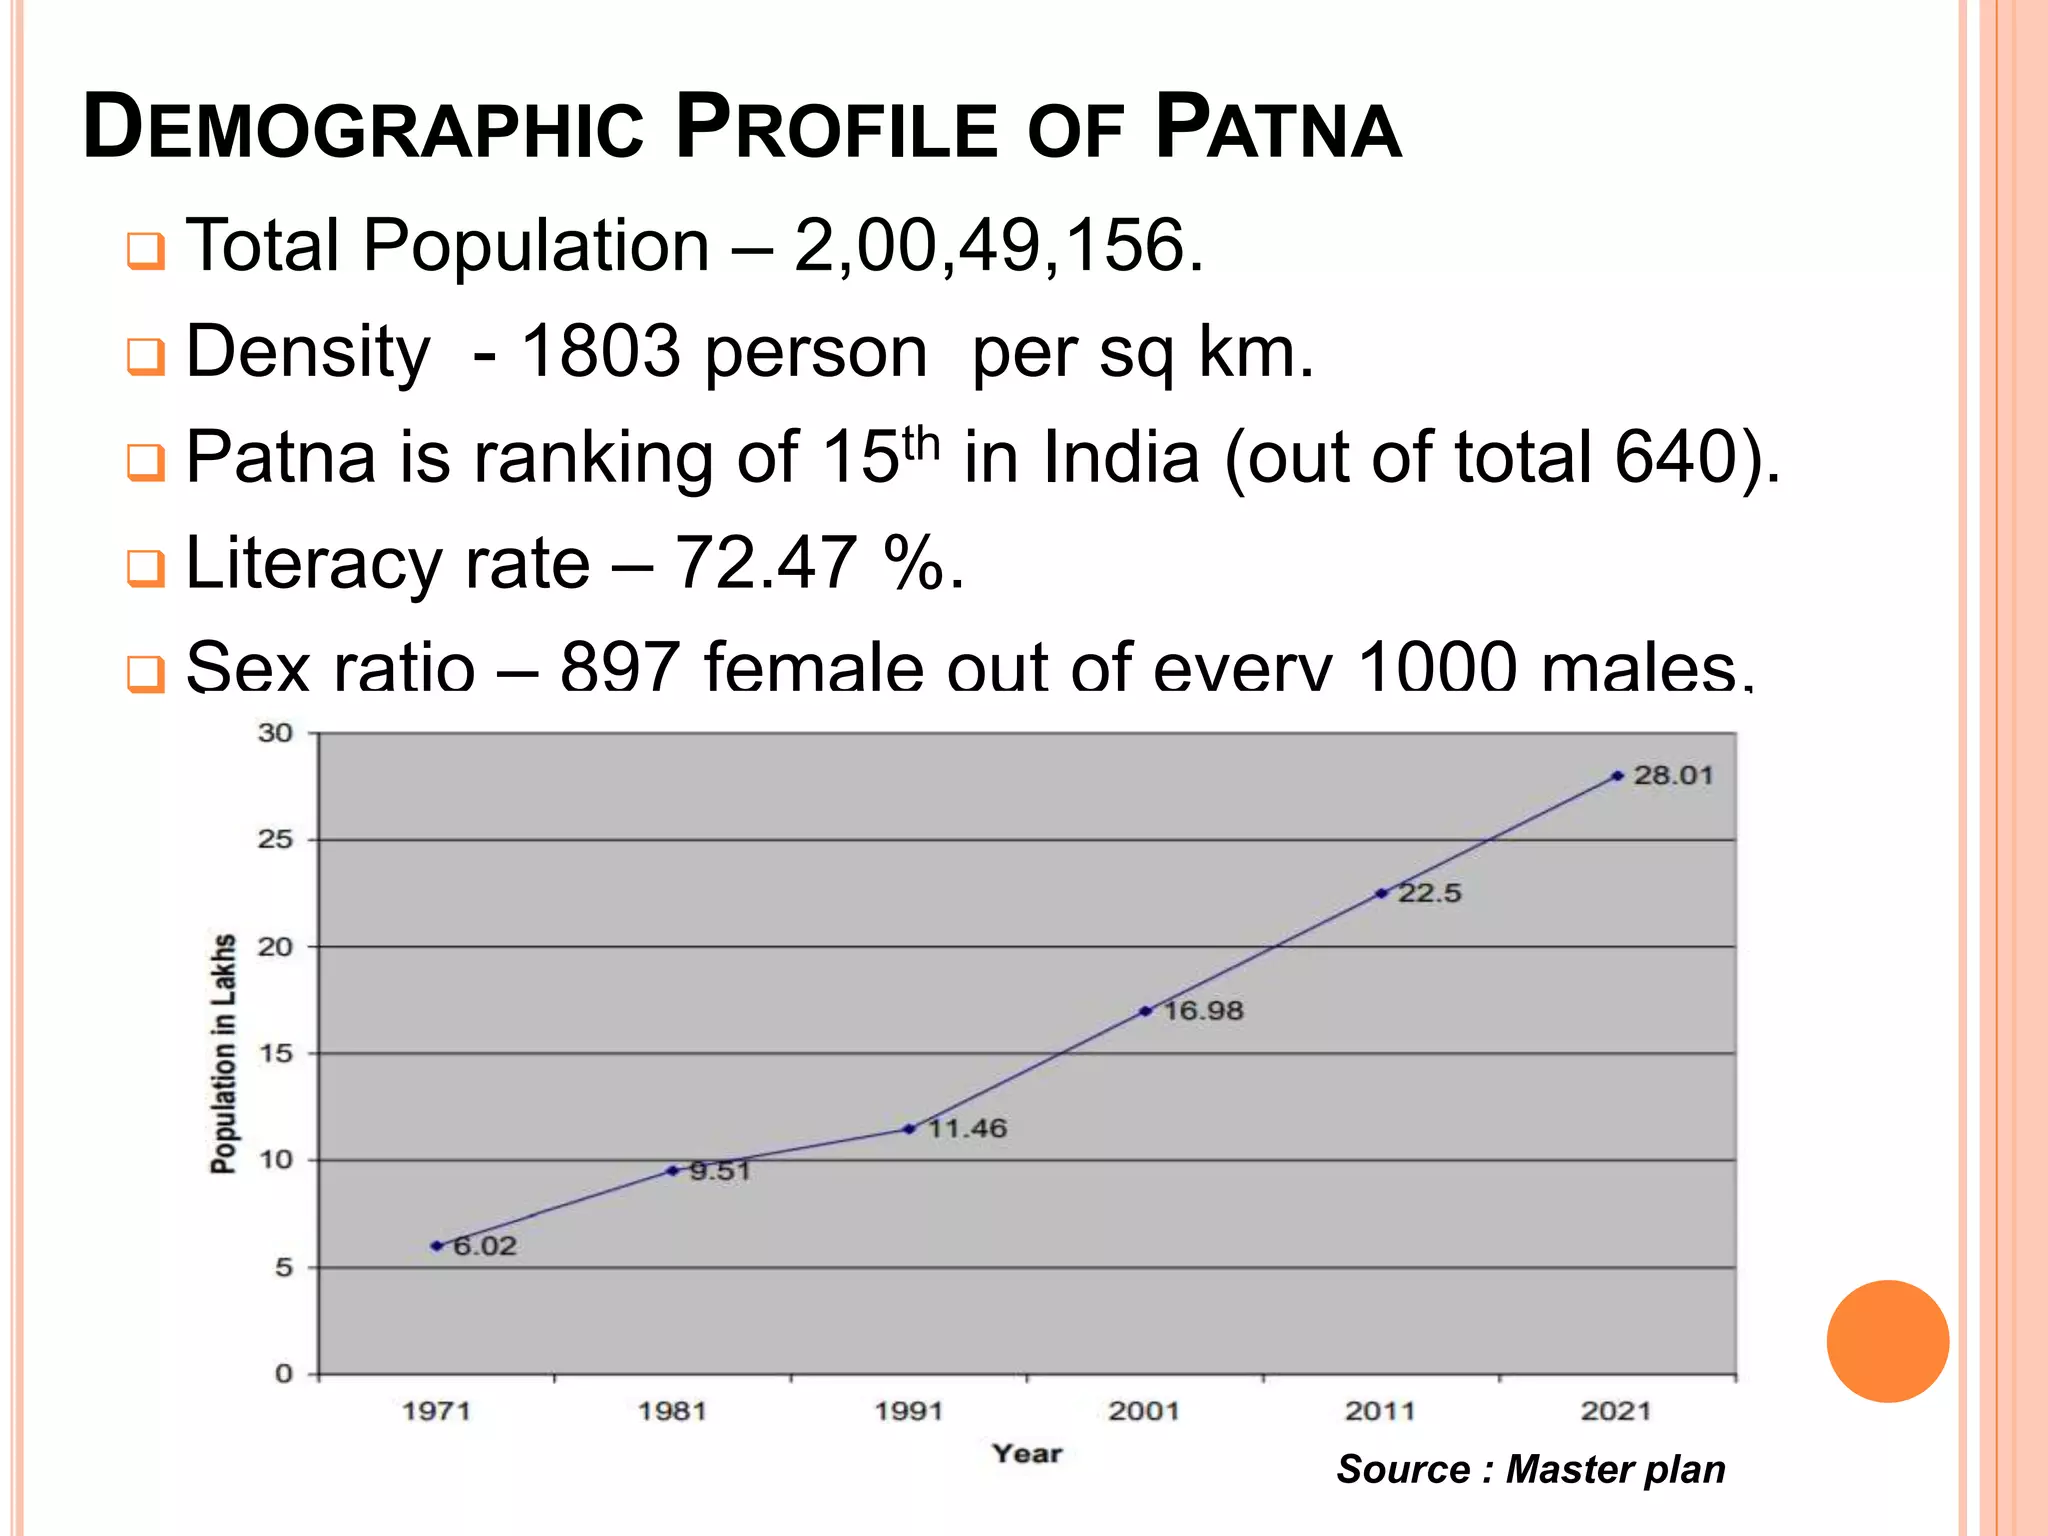
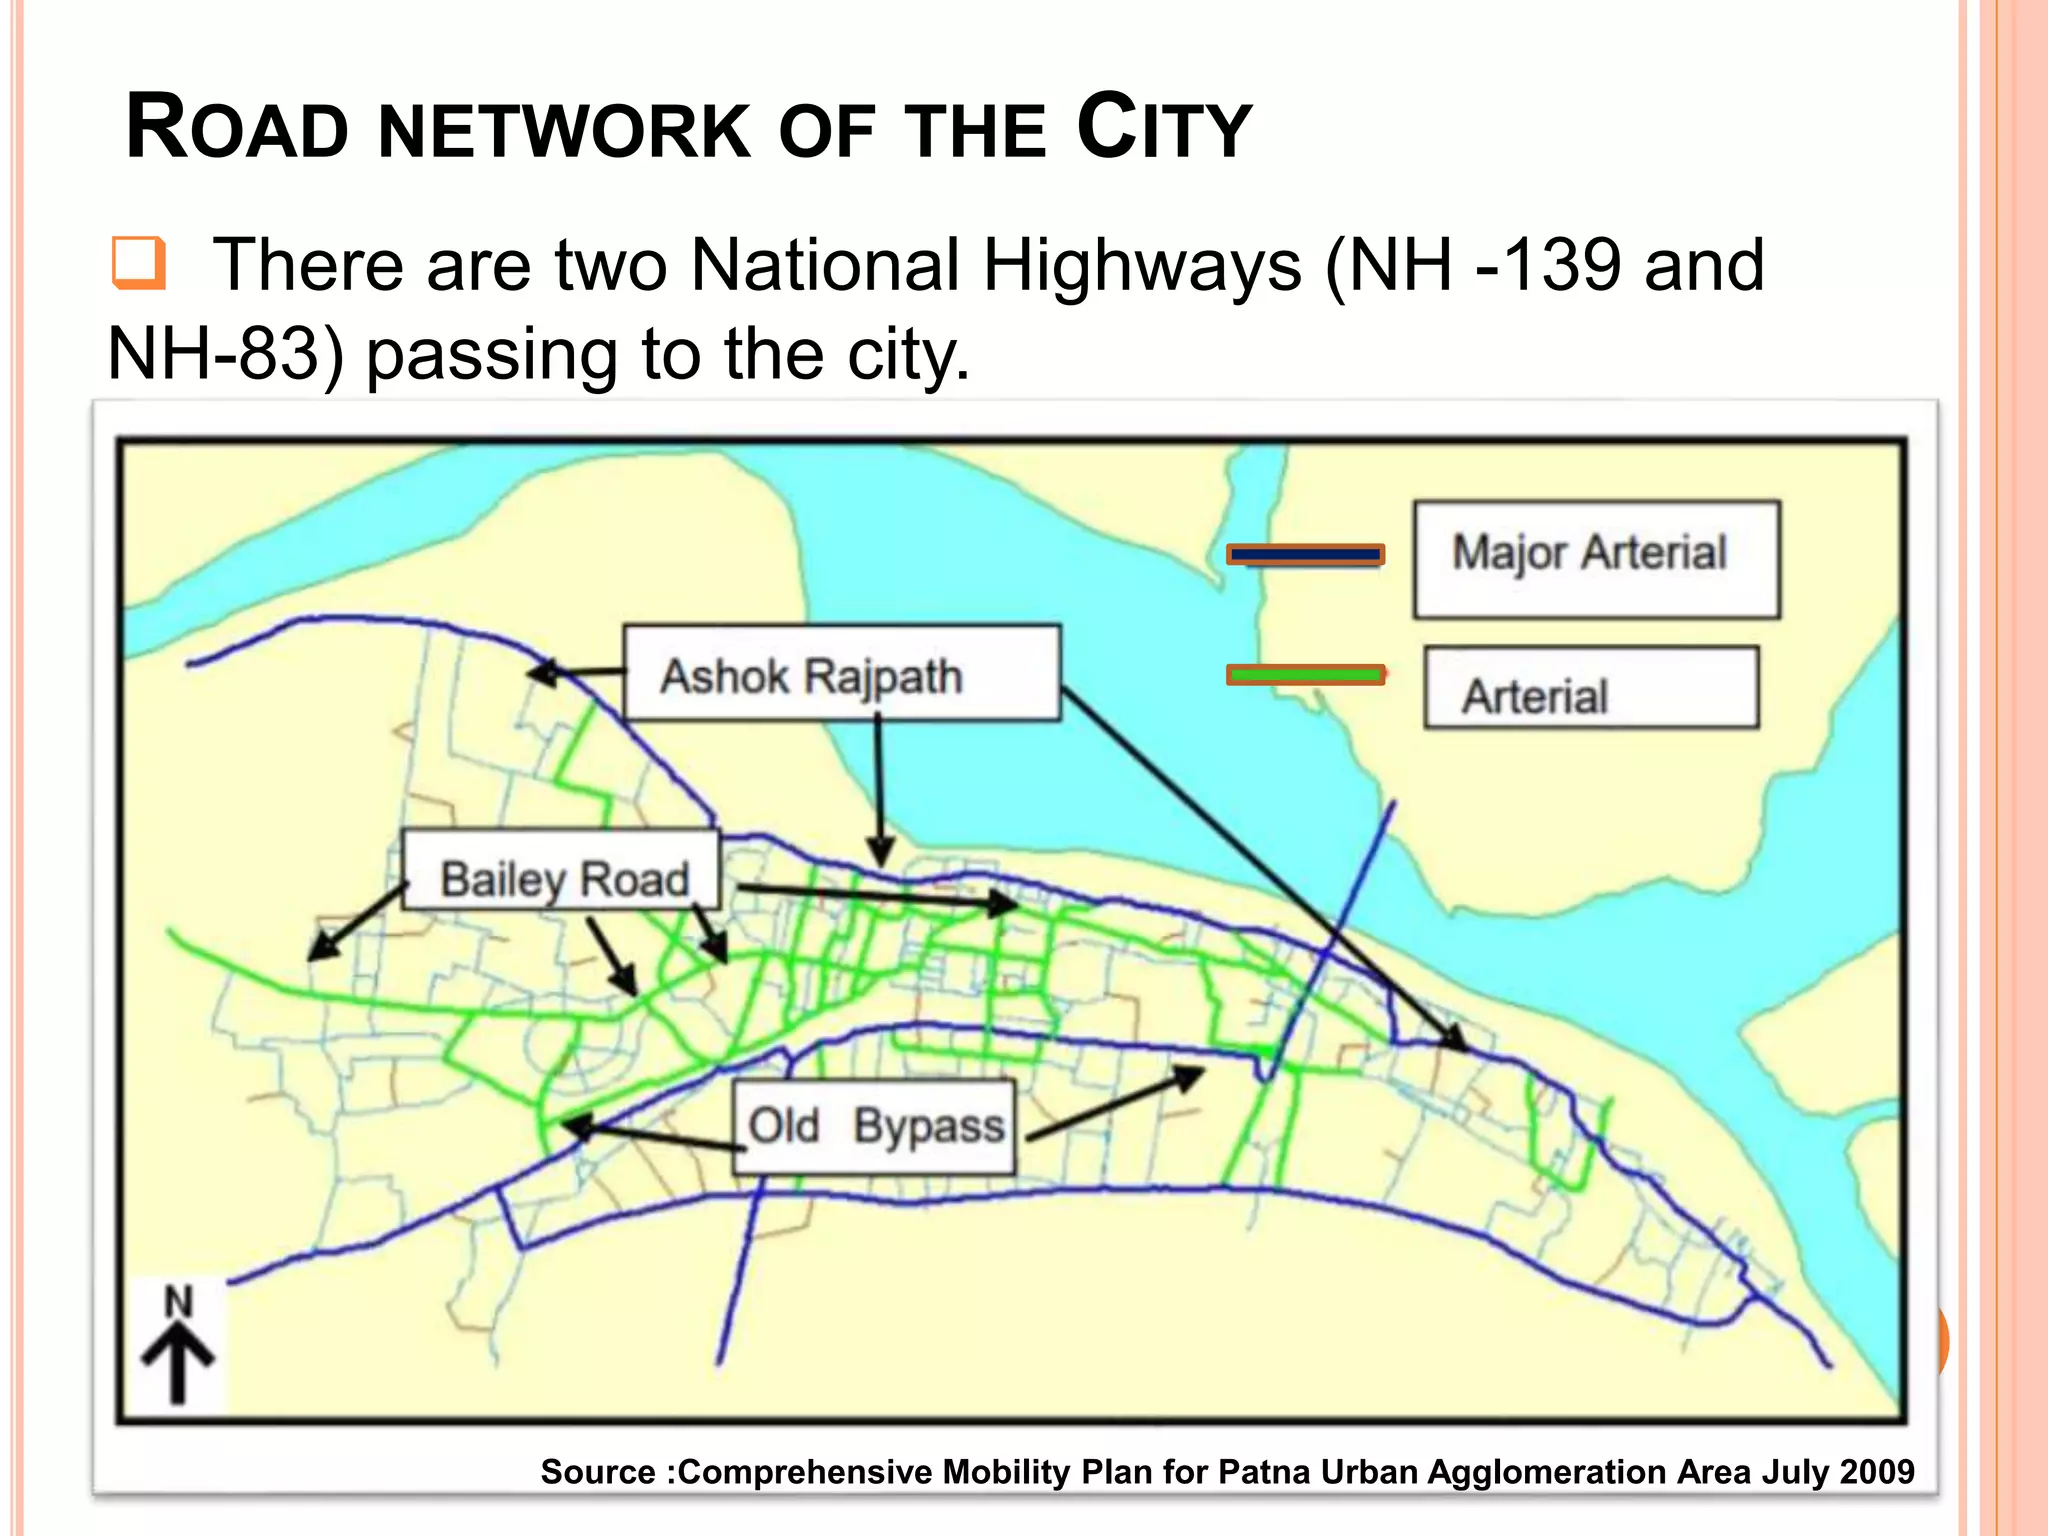
INTRODUCTION
 The scope of Comprehensive Mobility Plan is to
prepare a long term desirable mobility plan for the
city that incorporates all modes of transport.
 The scope of the CMP would integrate land use
with transport planning and develop an urban
transport strategy that conforms to the National
Urban Transport Policy (NUTP).
 The CMP recommends the most appropriate,
sustainable, and cost‐effective investments in the
transport sector.
DEMOGRAPHIC PROFILE OF PATNA
 Total Population – 2,00,49,156.
 Density - 1803 person per sq km.
 Patna is ranking of 15th in India (out of total 640).
 Literacy rate – 72.47 %.
 Sex ratio – 897 female out of every 1000 males.
Source : Master plan
ROAD NETWORK OF THE CITY
Source :Comprehensive Mobility Plan for Patna Urban Agglomeration Area July 2009
 There are two National Highways (NH -139 and
NH-83) passing to the city.
LENGTH OF ROADS WITH ROAD WIDTH
Speed ranges based on road types
Source: RCD, Govt. of Bihar.
TRIP LENGTH DISTRIBUTION OF DIFFERENT
MODES
Source : Department of Urban Development Government of Bihar
VEHICULAR GROWTH AND COMPOSITION
MODE OF TRANSPORTATION
Vehicle Ownership during Different Years
CDP 2006
Land use
The land use map of the year 2006 was taken as an input and is
shown in the figure below. Also seen from the map is the extent
of commercial land use along the major roads in Patna, which
emphasizes the fact of mixed land use all across the city,
especially in the older or eastern parts of the city.
Source: CDP (2006),
EXISTING LAND USE MAP
CDP 2009
Major proposed developments
. (Source: Master plan)
The urban growth is assumed to follow an organic growth instead of a
planned and organized growth pattern. The master plans aims to
maintain an overall density of 150 persons/ hectare. It is assumed
that the population in the existing, high density zones would prefer to
move out to the new developments as per the master plan.
LAND USE‐TRANSPORT
INTERACTION
Present Land use and Traffic Analysis Zone
Map
Land use and transport and their interaction is unquestionable.
Residents of a new colony demand accessibility and this increased
accessibility brings more residents and more residential areas.
This is a cyclic process and often forms the reason of organic
growth observed in urban areas.
Comprehensive mobility plan , patna

Comprehensive mobility plan , patna

  • 2.
    INTRODUCTION  The scopeof Comprehensive Mobility Plan is to prepare a long term desirable mobility plan for the city that incorporates all modes of transport.  The scope of the CMP would integrate land use with transport planning and develop an urban transport strategy that conforms to the National Urban Transport Policy (NUTP).  The CMP recommends the most appropriate, sustainable, and cost‐effective investments in the transport sector.
  • 3.
    DEMOGRAPHIC PROFILE OFPATNA  Total Population – 2,00,49,156.  Density - 1803 person per sq km.  Patna is ranking of 15th in India (out of total 640).  Literacy rate – 72.47 %.  Sex ratio – 897 female out of every 1000 males. Source : Master plan
  • 4.
    ROAD NETWORK OFTHE CITY Source :Comprehensive Mobility Plan for Patna Urban Agglomeration Area July 2009  There are two National Highways (NH -139 and NH-83) passing to the city.
  • 5.
    LENGTH OF ROADSWITH ROAD WIDTH Speed ranges based on road types Source: RCD, Govt. of Bihar. Source: RCD, Govt. of Bihar.
  • 6.
    TRIP LENGTH DISTRIBUTIONOF DIFFERENT MODES Source : Department of Urban Development Government of Bihar
  • 7.
  • 8.
    MODE OF TRANSPORTATION VehicleOwnership during Different Years CDP 2006 Land use The land use map of the year 2006 was taken as an input and is shown in the figure below. Also seen from the map is the extent of commercial land use along the major roads in Patna, which emphasizes the fact of mixed land use all across the city, especially in the older or eastern parts of the city.
  • 9.
    Source: CDP (2006), EXISTINGLAND USE MAP CDP 2009
  • 10.
    Major proposed developments .(Source: Master plan) The urban growth is assumed to follow an organic growth instead of a planned and organized growth pattern. The master plans aims to maintain an overall density of 150 persons/ hectare. It is assumed that the population in the existing, high density zones would prefer to move out to the new developments as per the master plan.
  • 11.
    LAND USE‐TRANSPORT INTERACTION Present Landuse and Traffic Analysis Zone Map Land use and transport and their interaction is unquestionable. Residents of a new colony demand accessibility and this increased accessibility brings more residents and more residential areas. This is a cyclic process and often forms the reason of organic growth observed in urban areas.