SlideShare a Scribd company logo
1 of 24
Download to read offline
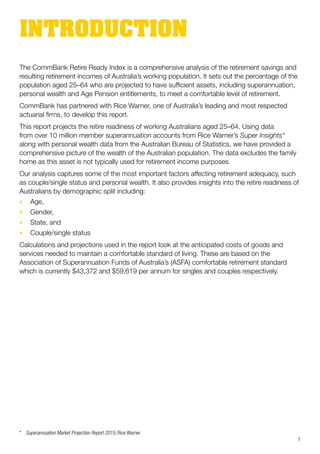
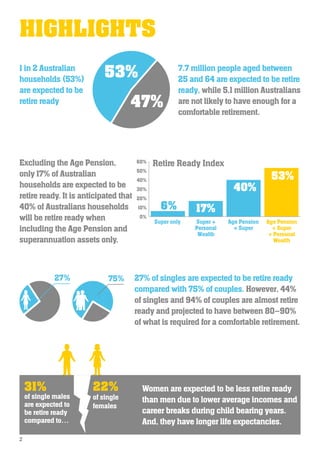
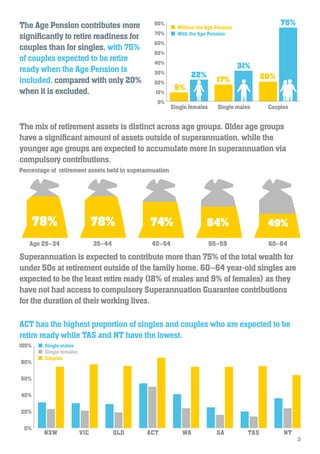
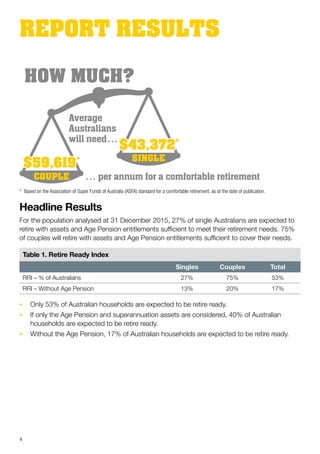
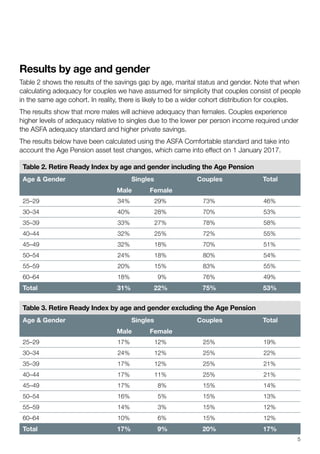
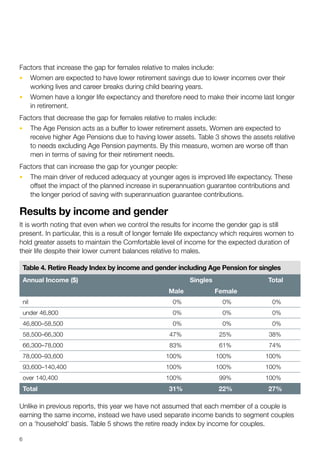
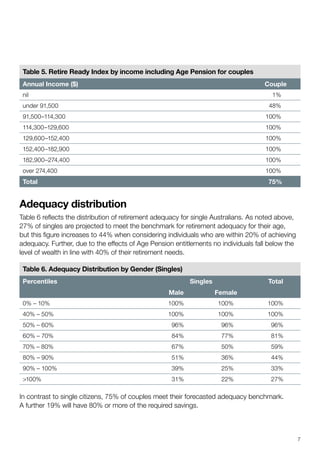
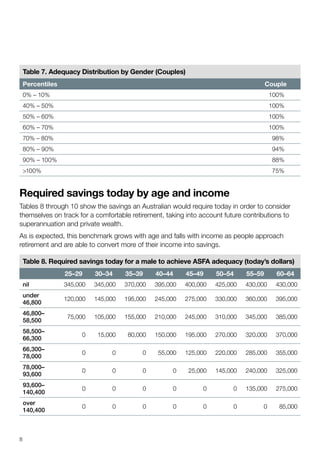
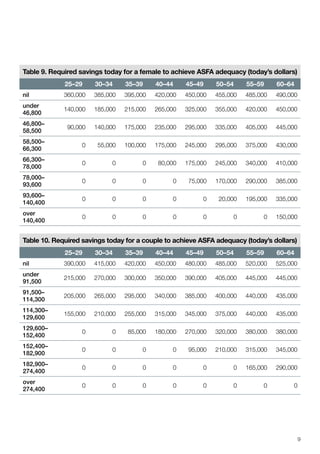
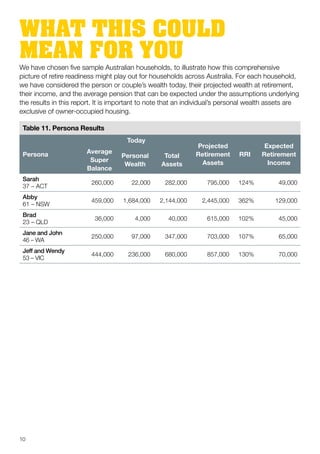
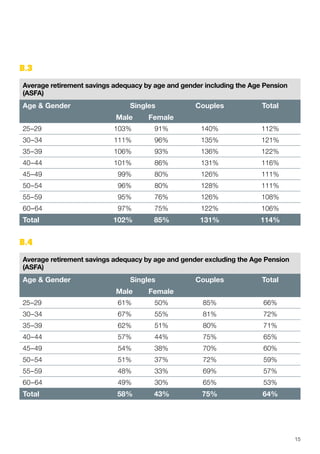
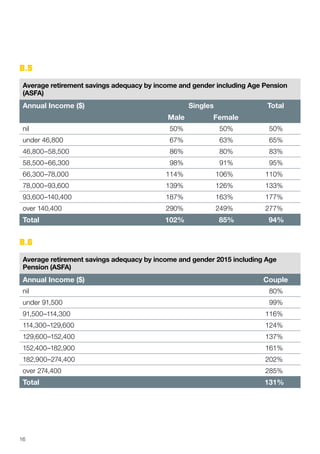
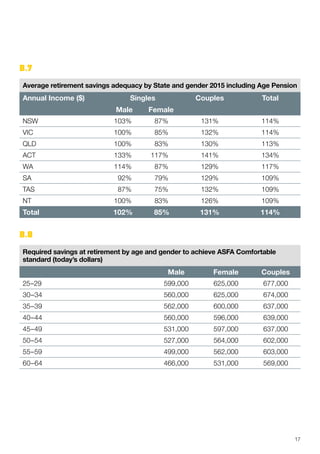
011/2017
One in two Australian households expected to be retire ready
CommBank Retire Ready Index report released today
STRICTLY EMBARGOED until 12:01am on Monday, 6 February 2017: Fifty-three per cent of
Australian households are expected to have enough for a comfortable retirement from their
combined superannuation savings, personal assets and the Age Pension, according to the latest
CommBank Retire Ready Index released today.
When the Age Pension is removed, the number of households that can afford a comfortable
retirement reduces to 17 per cent, and to just six per cent when the calculations are based on
superannuation only.
Linda Elkins, Executive General Manager Advice, Commonwealth Bank said: “The good news is
that many Australians who may not currently be on track for a comfortable retirement are very
close. A little bit of planning could see them reach the comfortable level.”
CommBank commissioned Rice Warner to prepare the report, which shows that many Australians
are close to achieving the comfortable retirement standard defined by the Association of
Superannuation Funds of Australia (ASFA). The report shows that while 53 per cent of Australian
households are on track, a further 18 per cent are projected have 80 to 99 per cent of what they
will need.
The overall results are mixed across cohorts and age groups, and highlight the growing
importance of superannuation in helping Australians achieve a comfortable retirement.
Millennials will need to save harder for retirement than other cohorts due to their longer life
expectancies. Superannuation will play an important role and will comprise, on average, 78 per
cent of retirement assets for 25 year-olds working today.
“The CommBank Retire Ready Index shows how important superannuation will be for the long
term financial well-being of young Australians. Many people do not become engaged with
superannuation until later in their working lives, but taking a keener interest in superannuation
now, consolidating accounts into one super fund and contributing a little more each week can help
younger Australians stay on track for a comfortable retirement,” Ms Elkins said.
In the 60-64 year-old age group, couples are expected to be better off than singles but will have
reduced retire readiness as they have not received the long term benefits of compulsory
Superannuation Guarantee contributions. On the other hand, younger age groups are expected to
have less in assets at retirement outside of superannuation when compared with their older
counterparts.
“The report also shows that more men than women are retire ready. Women have longer life
expectancies, and therefore need more assets to maintain a comfortable level of retirement.
011/2017
Women also generally have lower retirement savings due to career breaks during their child
bearing years and lower average income levels throughout their working lives.”
Ms Elkins also said: “People who are approaching retirement could give their savings a boost by
taking advantage of the current superannuation contribution caps before they are reduced on 1
July.”
“It is important that people of all ages understand how much they will need to save now to secure
their financial futures.”
“To help Australians see how on track they are for a comfortable retirement, CommBank has
developed a retirement calculator. This is a good first step to see how retire ready you are and is a
useful resource to help you get on track to reach your goals for a comfortable retirement,” she
said.
Five tips to be retire ready
1. If you have more than one superannuation fund, consolidate your accounts to help save on
fees
2. Find out how much you’ll need for retirement using our retirement calculator at
commbank.com.au/retirementcalculator
3. Develop a retirement plan – talk to a financial planner about your retirement goals
4. Revise your household budget to see if there is any spare cash to put away for retirement,
using our budget planner tool at commbank.com.au/budgetplanner
5. Seek advice on how the changes to superannuation on 1 July 2017 will affect your
retirement.
For more information about the CommBank Retire Ready Index, and to read the full report, visit
commbank.com.au/retireready.
ENDS
Media contact:
Robyn Tolhurst
Commonwealth Bank Media
02 9118 6919
media@cba.com.au
011/2017
About the CommBank Retire Ready Index
The CommBank Retire Ready Index is a comprehensive analysis of the retirement savings and
resulting retirement incomes of Australia’s working population. It looks at the percentage of the
population aged 25-64 who are projected to have sufficient assets, including superannuation,
personal wealth and Age Pension entitlements, to meet a comfortable level of retirement.
CommBank has partnered with Rice Warner, one of Australia’s leading and most respected
actuarial firms, to develop this report.
The report projects the retire readiness of working Australians aged 25-64. Using data from over
10 million member superannuation accounts from Rice Warner’s Super Insights1
along with
personal wealth data from the Australian Bureau of Statistics, we have provided a comprehensive
picture of the wealth of the Australian population. The data excludes the family home as this asset
is not typically used for retirement income purposes.
Our analysis captures some of the most important factors affecting retirement adequacy, such as
couple/single status and personal wealth. It also provides insights into the retire readiness of
Australians by demographic split including:
 Age;
 Gender;
 State; and
 Couple/single status.
Calculations and projections used in the report look at the anticipated costs of goods and services
needed to maintain a comfortable standard of living. These are based on the Association of
Superannuation Funds of Australia’s (ASFA) comfortable retirement standard of $43,372 and
$59,619 per annum for singles and couples respectively.
1 Superannuation Market Projection Report 2015, Rice Warner
READY,SET,GO!
FORRETIREMENT.
Average
Australians
willneed…
…perannumforacomfortableretirement*COUPLE
SINGLE
$59,619*$59,619*
$43,372*$43,372*
HOWMUCH?
READYFORRETIREMENT?
Femalesrequire
morethanmales
duetolongerlife
expectancies
Singlesare
worseoff
Whilecouples
aretrackingwell
27%ofsingle
Australiansare
expectedtoretirewith
enoughretirement
assets,includingthe
AgePension
Womenareexpectedtobeless
retirereadythanmendueto
loweraverageincomesand
careerbreaksduringchild
bearingyears.And,theyhave
longerlifeexpectancies.
ofsinglemalesare
expectedtoberetire
readycomparedto…
ofsinglefemales
75%ofcouplesare
expectedtoretirewith
enoughretirement
assets,includingthe
AgePension
53%ofAustralian
householdsareexpected
tohaveenoughfora
comfortableretirement*
47%of
Australian
householdsmay
nothaveenough
foracomfortable
retirement*
Today'syouthwillneed
moreinretirement
becausetheyare
expectedtolivelonger
Acoupleandsingle
require$640kand
$545krespectivelyfora
comfortableretirement*
0%
10%
20%
30%
40%
50%
60%
0%
10%
20%
30%
40%
50%
60%
70%
80%
Superonly
SinglefemalesSinglemalesCouples
Super+
Personal
Wealth
AgePension
+Super
AgePension
+Super
+Personal
Wealth
53%
53%
47%
40%
17%6%
9%
22%
17%
31%
20%
75%
RetireReadyIndex
GenderandHouseholdRetirereadinessbyhousehold
THEGENDERGAP
SETFORRETIREMENT
GOFORRETIREMENT
22%31%
IWithouttheAgePension
IWiththeAgePension
55–59
64%
60–64
49%
45–54
74%
35–44
78%
Age25–34
78%
CALCULATE
howmuchyoumightneedforacomfortableretirementonthe
CommBankwebsiteatcommbank.com.au/retirementcalculator
FindoutmoreabouttheCommBankRetire
ReadyIndexatcommbank.com.au/retireready
THECOMMBANK
RETIREREADYINDEX
*AssociationofSuperannuationFundsofAustralia(ASFA)comfortableretirementstandard,asatdateofpublication
†
BasedontheassumptionsusedbyRiceWarnerincalculatingtheCommBankRetireReadyIndex
Thingsyoushouldknow:ThisdocumenthasbeenpreparedusingdatafromtheCommBankRetireReadyIndexwhichwasdevelopedincollaborationwithRiceWarner.Youcanseeacopyof
theCommBankRetireReadyIndexbygoingtocommbank.com.au/retireready.Thisdocumenthasbeenpreparedwithoutconsideringyourobjectives,nancialsituationorneeds.Youshould,
beforeactingonthisadvice,consideritsappropriatenesstoyourcircumstances.CommonwealthBankofAustraliaABN48123123124AFSL234945Call132221orvisitcommbank.com.au
Alittleextrainyoursuperannuationnow
canmakeadifferencelater.
35YEAR-OLDCOUPLE
Savinganextra$50perweek
untilretirementcanmovefrom
80%to100%retirereadiness.†
45YEAR-OLDCOUPLE
Savinganextra$88perweek
untilretirementcanmovefrom
80%to100%retirereadiness.†
55YEAR-OLDCOUPLE
Savinganextra$174perweek
untilretirementcanmovefrom
80%to100%retirereadiness.†
isacomprehensiveanalysisofAustralians’
retirementsavingsandresultingretirementincomes.
whowillhavesufcientassetstomeettheir
retirementneedsincludingtheagepension.
Itprojectsthepercentage
ofthepopulationaged25–64
Thereporthasuseddatafrommorethan
Australiansuperannuation
accountsasat30Dec2015.10m
27%75%
23102/0217
7.7millionAustraliansareontrackforcomfortableretirement*
Percentageofretirementassetsheldinsuperannuation
Howmuchcoupleswouldneedtodaytobeontrack–
basedonaveragegrosshouseholdincomesof$107,000.
7.7million
100%retireready
1.4million
90%ontrack
1million
80%ontrack
$280k
$224k
$362.5k
$290k
$420k
$336k
RETIRE
READY
INDEX.
CONTENTS
Introduction1
Highlights2
Report Results 4
Headline Results 4
Results by age and gender 5
Results by income and gender 6
Adequacy distribution 7
Required savings today by age and income 8
What this could mean for you 10
Methodology and Assumptions 11
Appendix A – Assumptions 12
Appendix B –
Changes to method and average savings adequacy 14
February 2017
The CommBank Retire Ready Index is a comprehensive analysis of the retirement savings and
resulting retirement incomes of Australia’s working population. It sets out the percentage of the
population aged 25–64 who are projected to have sufficient assets, including superannuation,
personal wealth and Age Pension entitlements, to meet a comfortable level of retirement.
CommBank has partnered with Rice Warner, one of Australia’s leading and most respected
actuarial firms, to develop this report.
This report projects the retire readiness of working Australians aged 25–64. Using data
from over 10 million member superannuation accounts from Rice Warner’s Super Insights*
along with personal wealth data from the Australian Bureau of Statistics, we have provided a
comprehensive picture of the wealth of the Australian population. The data excludes the family
home as this asset is not typically used for retirement income purposes.
Our analysis captures some of the most important factors affecting retirement adequacy, such
as couple/single status and personal wealth. It also provides insights into the retire readiness of
Australians by demographic split including:
•	 Age,
•	 Gender,
•	 State, and
•	 Couple/single status
Calculations and projections used in the report look at the anticipated costs of goods and
services needed to maintain a comfortable standard of living. These are based on the
Association of Superannuation Funds of Australia’s (ASFA) comfortable retirement standard
which is currently $43,372 and $59,619 per annum for singles and couples respectively.
INTRODUCTION
*	 Superannuation Market Projection Report 2015, Rice Warner
1
HIGHLIGHTS
53%
47%
1 in 2 Australian
households (53%)
are expected to be
retire ready
7.7 million people aged between
25 and 64 are expected to be retire
ready, while 5.1 million Australians
are not likely to have enough for a
comfortable retirement.
Excluding the Age Pension,
only 17% of Australian
households are expected to be
retire ready. It is anticipated that
40% of Australians households
will be retire ready when
including the Age Pension and
superannuation assets only.
0%
10%
20%
30%
40%
50%
60%
Super only Super +
Personal
Wealth
Age Pension
+ Super
Age Pension
+ Super
+ Personal
Wealth
53%
40%
17%6%
Retire Ready Index
27% of singles are expected to be retire ready
compared with 75% of couples. However, 44%
of singles and 94% of couples are almost retire
ready and projected to have between 80–90%
of what is required for a comfortable retirement.
Women are expected to be less retire ready
than men due to lower average incomes and
career breaks during child bearing years.
And, they have longer life expectancies.
27% 75%
31%
of single males
are expected to
be retire ready
compared to…
22%
of single
females
2
ACT has the highest proportion of singles and couples who are expected to be
retire ready while TAS and NT have the lowest.
The mix of retirement assets is distinct across age groups. Older age groups
have a significant amount of assets outside of superannuation, while the
younger age groups are expected to accumulate more in superannuation via
compulsory contributions.
The Age Pension contributes more
significantly to retire readiness for
couples than for singles, with 75%
of couples expected to be retire
ready when the Age Pension is
included, compared with only 20%
when it is excluded.
Superannuation is expected to contribute more than 75% of the total wealth for
under 50s at retirement outside of the family home. 60–64 year-old singles are
expected to be the least retire ready (18% of males and 9% of females) as they
have not had access to compulsory Superannuation Guarantee contributions
for the duration of their working lives.
55–59
64%
60–64
49%
45–54
74%
35–44
78%
0%
10%
20%
30%
40%
50%
60%
70%
80%
Single females Single males Couples
9%
22%
17%
31%
20%
75%
0%
20%
40%
60%
80%
100%
NSW VIC QLD ACT WA SA TAS NT
3
Average
Australians
will need…
… per annum for a comfortable retirementCOUPLE
SINGLE
$59,619*$59,619*
$43,372*$43,372*
HOW MUCH?
*  Based on the Association of Super Funds of Australia (ASFA) standard for a comfortable retirement, as at the date of publication.
Headline Results
For the population analysed at 31 December 2015, 27% of single Australians are expected to
retire with assets and Age Pension entitlements sufficient to meet their retirement needs. 75%
of couples will retire with assets and Age Pension entitlements sufficient to cover their needs.
Table 1. Retire Ready Index
Singles Couples Total
RRI – % of Australians 27% 75% 53%
RRI – Without Age Pension 13% 20% 17%
•	 Only 53% of Australian households are expected to be retire ready.
•	 If only the Age Pension and superannuation assets are considered, 40% of Australian
households are expected to be retire ready.
•	 Without the Age Pension, 17% of Australian households are expected to be retire ready.
REPORT RESULTS
4
Results by age and gender
Table 2 shows the results of the savings gap by age, marital status and gender. Note that when
calculating adequacy for couples we have assumed for simplicity that couples consist of people
in the same age cohort. In reality, there is likely to be a wider cohort distribution for couples.
The results show that more males will achieve adequacy than females. Couples experience
higher levels of adequacy relative to singles due to the lower per person income required under
the ASFA adequacy standard and higher private savings.
The results below have been calculated using the ASFA Comfortable standard and take into
account the Age Pension asset test changes, which came into effect on 1 January 2017.
Table 2. Retire Ready Index by age and gender including the Age Pension
Age  Gender Singles Couples Total
Male Female
25–29 34% 29% 73% 46%
30–34 40% 28% 70% 53%
35–39 33% 27% 78% 58%
40–44 32% 25% 72% 55%
45–49 32% 18% 70% 51%
50–54 24% 18% 80% 54%
55–59 20% 15% 83% 55%
60–64 18% 9% 76% 49%
Total 31% 22% 75% 53%
Table 3. Retire Ready Index by age and gender excluding the Age Pension
Age  Gender Singles Couples Total
Male Female
25–29 17% 12% 25% 19%
30–34 24% 12% 25% 22%
35–39 17% 12% 25% 21%
40–44 17% 11% 25% 21%
45–49 17% 8% 15% 14%
50–54 16% 5% 15% 13%
55–59 14% 3% 15% 12%
60–64 10% 6% 15% 12%
Total 17% 9% 20% 17%
5
Factors that increase the gap for females relative to males include:
•	 Women are expected to have lower retirement savings due to lower incomes over their
working lives and career breaks during child bearing years.
•	 Women have a longer life expectancy and therefore need to make their income last longer
in retirement.
Factors that decrease the gap for females relative to males include:
•	 The Age Pension acts as a buffer to lower retirement assets. Women are expected to
receive higher Age Pensions due to having lower assets. Table 3 shows the assets relative
to needs excluding Age Pension payments. By this measure, women are worse off than
men in terms of saving for their retirement needs.
Factors that can increase the gap for younger people:
•	 The main driver of reduced adequacy at younger ages is improved life expectancy. These
offset the impact of the planned increase in superannuation guarantee contributions and
the longer period of saving with superannuation guarantee contributions.
Results by income and gender
It is worth noting that even when we control the results for income the gender gap is still
present. In particular, this is a result of longer female life expectancy which requires women to
hold greater assets to maintain the Comfortable level of income for the expected duration of
their life despite their lower current balances relative to males.
Table 4. Retire Ready Index by income and gender including Age Pension for singles
Annual Income ($) Singles Total
Male Female
nil 0% 0% 0%
under 46,800 0% 0% 0%
46,800–58,500 0% 0% 0%
58,500–66,300 47% 25% 38%
66,300–78,000 83% 61% 74%
78,000–93,600 100% 100% 100%
93,600–140,400 100% 100% 100%
over 140,400 100% 99% 100%
Total 31% 22% 27%
Unlike in previous reports, this year we have not assumed that each member of a couple is
earning the same income, instead we have used separate income bands to segment couples
on a ‘household’ basis. Table 5 shows the retire ready index by income for couples.
6
Table 5. Retire Ready Index by income including Age Pension for couples
Annual Income ($) Couple
nil 1%
under 91,500 48%
91,500–114,300 100%
114,300–129,600 100%
129,600–152,400 100%
152,400–182,900 100%
182,900–274,400 100%
over 274,400 100%
Total 75%
Adequacy distribution
Table 6 reflects the distribution of retirement adequacy for single Australians. As noted above,
27% of singles are projected to meet the benchmark for retirement adequacy for their age,
but this figure increases to 44% when considering individuals who are within 20% of achieving
adequacy. Further, due to the effects of Age Pension entitlements no individuals fall below the
level of wealth in line with 40% of their retirement needs.
Table 6. Adequacy Distribution by Gender (Singles)
Percentiles Singles Total
Male Female
0% – 10% 100% 100% 100%
40% – 50% 100% 100% 100%
50% – 60% 96% 96% 96%
60% – 70% 84% 77% 81%
70% – 80% 67% 50% 59%
80% – 90% 51% 36% 44%
90% – 100% 39% 25% 33%
100% 31% 22% 27%
In contrast to single citizens, 75% of couples meet their forecasted adequacy benchmark.
A further 19% will have 80% or more of the required savings.
7
Table 7. Adequacy Distribution by Gender (Couples)
Percentiles Couple
0% – 10% 100%
40% – 50% 100%
50% – 60% 100%
60% – 70% 100%
70% – 80% 98%
80% – 90% 94%
90% – 100% 88%
100% 75%
Required savings today by age and income
Tables 8 through 10 show the savings an Australian would require today in order to consider
themselves on track for a comfortable retirement, taking into account future contributions to
superannuation and private wealth.
As is expected, this benchmark grows with age and falls with income as people approach
retirement and are able to convert more of their income into savings.
Table 8. Required savings today for a male to achieve ASFA adequacy (today’s dollars)
25–29 30–34 35–39 40–44 45–49 50–54 55–59 60–64
nil 345,000 345,000 370,000 395,000 400,000 425,000 430,000 430,000
under
46,800
120,000 145,000 195,000 245,000 275,000 330,000 360,000 395,000
46,800–
58,500
75,000 105,000 155,000 210,000 245,000 310,000 345,000 385,000
58,500–
66,300
0 15,000 80,000 150,000 195,000 270,000 320,000 370,000
66,300–
78,000
0 0 0 55,000 125,000 220,000 285,000 355,000
78,000–
93,600
0 0 0 0 25,000 145,000 240,000 325,000
93,600–
140,400
0 0 0 0 0 0 135,000 275,000
over
140,400
0 0 0 0 0 0 0 85,000
8
Table 9. Required savings today for a female to achieve ASFA adequacy (today’s dollars)
25–29 30–34 35–39 40–44 45–49 50–54 55–59 60–64
nil 360,000 385,000 395,000 420,000 450,000 455,000 485,000 490,000
under
46,800
140,000 185,000 215,000 265,000 325,000 355,000 420,000 450,000
46,800–
58,500
90,000 140,000 175,000 235,000 295,000 335,000 405,000 445,000
58,500–
66,300
0 55,000 100,000 175,000 245,000 295,000 375,000 430,000
66,300–
78,000
0 0 0 80,000 175,000 245,000 340,000 410,000
78,000–
93,600
0 0 0 0 75,000 170,000 290,000 385,000
93,600–
140,400
0 0 0 0 0 20,000 195,000 335,000
over
140,400
0 0 0 0 0 0 0 150,000
Table 10. Required savings today for a couple to achieve ASFA adequacy (today’s dollars)
25–29 30–34 35–39 40–44 45–49 50–54 55–59 60–64
nil 390,000 415,000 420,000 450,000 480,000 485,000 520,000 525,000
under
91,500
215,000 270,000 300,000 350,000 390,000 405,000 445,000 445,000
91,500–
114,300
205,000 265,000 295,000 340,000 385,000 400,000 440,000 435,000
114,300–
129,600
155,000 210,000 255,000 315,000 345,000 375,000 440,000 435,000
129,600–
152,400
0 0 85,000 180,000 270,000 320,000 380,000 380,000
152,400–
182,900
0 0 0 0 95,000 210,000 315,000 345,000
182,900–
274,400
0 0 0 0 0 0 165,000 290,000
over
274,400
0 0 0 0 0 0 0 0
9
We have chosen five sample Australian households, to illustrate how this comprehensive
picture of retire readiness might play out for households across Australia. For each household,
we have considered the person or couple’s wealth today, their projected wealth at retirement,
their income, and the average pension that can be expected under the assumptions underlying
the results in this report. It is important to note that an individual’s personal wealth assets are
exclusive of owner-occupied housing.
Table 11. Persona Results
Persona
Today
Projected
Retirement
Assets
RRI
Expected
Retirement
Income
Average
Super
Balance
Personal
Wealth
Total
Assets
Sarah
37 – ACT
260,000 22,000 282,000 795,000 124% 49,000
Abby
61 – NSW
459,000 1,684,000 2,144,000 2,445,000 362% 129,000
Brad
23 – QLD
36,000 4,000 40,000 615,000 102% 45,000
Jane and John
46 – WA
250,000 97,000 347,000 703,000 107% 65,000
Jeff and Wendy
53 – VIC
444,000 236,000 680,000 857,000 130% 70,000
WHAT THIS COULD
MEAN FOR YOU
10
METHODOLOGY
AND ASSUMPTIONSThe approach to this year’s Retire Ready Index report differed from the approach in previous
years’ reports.
The first step was to segment the Australian population by gender, marital status, income and
state. This was done primarily using the data available from the 2011 Census, the ABS Survey
of Income and Housing, the ATO 2% Sample File and from other Rice Warner research, such
as the Superannuation Market Projection Report 2015. Each of these segments formed the
basis of a cameo, or an individual scenario, which were then assigned a weight according to
the size of the population. Future entrants to the workforce are not considered and the position
of those over retirement age is ignored. Couples are identified in the data and flagged, and a
couple is represented by a single cameo in the model, rather than the amalgamation of two
singles. Additionally, for each scenario we determined the amount of wealth members were
expected to hold outside of superannuation. Data on personal wealth was primarily taken from
the ABS Survey of Income and Housing and segmented according to gender, marital status,
and income. This personal wealth data was then smoothed and scaled for the differences in
personal wealth between Australian states. Note that personal wealth is exclusive of the value
of owner-occupied housing as these assets are not typically used for retirement income.
Each of these scenarios was then transferred to the Rice Warner retirement projection model.
This model is used as the basis for many of Rice Warner’s retirement calculators and allows
for the projection of an individual’s or a couple’s retirement balance at retirement, as well as
the longevity of that balance for given income requirements. It can also be used to determine
superannuation balance requirements for individuals and couples given an income requirement
and life expectancy. Each of the scenarios were recreated twice – once to determine the
expected retirement balance and a second time to determine the required balance to fund their
retirement for each type of adequacy.
The forward projection of members’ balances at retirement gives us an estimate of likely total
future savings; the ‘Assets’ of the Australian working population at retirement for this report.
Since we also calculate the expected requirement for savings to sustain adequate income to
life expectancy, we also have an estimate of the required savings for the population, or the
‘Liabilities’ in the context of this report. Age 67 is used as a proxy for retirement age, although
we note that a number of individuals will formally retire before this age.
There are a number of items for which we have made implicit assumptions. It is impractical to
segment the population into every potential outcome that may influence the results and there
are a number of items which are significant enough to warrant comment.
The model assumes that females currently working will have a full history of employment, with no
breaks in service for maternity leave, career breaks etc. Similarly, it assumes that those women
currently off work to bear and raise children will not return. Of course, in practice, some will leave
and be replaced by others returning to the workforce. Unfortunately, there are no reliable statistics
showing the extent and incidence of broken service so we have not carried out this more complex
modelling. As a result, the model will overstate the Retire Ready Index for younger females.
Further details on assumptions used in the model are provided in Appendix A.
11
Appendix A – Assumptions
Economic:
Appendix A – Assumptions
2014 2016
Gross investment returns 7.50% 7.00%
Salary growth 4.50% 4.00%
Price inflation 3.00% 2.50%
Expense rate 1.12% 1.10%
First year insurance cost* 0.53% 0.53%
Contributions tax 15.00% 15.00%
Investment tax on roll-up
(allows for franking credits and CGT discounts)
6.00% 6.00%
* After the first year, insurance premiums are indexed to wage growth
Demographic:
•	 Mortality in accordance with the Australian Life Tables 2010–2012 published by the
Australian Government Actuary.
•	 Future improvement to post-retirement mortality in accordance with the 125 year
improvement rates published by the Australian Government Actuary in the Australian Life
Tables 2010–2012.
Future contributions–Super:
•	 Average current employer contribution (including salary sacrifice) of 14.0%.*
•	 3.0% gradual increase of employer contribution from 2014 to 2025.
•	 Average member contribution of 3.2%.
Treatment of Couples:
•	 Reporting bands for couples’ incomes are based on equivalent bands used for singles as
a % of AWOTE where the couple’s AWOTE is defined as (Male AWOTE + Female AWOTE).
Note: The actual incomes of the males and females used in each band differ based on
the average salaries of couples who fall within that band using data from the ATO 2%
Sample File.
*	 Estimated with analysis of ABS, APRA and Rice Warner internal data
12
Personal Wealth:
•	 Distributions of personal wealth are taken from the ABS Survey of Income and Housing
2013–14 and segmented by state, gender, income and marital status
•	 4.27% average personal wealth saving rate (varies by income) in line with Rice Warner’s
Personal Investments report 2015.
•	 6.27% pa investment return on personal wealth.
13
Appendix B –
Changes to method and average savings adequacy
B.1 Change to Methodology
As was noted at the start of this report, due to improvements in methodology and the
metrics underlying this report it is no longer possible to compare the retire readiness across
previous years’ reports. In particular, in earlier editions the modelled results were calculated
using a modified version of Rice Warner’s savings gap model. The index was calculated as
the percentage of Australian members’ assets at retirement compared to their needs net of
the age pension, as per:
Figure 1. Retirement Ready calculation 2014
RRI =
Balance
Needs – Age Pension
For the 2015 results, the savings gap model was replaced with an aggregation of the Australian
population using our Retirement Projection engine and population data from the ABS.
The Retire Ready Index is calculated as the population weighted proportion of individuals who
meet this benchmark.
B.2 Average savings adequacy
The approach to calculating the index also changed slightly; the impact of the age pension
was added to the balance at retirement, rather than subtracted from needs. As such the
calculation became:
Figure 2. Average Savings Adequacy 2015
ASA =
Balance + Potential Age Pension
Needs
‘Potential age pension’ refers to the age pension that a member would receive on the condition
that they met the requirements for retirement adequacy. That is, we calculate the assets a
member needs to support the income defined by one of the measures of adequacy and base
their Age Pension income on this amount of assets. The aggregate Age Pension payments
are then discounted to retirement and combined with the member’s balance to determine the
Average Saving Adequacy (ASA).
Given these changes and in the interest of providing scope for approximate cross-period
comparison this section provides a sample of the results pertaining to the Average Savings
Adequacy metric.
14
B.3
Average retirement savings adequacy by age and gender including the Age Pension
(ASFA)
Age  Gender Singles Couples Total
Male Female
25–29 103% 91% 140% 112%
30–34 111% 96% 135% 121%
35–39 106% 93% 136% 122%
40–44 101% 86% 131% 116%
45–49 99% 80% 126% 111%
50–54 96% 80% 128% 111%
55–59 95% 76% 126% 108%
60–64 97% 75% 122% 106%
Total 102% 85% 131% 114%
B.4
Average retirement savings adequacy by age and gender excluding the Age Pension
(ASFA)
Age  Gender Singles Couples Total
Male Female
25–29 61% 50% 85% 66%
30–34 67% 55% 81% 72%
35–39 62% 51% 80% 71%
40–44 57% 44% 75% 65%
45–49 54% 38% 70% 60%
50–54 51% 37% 72% 59%
55–59 48% 33% 69% 57%
60–64 49% 30% 65% 53%
Total 58% 43% 75% 64%
15
B.5
Average retirement savings adequacy by income and gender including Age Pension
(ASFA)
Annual Income ($) Singles Total
Male Female
nil 50% 50% 50%
under 46,800 67% 63% 65%
46,800–58,500 86% 80% 83%
58,500–66,300 98% 91% 95%
66,300–78,000 114% 106% 110%
78,000–93,600 139% 126% 133%
93,600–140,400 187% 163% 177%
over 140,400 290% 249% 277%
Total 102% 85% 94%
B.6
Average retirement savings adequacy by income and gender 2015 including Age
Pension (ASFA)
Annual Income ($) Couple
nil 80%
under 91,500 99%
91,500–114,300 116%
114,300–129,600 124%
129,600–152,400 137%
152,400–182,900 161%
182,900–274,400 202%
over 274,400 285%
Total 131%
16
B.7
Average retirement savings adequacy by State and gender 2015 including Age Pension
Annual Income ($) Singles Couples Total
Male Female
NSW 103% 87% 131% 114%
VIC 100% 85% 132% 114%
QLD 100% 83% 130% 113%
ACT 133% 117% 141% 134%
WA 114% 87% 129% 117%
SA 92% 79% 129% 109%
TAS 87% 75% 132% 109%
NT 100% 83% 126% 109%
Total 102% 85% 131% 114%
B.8
Required savings at retirement by age and gender to achieve ASFA Comfortable
standard (today’s dollars)
Male Female Couples
25–29 599,000 625,000 677,000
30–34 560,000 625,000 674,000
35–39 562,000 600,000 637,000
40–44 560,000 596,000 639,000
45–49 531,000 597,000 637,000
50–54 527,000 564,000 602,000
55–59 499,000 562,000 603,000
60–64 466,000 531,000 569,000
17
Stay Connected
commbank.com.au
Visit
In branch
Call
1800 241 996
Things you should know: About the CommBank Retire Ready Index. The CommBank Retire Ready Index was developed in collaboration with Rice Warner
Pty Limited (Rice Warner), and is based on data from more than 10 million Australian superannuation accounts as at 31 December 2015 along with personal
wealth data from the Australian Bureau of Statistics. The Index is a measure of the percentage of assets Australians are likely to have at retirement relative
to their comfortable retirement needs.This has been defined according to the Association of Superannuation Funds of Australia (ASFA) comfortable standard
of living which is currently $43,372 p.a. for a single and $59,619 p.a. for a couple.The CommBank Retire Ready Index assumes a retirement age of 67 and
includes the Age Pension asset test changes which came into effect on 1 January 2017.The data excludes the family home as this asset is not typically used
for retirement income purposes.This document has been prepared without considering your objectives, financial situation or needs.You should, before acting
on this advice, consider its appropriateness to your circumstances. Commonwealth Bank of Australia ABN 48 123 123 124 AFSL 234945 Call 13 2221 or
visit commbank.com.au 23125/0217

More Related Content

What's hot

2007 Social Security Consumer Math
2007 Social Security  Consumer Math2007 Social Security  Consumer Math
2007 Social Security Consumer Mathsoni2181
 
2007 Social Security Consumer Math
2007 Social Security  Consumer Math2007 Social Security  Consumer Math
2007 Social Security Consumer Mathsoni2181
 
Lifestyle Planning | Jester Financial
Lifestyle Planning | Jester FinancialLifestyle Planning | Jester Financial
Lifestyle Planning | Jester Financialjesterfinancial
 
Long-Term Care Employee education deck
Long-Term Care Employee education deckLong-Term Care Employee education deck
Long-Term Care Employee education deckLTCI Partners
 
Leadership Anchorage debate with Vic Fischer (5.3.2014)
Leadership Anchorage debate with Vic Fischer (5.3.2014)Leadership Anchorage debate with Vic Fischer (5.3.2014)
Leadership Anchorage debate with Vic Fischer (5.3.2014)Brad Keithley
 
Life insurance-awareness-month-facts
Life insurance-awareness-month-factsLife insurance-awareness-month-facts
Life insurance-awareness-month-factsGen Re
 
Recommendations for Getting a Larger Social Security Check
Recommendations for Getting a Larger Social Security CheckRecommendations for Getting a Larger Social Security Check
Recommendations for Getting a Larger Social Security CheckDavid Giertz
 
Fiscal Policy stump speech (draft 7.27.2013)
Fiscal Policy stump speech (draft 7.27.2013)Fiscal Policy stump speech (draft 7.27.2013)
Fiscal Policy stump speech (draft 7.27.2013)Brad Keithley
 
Ris Fact Slides
Ris Fact SlidesRis Fact Slides
Ris Fact Slidesdjshall
 
Kfs disability 2
Kfs disability 2Kfs disability 2
Kfs disability 2roowah1
 
Savvy social security_client_presentation_03132015
Savvy social security_client_presentation_03132015Savvy social security_client_presentation_03132015
Savvy social security_client_presentation_03132015ndouglasFI
 
10 Things You Should Know About Social Security Planning
10 Things You Should Know About Social Security Planning10 Things You Should Know About Social Security Planning
10 Things You Should Know About Social Security PlanningBrown Smith Wallace
 
Understanding Social Security and Medicare
Understanding Social Security and MedicareUnderstanding Social Security and Medicare
Understanding Social Security and MedicareJeff Ferretta RFC
 
State Pensions-- Working Towards a Gradual Turnaround
State Pensions-- Working Towards a Gradual TurnaroundState Pensions-- Working Towards a Gradual Turnaround
State Pensions-- Working Towards a Gradual TurnaroundEmily Jackson
 
Social Security
Social SecuritySocial Security
Social SecurityMigdal Eden
 
LTC Take Charge Of Your Future
LTC Take Charge Of Your FutureLTC Take Charge Of Your Future
LTC Take Charge Of Your FutureAlexShibicky
 
social security cola increase
social security cola increasesocial security cola increase
social security cola increaseFinnKevin
 
NJCFE symposium saving strategies for those who don't save-12-11
NJCFE symposium saving strategies for those who don't save-12-11NJCFE symposium saving strategies for those who don't save-12-11
NJCFE symposium saving strategies for those who don't save-12-11Barbara O'Neill
 
What is Feedsy
What is FeedsyWhat is Feedsy
What is FeedsyFeedsy
 
MIS Assignment
MIS AssignmentMIS Assignment
MIS AssignmentTaylor Peluso
 

What's hot (20)

2007 Social Security Consumer Math
2007 Social Security  Consumer Math2007 Social Security  Consumer Math
2007 Social Security Consumer Math
 
2007 Social Security Consumer Math
2007 Social Security  Consumer Math2007 Social Security  Consumer Math
2007 Social Security Consumer Math
 
Lifestyle Planning | Jester Financial
Lifestyle Planning | Jester FinancialLifestyle Planning | Jester Financial
Lifestyle Planning | Jester Financial
 
Long-Term Care Employee education deck
Long-Term Care Employee education deckLong-Term Care Employee education deck
Long-Term Care Employee education deck
 
Leadership Anchorage debate with Vic Fischer (5.3.2014)
Leadership Anchorage debate with Vic Fischer (5.3.2014)Leadership Anchorage debate with Vic Fischer (5.3.2014)
Leadership Anchorage debate with Vic Fischer (5.3.2014)
 
Life insurance-awareness-month-facts
Life insurance-awareness-month-factsLife insurance-awareness-month-facts
Life insurance-awareness-month-facts
 
Recommendations for Getting a Larger Social Security Check
Recommendations for Getting a Larger Social Security CheckRecommendations for Getting a Larger Social Security Check
Recommendations for Getting a Larger Social Security Check
 
Fiscal Policy stump speech (draft 7.27.2013)
Fiscal Policy stump speech (draft 7.27.2013)Fiscal Policy stump speech (draft 7.27.2013)
Fiscal Policy stump speech (draft 7.27.2013)
 
Ris Fact Slides
Ris Fact SlidesRis Fact Slides
Ris Fact Slides
 
Kfs disability 2
Kfs disability 2Kfs disability 2
Kfs disability 2
 
Savvy social security_client_presentation_03132015
Savvy social security_client_presentation_03132015Savvy social security_client_presentation_03132015
Savvy social security_client_presentation_03132015
 
10 Things You Should Know About Social Security Planning
10 Things You Should Know About Social Security Planning10 Things You Should Know About Social Security Planning
10 Things You Should Know About Social Security Planning
 
Understanding Social Security and Medicare
Understanding Social Security and MedicareUnderstanding Social Security and Medicare
Understanding Social Security and Medicare
 
State Pensions-- Working Towards a Gradual Turnaround
State Pensions-- Working Towards a Gradual TurnaroundState Pensions-- Working Towards a Gradual Turnaround
State Pensions-- Working Towards a Gradual Turnaround
 
Social Security
Social SecuritySocial Security
Social Security
 
LTC Take Charge Of Your Future
LTC Take Charge Of Your FutureLTC Take Charge Of Your Future
LTC Take Charge Of Your Future
 
social security cola increase
social security cola increasesocial security cola increase
social security cola increase
 
NJCFE symposium saving strategies for those who don't save-12-11
NJCFE symposium saving strategies for those who don't save-12-11NJCFE symposium saving strategies for those who don't save-12-11
NJCFE symposium saving strategies for those who don't save-12-11
 
What is Feedsy
What is FeedsyWhat is Feedsy
What is Feedsy
 
MIS Assignment
MIS AssignmentMIS Assignment
MIS Assignment
 

Viewers also liked

Slideshow JEF Edinburgh civictech
Slideshow JEF Edinburgh civictechSlideshow JEF Edinburgh civictech
Slideshow JEF Edinburgh civictechValentin Chaput
 
fermacell focus - De voordelen op een rij
fermacell focus - De voordelen op een rijfermacell focus - De voordelen op een rij
fermacell focus - De voordelen op een rijFermacell BV
 
5617 african american inventors lesson plan
5617   african american inventors lesson plan5617   african american inventors lesson plan
5617 african american inventors lesson planclogan0620
 
Prevention control and eradication of Zoonoses
Prevention control and eradication of ZoonosesPrevention control and eradication of Zoonoses
Prevention control and eradication of ZoonosesDr.Sharon Abdul Jameela
 
7 Processes of Prince2
7 Processes of Prince27 Processes of Prince2
7 Processes of Prince2Barry Hodge
 
Impact of spot fixing on cricket
Impact of spot fixing on cricket Impact of spot fixing on cricket
Impact of spot fixing on cricket Monjur Mahmud
 

Viewers also liked (7)

Slideshow JEF Edinburgh civictech
Slideshow JEF Edinburgh civictechSlideshow JEF Edinburgh civictech
Slideshow JEF Edinburgh civictech
 
Essay 1
Essay 1Essay 1
Essay 1
 
fermacell focus - De voordelen op een rij
fermacell focus - De voordelen op een rijfermacell focus - De voordelen op een rij
fermacell focus - De voordelen op een rij
 
5617 african american inventors lesson plan
5617   african american inventors lesson plan5617   african american inventors lesson plan
5617 african american inventors lesson plan
 
Prevention control and eradication of Zoonoses
Prevention control and eradication of ZoonosesPrevention control and eradication of Zoonoses
Prevention control and eradication of Zoonoses
 
7 Processes of Prince2
7 Processes of Prince27 Processes of Prince2
7 Processes of Prince2
 
Impact of spot fixing on cricket
Impact of spot fixing on cricket Impact of spot fixing on cricket
Impact of spot fixing on cricket
 

Similar to CommBank Retire Ready Index

ForRicherForPoorerRetirementIncomes2WEB
ForRicherForPoorerRetirementIncomes2WEBForRicherForPoorerRetirementIncomes2WEB
ForRicherForPoorerRetirementIncomes2WEBElayne Grace
 
Comfort in retirement
Comfort in retirementComfort in retirement
Comfort in retirementTanweer Khalfay
 
Aegis financial planning smart money magazine
Aegis financial planning smart money magazineAegis financial planning smart money magazine
Aegis financial planning smart money magazineAkash Gupta
 
hsbc future of-retirement-uk-report
hsbc future of-retirement-uk-reporthsbc future of-retirement-uk-report
hsbc future of-retirement-uk-reportcoussey
 
IBB Wealth Nov 2022 Issue.pdf
IBB Wealth Nov 2022 Issue.pdfIBB Wealth Nov 2022 Issue.pdf
IBB Wealth Nov 2022 Issue.pdfIBB Law
 
"If only I had"... LV= insights into retirement planning webinar
"If only I had"... LV= insights into retirement planning webinar"If only I had"... LV= insights into retirement planning webinar
"If only I had"... LV= insights into retirement planning webinarILC- UK
 
A simple guide to retirement
A simple guide to retirementA simple guide to retirement
A simple guide to retirementferelrew
 
The-Fear-of-Running-Out-Lifetime-Income-and-The-Annuity-Puzzle
The-Fear-of-Running-Out-Lifetime-Income-and-The-Annuity-PuzzleThe-Fear-of-Running-Out-Lifetime-Income-and-The-Annuity-Puzzle
The-Fear-of-Running-Out-Lifetime-Income-and-The-Annuity-PuzzleHenry Tapper
 
Kfs long term care
Kfs long term careKfs long term care
Kfs long term careroowah1
 
Navigating Your Financial Future
Navigating Your Financial FutureNavigating Your Financial Future
Navigating Your Financial Futuregrant_ackerman
 
The Role of Home Equity in Australian Retirement
The Role of Home Equity in Australian RetirementThe Role of Home Equity in Australian Retirement
The Role of Home Equity in Australian RetirementHousehold Capital Pty Ltd
 
Making your money last in retirement - Aviva's longevity report
Making your money last in retirement  - Aviva's longevity reportMaking your money last in retirement  - Aviva's longevity report
Making your money last in retirement - Aviva's longevity reportAviva plc
 
Why You Should Be Concerned About Your Retirement
Why You Should Be Concerned About Your RetirementWhy You Should Be Concerned About Your Retirement
Why You Should Be Concerned About Your Retirementbributcher
 
MMP Report - Financial Fitness of Working Australians Nov2015
MMP Report - Financial Fitness of Working Australians Nov2015MMP Report - Financial Fitness of Working Australians Nov2015
MMP Report - Financial Fitness of Working Australians Nov2015Paul Feeney
 
These superannuation myths can impact your retirement savings converted (2)
These superannuation myths can impact your retirement savings converted (2)These superannuation myths can impact your retirement savings converted (2)
These superannuation myths can impact your retirement savings converted (2)SMART Financial Advisory Pty Ltd
 
Investor pulse-brochure-va-us
Investor pulse-brochure-va-usInvestor pulse-brochure-va-us
Investor pulse-brochure-va-usBFSICM
 
Learning about Social Security
Learning about Social Security Learning about Social Security
Learning about Social Security Van Richards
 

Similar to CommBank Retire Ready Index (20)

ForRicherForPoorerRetirementIncomes2WEB
ForRicherForPoorerRetirementIncomes2WEBForRicherForPoorerRetirementIncomes2WEB
ForRicherForPoorerRetirementIncomes2WEB
 
Retire SMART (3)
Retire SMART (3)Retire SMART (3)
Retire SMART (3)
 
Comfort in retirement
Comfort in retirementComfort in retirement
Comfort in retirement
 
Aegis financial planning smart money magazine
Aegis financial planning smart money magazineAegis financial planning smart money magazine
Aegis financial planning smart money magazine
 
Seniorleads (senior leads) retire smart
Seniorleads (senior leads) retire smartSeniorleads (senior leads) retire smart
Seniorleads (senior leads) retire smart
 
hsbc future of-retirement-uk-report
hsbc future of-retirement-uk-reporthsbc future of-retirement-uk-report
hsbc future of-retirement-uk-report
 
IBB Wealth Nov 2022 Issue.pdf
IBB Wealth Nov 2022 Issue.pdfIBB Wealth Nov 2022 Issue.pdf
IBB Wealth Nov 2022 Issue.pdf
 
"If only I had"... LV= insights into retirement planning webinar
"If only I had"... LV= insights into retirement planning webinar"If only I had"... LV= insights into retirement planning webinar
"If only I had"... LV= insights into retirement planning webinar
 
Adviceiq save more, need less later
Adviceiq save more, need less laterAdviceiq save more, need less later
Adviceiq save more, need less later
 
A simple guide to retirement
A simple guide to retirementA simple guide to retirement
A simple guide to retirement
 
The-Fear-of-Running-Out-Lifetime-Income-and-The-Annuity-Puzzle
The-Fear-of-Running-Out-Lifetime-Income-and-The-Annuity-PuzzleThe-Fear-of-Running-Out-Lifetime-Income-and-The-Annuity-Puzzle
The-Fear-of-Running-Out-Lifetime-Income-and-The-Annuity-Puzzle
 
Kfs long term care
Kfs long term careKfs long term care
Kfs long term care
 
Navigating Your Financial Future
Navigating Your Financial FutureNavigating Your Financial Future
Navigating Your Financial Future
 
The Role of Home Equity in Australian Retirement
The Role of Home Equity in Australian RetirementThe Role of Home Equity in Australian Retirement
The Role of Home Equity in Australian Retirement
 
Making your money last in retirement - Aviva's longevity report
Making your money last in retirement  - Aviva's longevity reportMaking your money last in retirement  - Aviva's longevity report
Making your money last in retirement - Aviva's longevity report
 
Why You Should Be Concerned About Your Retirement
Why You Should Be Concerned About Your RetirementWhy You Should Be Concerned About Your Retirement
Why You Should Be Concerned About Your Retirement
 
MMP Report - Financial Fitness of Working Australians Nov2015
MMP Report - Financial Fitness of Working Australians Nov2015MMP Report - Financial Fitness of Working Australians Nov2015
MMP Report - Financial Fitness of Working Australians Nov2015
 
These superannuation myths can impact your retirement savings converted (2)
These superannuation myths can impact your retirement savings converted (2)These superannuation myths can impact your retirement savings converted (2)
These superannuation myths can impact your retirement savings converted (2)
 
Investor pulse-brochure-va-us
Investor pulse-brochure-va-usInvestor pulse-brochure-va-us
Investor pulse-brochure-va-us
 
Learning about Social Security
Learning about Social Security Learning about Social Security
Learning about Social Security
 

More from Jonathan Steffanoni

QMV Legal & Regulatory Update - March 2019
QMV Legal & Regulatory Update - March 2019QMV Legal & Regulatory Update - March 2019
QMV Legal & Regulatory Update - March 2019Jonathan Steffanoni
 
QMV Legal & Regulatory Update - February 2019
QMV Legal & Regulatory Update - February 2019QMV Legal & Regulatory Update - February 2019
QMV Legal & Regulatory Update - February 2019Jonathan Steffanoni
 
QMV Regulatory Update - January 2019
QMV Regulatory Update - January 2019QMV Regulatory Update - January 2019
QMV Regulatory Update - January 2019Jonathan Steffanoni
 
QMV Pensions & Superannuation Regulatory Update - December 2018
QMV Pensions & Superannuation Regulatory Update - December 2018QMV Pensions & Superannuation Regulatory Update - December 2018
QMV Pensions & Superannuation Regulatory Update - December 2018Jonathan Steffanoni
 
QMV Legal & Regulatory Update - November 2018
QMV Legal & Regulatory Update - November 2018QMV Legal & Regulatory Update - November 2018
QMV Legal & Regulatory Update - November 2018Jonathan Steffanoni
 
QMV Pensions & Superannuation Regulatory Update - October 2018
QMV Pensions & Superannuation Regulatory Update - October 2018QMV Pensions & Superannuation Regulatory Update - October 2018
QMV Pensions & Superannuation Regulatory Update - October 2018Jonathan Steffanoni
 
QMV Pensions & Superannuation Regulatory Update - September 2018
QMV Pensions & Superannuation Regulatory Update - September 2018QMV Pensions & Superannuation Regulatory Update - September 2018
QMV Pensions & Superannuation Regulatory Update - September 2018Jonathan Steffanoni
 
QMV Regulatory Update - August 2018
QMV Regulatory Update - August 2018QMV Regulatory Update - August 2018
QMV Regulatory Update - August 2018Jonathan Steffanoni
 
QMV Regulatory Update - July 2018
QMV Regulatory Update - July 2018QMV Regulatory Update - July 2018
QMV Regulatory Update - July 2018Jonathan Steffanoni
 
QMV Regulatory Update - June 2018
QMV Regulatory Update - June 2018QMV Regulatory Update - June 2018
QMV Regulatory Update - June 2018Jonathan Steffanoni
 
QMV Regulatory Update - May 2018
QMV Regulatory Update - May 2018QMV Regulatory Update - May 2018
QMV Regulatory Update - May 2018Jonathan Steffanoni
 
QMV Commonwealth Budget Update - 2018-19
QMV Commonwealth Budget Update - 2018-19QMV Commonwealth Budget Update - 2018-19
QMV Commonwealth Budget Update - 2018-19Jonathan Steffanoni
 
QMV Regulatory Update - April 2018
QMV Regulatory Update - April 2018QMV Regulatory Update - April 2018
QMV Regulatory Update - April 2018Jonathan Steffanoni
 
QMV Regulatory Update - March 2018
QMV Regulatory Update - March 2018QMV Regulatory Update - March 2018
QMV Regulatory Update - March 2018Jonathan Steffanoni
 
QMV Regulatory Update - January 2018 (and late December 2017)
QMV Regulatory Update - January 2018 (and late December 2017)QMV Regulatory Update - January 2018 (and late December 2017)
QMV Regulatory Update - January 2018 (and late December 2017)Jonathan Steffanoni
 
QMV Regulatory Update - November 2017
QMV Regulatory Update - November 2017QMV Regulatory Update - November 2017
QMV Regulatory Update - November 2017Jonathan Steffanoni
 
QMV Regulatory Update - October 2017
QMV Regulatory Update - October 2017QMV Regulatory Update - October 2017
QMV Regulatory Update - October 2017Jonathan Steffanoni
 
QMV Superannuation Regulatory Update September 2017
QMV Superannuation Regulatory Update September 2017QMV Superannuation Regulatory Update September 2017
QMV Superannuation Regulatory Update September 2017Jonathan Steffanoni
 
QMV Regulatory Update August 2017
QMV Regulatory Update August 2017QMV Regulatory Update August 2017
QMV Regulatory Update August 2017Jonathan Steffanoni
 
APRA Letter to RSE Licensees on Operational Governance
APRA Letter to RSE Licensees on Operational GovernanceAPRA Letter to RSE Licensees on Operational Governance
APRA Letter to RSE Licensees on Operational GovernanceJonathan Steffanoni
 

More from Jonathan Steffanoni (20)

QMV Legal & Regulatory Update - March 2019
QMV Legal & Regulatory Update - March 2019QMV Legal & Regulatory Update - March 2019
QMV Legal & Regulatory Update - March 2019
 
QMV Legal & Regulatory Update - February 2019
QMV Legal & Regulatory Update - February 2019QMV Legal & Regulatory Update - February 2019
QMV Legal & Regulatory Update - February 2019
 
QMV Regulatory Update - January 2019
QMV Regulatory Update - January 2019QMV Regulatory Update - January 2019
QMV Regulatory Update - January 2019
 
QMV Pensions & Superannuation Regulatory Update - December 2018
QMV Pensions & Superannuation Regulatory Update - December 2018QMV Pensions & Superannuation Regulatory Update - December 2018
QMV Pensions & Superannuation Regulatory Update - December 2018
 
QMV Legal & Regulatory Update - November 2018
QMV Legal & Regulatory Update - November 2018QMV Legal & Regulatory Update - November 2018
QMV Legal & Regulatory Update - November 2018
 
QMV Pensions & Superannuation Regulatory Update - October 2018
QMV Pensions & Superannuation Regulatory Update - October 2018QMV Pensions & Superannuation Regulatory Update - October 2018
QMV Pensions & Superannuation Regulatory Update - October 2018
 
QMV Pensions & Superannuation Regulatory Update - September 2018
QMV Pensions & Superannuation Regulatory Update - September 2018QMV Pensions & Superannuation Regulatory Update - September 2018
QMV Pensions & Superannuation Regulatory Update - September 2018
 
QMV Regulatory Update - August 2018
QMV Regulatory Update - August 2018QMV Regulatory Update - August 2018
QMV Regulatory Update - August 2018
 
QMV Regulatory Update - July 2018
QMV Regulatory Update - July 2018QMV Regulatory Update - July 2018
QMV Regulatory Update - July 2018
 
QMV Regulatory Update - June 2018
QMV Regulatory Update - June 2018QMV Regulatory Update - June 2018
QMV Regulatory Update - June 2018
 
QMV Regulatory Update - May 2018
QMV Regulatory Update - May 2018QMV Regulatory Update - May 2018
QMV Regulatory Update - May 2018
 
QMV Commonwealth Budget Update - 2018-19
QMV Commonwealth Budget Update - 2018-19QMV Commonwealth Budget Update - 2018-19
QMV Commonwealth Budget Update - 2018-19
 
QMV Regulatory Update - April 2018
QMV Regulatory Update - April 2018QMV Regulatory Update - April 2018
QMV Regulatory Update - April 2018
 
QMV Regulatory Update - March 2018
QMV Regulatory Update - March 2018QMV Regulatory Update - March 2018
QMV Regulatory Update - March 2018
 
QMV Regulatory Update - January 2018 (and late December 2017)
QMV Regulatory Update - January 2018 (and late December 2017)QMV Regulatory Update - January 2018 (and late December 2017)
QMV Regulatory Update - January 2018 (and late December 2017)
 
QMV Regulatory Update - November 2017
QMV Regulatory Update - November 2017QMV Regulatory Update - November 2017
QMV Regulatory Update - November 2017
 
QMV Regulatory Update - October 2017
QMV Regulatory Update - October 2017QMV Regulatory Update - October 2017
QMV Regulatory Update - October 2017
 
QMV Superannuation Regulatory Update September 2017
QMV Superannuation Regulatory Update September 2017QMV Superannuation Regulatory Update September 2017
QMV Superannuation Regulatory Update September 2017
 
QMV Regulatory Update August 2017
QMV Regulatory Update August 2017QMV Regulatory Update August 2017
QMV Regulatory Update August 2017
 
APRA Letter to RSE Licensees on Operational Governance
APRA Letter to RSE Licensees on Operational GovernanceAPRA Letter to RSE Licensees on Operational Governance
APRA Letter to RSE Licensees on Operational Governance
 

Recently uploaded

Quarter 4- Module 3 Principles of Marketing
Quarter 4- Module 3 Principles of MarketingQuarter 4- Module 3 Principles of Marketing
Quarter 4- Module 3 Principles of MarketingMaristelaRamos12
 
The Economic History of the U.S. Lecture 30.pdf
The Economic History of the U.S. Lecture 30.pdfThe Economic History of the U.S. Lecture 30.pdf
The Economic History of the U.S. Lecture 30.pdfGale Pooley
 
The Economic History of the U.S. Lecture 22.pdf
The Economic History of the U.S. Lecture 22.pdfThe Economic History of the U.S. Lecture 22.pdf
The Economic History of the U.S. Lecture 22.pdfGale Pooley
 
TEST BANK For Corporate Finance, 13th Edition By Stephen Ross, Randolph Weste...
TEST BANK For Corporate Finance, 13th Edition By Stephen Ross, Randolph Weste...TEST BANK For Corporate Finance, 13th Edition By Stephen Ross, Randolph Weste...
TEST BANK For Corporate Finance, 13th Edition By Stephen Ross, Randolph Weste...ssifa0344
 
Dharavi Russian callg Girls, { 09892124323 } || Call Girl In Mumbai ...
Dharavi Russian callg Girls, { 09892124323 } || Call Girl In Mumbai ...Dharavi Russian callg Girls, { 09892124323 } || Call Girl In Mumbai ...
Dharavi Russian callg Girls, { 09892124323 } || Call Girl In Mumbai ...Pooja Nehwal
 
The Economic History of the U.S. Lecture 17.pdf
The Economic History of the U.S. Lecture 17.pdfThe Economic History of the U.S. Lecture 17.pdf
The Economic History of the U.S. Lecture 17.pdfGale Pooley
 
VVIP Pune Call Girls Katraj (7001035870) Pune Escorts Nearby with Complete Sa...
VVIP Pune Call Girls Katraj (7001035870) Pune Escorts Nearby with Complete Sa...VVIP Pune Call Girls Katraj (7001035870) Pune Escorts Nearby with Complete Sa...
VVIP Pune Call Girls Katraj (7001035870) Pune Escorts Nearby with Complete Sa...Call Girls in Nagpur High Profile
 
VIP Kolkata Call Girl Serampore 👉 8250192130 Available With Room
VIP Kolkata Call Girl Serampore 👉 8250192130  Available With RoomVIP Kolkata Call Girl Serampore 👉 8250192130  Available With Room
VIP Kolkata Call Girl Serampore 👉 8250192130 Available With Roomdivyansh0kumar0
 
Call Girls Service Nagpur Maya Call 7001035870 Meet With Nagpur Escorts
Call Girls Service Nagpur Maya Call 7001035870 Meet With Nagpur EscortsCall Girls Service Nagpur Maya Call 7001035870 Meet With Nagpur Escorts
Call Girls Service Nagpur Maya Call 7001035870 Meet With Nagpur Escortsranjana rawat
 
Independent Call Girl Number in Kurla Mumbai📲 Pooja Nehwal 9892124323 💞 Full ...
Independent Call Girl Number in Kurla Mumbai📲 Pooja Nehwal 9892124323 💞 Full ...Independent Call Girl Number in Kurla Mumbai📲 Pooja Nehwal 9892124323 💞 Full ...
Independent Call Girl Number in Kurla Mumbai📲 Pooja Nehwal 9892124323 💞 Full ...Pooja Nehwal
 
VIP Call Girls LB Nagar ( Hyderabad ) Phone 8250192130 | ₹5k To 25k With Room...
VIP Call Girls LB Nagar ( Hyderabad ) Phone 8250192130 | ₹5k To 25k With Room...VIP Call Girls LB Nagar ( Hyderabad ) Phone 8250192130 | ₹5k To 25k With Room...
VIP Call Girls LB Nagar ( Hyderabad ) Phone 8250192130 | ₹5k To 25k With Room...Suhani Kapoor
 
Solution Manual for Financial Accounting, 11th Edition by Robert Libby, Patri...
Solution Manual for Financial Accounting, 11th Edition by Robert Libby, Patri...Solution Manual for Financial Accounting, 11th Edition by Robert Libby, Patri...
Solution Manual for Financial Accounting, 11th Edition by Robert Libby, Patri...ssifa0344
 
VIP Kolkata Call Girl Jodhpur Park 👉 8250192130 Available With Room
VIP Kolkata Call Girl Jodhpur Park 👉 8250192130  Available With RoomVIP Kolkata Call Girl Jodhpur Park 👉 8250192130  Available With Room
VIP Kolkata Call Girl Jodhpur Park 👉 8250192130 Available With Roomdivyansh0kumar0
 
VIP Call Girls Service Dilsukhnagar Hyderabad Call +91-8250192130
VIP Call Girls Service Dilsukhnagar Hyderabad Call +91-8250192130VIP Call Girls Service Dilsukhnagar Hyderabad Call +91-8250192130
VIP Call Girls Service Dilsukhnagar Hyderabad Call +91-8250192130Suhani Kapoor
 
Call US 📞 9892124323 ✅ Kurla Call Girls In Kurla ( Mumbai ) secure service
Call US 📞 9892124323 ✅ Kurla Call Girls In Kurla ( Mumbai ) secure serviceCall US 📞 9892124323 ✅ Kurla Call Girls In Kurla ( Mumbai ) secure service
Call US 📞 9892124323 ✅ Kurla Call Girls In Kurla ( Mumbai ) secure servicePooja Nehwal
 
The Economic History of the U.S. Lecture 18.pdf
The Economic History of the U.S. Lecture 18.pdfThe Economic History of the U.S. Lecture 18.pdf
The Economic History of the U.S. Lecture 18.pdfGale Pooley
 
Vip B Aizawl Call Girls #9907093804 Contact Number Escorts Service Aizawl
Vip B Aizawl Call Girls #9907093804 Contact Number Escorts Service AizawlVip B Aizawl Call Girls #9907093804 Contact Number Escorts Service Aizawl
Vip B Aizawl Call Girls #9907093804 Contact Number Escorts Service Aizawlmakika9823
 
Bladex Earnings Call Presentation 1Q2024
Bladex Earnings Call Presentation 1Q2024Bladex Earnings Call Presentation 1Q2024
Bladex Earnings Call Presentation 1Q2024Bladex
 
Instant Issue Debit Cards - School Designs
Instant Issue Debit Cards - School DesignsInstant Issue Debit Cards - School Designs
Instant Issue Debit Cards - School Designsegoetzinger
 

Recently uploaded (20)

Quarter 4- Module 3 Principles of Marketing
Quarter 4- Module 3 Principles of MarketingQuarter 4- Module 3 Principles of Marketing
Quarter 4- Module 3 Principles of Marketing
 
The Economic History of the U.S. Lecture 30.pdf
The Economic History of the U.S. Lecture 30.pdfThe Economic History of the U.S. Lecture 30.pdf
The Economic History of the U.S. Lecture 30.pdf
 
The Economic History of the U.S. Lecture 22.pdf
The Economic History of the U.S. Lecture 22.pdfThe Economic History of the U.S. Lecture 22.pdf
The Economic History of the U.S. Lecture 22.pdf
 
TEST BANK For Corporate Finance, 13th Edition By Stephen Ross, Randolph Weste...
TEST BANK For Corporate Finance, 13th Edition By Stephen Ross, Randolph Weste...TEST BANK For Corporate Finance, 13th Edition By Stephen Ross, Randolph Weste...
TEST BANK For Corporate Finance, 13th Edition By Stephen Ross, Randolph Weste...
 
Dharavi Russian callg Girls, { 09892124323 } || Call Girl In Mumbai ...
Dharavi Russian callg Girls, { 09892124323 } || Call Girl In Mumbai ...Dharavi Russian callg Girls, { 09892124323 } || Call Girl In Mumbai ...
Dharavi Russian callg Girls, { 09892124323 } || Call Girl In Mumbai ...
 
The Economic History of the U.S. Lecture 17.pdf
The Economic History of the U.S. Lecture 17.pdfThe Economic History of the U.S. Lecture 17.pdf
The Economic History of the U.S. Lecture 17.pdf
 
VVIP Pune Call Girls Katraj (7001035870) Pune Escorts Nearby with Complete Sa...
VVIP Pune Call Girls Katraj (7001035870) Pune Escorts Nearby with Complete Sa...VVIP Pune Call Girls Katraj (7001035870) Pune Escorts Nearby with Complete Sa...
VVIP Pune Call Girls Katraj (7001035870) Pune Escorts Nearby with Complete Sa...
 
VIP Kolkata Call Girl Serampore 👉 8250192130 Available With Room
VIP Kolkata Call Girl Serampore 👉 8250192130  Available With RoomVIP Kolkata Call Girl Serampore 👉 8250192130  Available With Room
VIP Kolkata Call Girl Serampore 👉 8250192130 Available With Room
 
Call Girls Service Nagpur Maya Call 7001035870 Meet With Nagpur Escorts
Call Girls Service Nagpur Maya Call 7001035870 Meet With Nagpur EscortsCall Girls Service Nagpur Maya Call 7001035870 Meet With Nagpur Escorts
Call Girls Service Nagpur Maya Call 7001035870 Meet With Nagpur Escorts
 
Independent Call Girl Number in Kurla Mumbai📲 Pooja Nehwal 9892124323 💞 Full ...
Independent Call Girl Number in Kurla Mumbai📲 Pooja Nehwal 9892124323 💞 Full ...Independent Call Girl Number in Kurla Mumbai📲 Pooja Nehwal 9892124323 💞 Full ...
Independent Call Girl Number in Kurla Mumbai📲 Pooja Nehwal 9892124323 💞 Full ...
 
VIP Call Girls LB Nagar ( Hyderabad ) Phone 8250192130 | ₹5k To 25k With Room...
VIP Call Girls LB Nagar ( Hyderabad ) Phone 8250192130 | ₹5k To 25k With Room...VIP Call Girls LB Nagar ( Hyderabad ) Phone 8250192130 | ₹5k To 25k With Room...
VIP Call Girls LB Nagar ( Hyderabad ) Phone 8250192130 | ₹5k To 25k With Room...
 
Solution Manual for Financial Accounting, 11th Edition by Robert Libby, Patri...
Solution Manual for Financial Accounting, 11th Edition by Robert Libby, Patri...Solution Manual for Financial Accounting, 11th Edition by Robert Libby, Patri...
Solution Manual for Financial Accounting, 11th Edition by Robert Libby, Patri...
 
VIP Kolkata Call Girl Jodhpur Park 👉 8250192130 Available With Room
VIP Kolkata Call Girl Jodhpur Park 👉 8250192130  Available With RoomVIP Kolkata Call Girl Jodhpur Park 👉 8250192130  Available With Room
VIP Kolkata Call Girl Jodhpur Park 👉 8250192130 Available With Room
 
VIP Call Girls Service Dilsukhnagar Hyderabad Call +91-8250192130
VIP Call Girls Service Dilsukhnagar Hyderabad Call +91-8250192130VIP Call Girls Service Dilsukhnagar Hyderabad Call +91-8250192130
VIP Call Girls Service Dilsukhnagar Hyderabad Call +91-8250192130
 
Call US 📞 9892124323 ✅ Kurla Call Girls In Kurla ( Mumbai ) secure service
Call US 📞 9892124323 ✅ Kurla Call Girls In Kurla ( Mumbai ) secure serviceCall US 📞 9892124323 ✅ Kurla Call Girls In Kurla ( Mumbai ) secure service
Call US 📞 9892124323 ✅ Kurla Call Girls In Kurla ( Mumbai ) secure service
 
The Economic History of the U.S. Lecture 18.pdf
The Economic History of the U.S. Lecture 18.pdfThe Economic History of the U.S. Lecture 18.pdf
The Economic History of the U.S. Lecture 18.pdf
 
Vip B Aizawl Call Girls #9907093804 Contact Number Escorts Service Aizawl
Vip B Aizawl Call Girls #9907093804 Contact Number Escorts Service AizawlVip B Aizawl Call Girls #9907093804 Contact Number Escorts Service Aizawl
Vip B Aizawl Call Girls #9907093804 Contact Number Escorts Service Aizawl
 
Commercial Bank Economic Capsule - April 2024
Commercial Bank Economic Capsule - April 2024Commercial Bank Economic Capsule - April 2024
Commercial Bank Economic Capsule - April 2024
 
Bladex Earnings Call Presentation 1Q2024
Bladex Earnings Call Presentation 1Q2024Bladex Earnings Call Presentation 1Q2024
Bladex Earnings Call Presentation 1Q2024
 
Instant Issue Debit Cards - School Designs
Instant Issue Debit Cards - School DesignsInstant Issue Debit Cards - School Designs
Instant Issue Debit Cards - School Designs
 

CommBank Retire Ready Index

  • 1. 011/2017 One in two Australian households expected to be retire ready CommBank Retire Ready Index report released today STRICTLY EMBARGOED until 12:01am on Monday, 6 February 2017: Fifty-three per cent of Australian households are expected to have enough for a comfortable retirement from their combined superannuation savings, personal assets and the Age Pension, according to the latest CommBank Retire Ready Index released today. When the Age Pension is removed, the number of households that can afford a comfortable retirement reduces to 17 per cent, and to just six per cent when the calculations are based on superannuation only. Linda Elkins, Executive General Manager Advice, Commonwealth Bank said: “The good news is that many Australians who may not currently be on track for a comfortable retirement are very close. A little bit of planning could see them reach the comfortable level.” CommBank commissioned Rice Warner to prepare the report, which shows that many Australians are close to achieving the comfortable retirement standard defined by the Association of Superannuation Funds of Australia (ASFA). The report shows that while 53 per cent of Australian households are on track, a further 18 per cent are projected have 80 to 99 per cent of what they will need. The overall results are mixed across cohorts and age groups, and highlight the growing importance of superannuation in helping Australians achieve a comfortable retirement. Millennials will need to save harder for retirement than other cohorts due to their longer life expectancies. Superannuation will play an important role and will comprise, on average, 78 per cent of retirement assets for 25 year-olds working today. “The CommBank Retire Ready Index shows how important superannuation will be for the long term financial well-being of young Australians. Many people do not become engaged with superannuation until later in their working lives, but taking a keener interest in superannuation now, consolidating accounts into one super fund and contributing a little more each week can help younger Australians stay on track for a comfortable retirement,” Ms Elkins said. In the 60-64 year-old age group, couples are expected to be better off than singles but will have reduced retire readiness as they have not received the long term benefits of compulsory Superannuation Guarantee contributions. On the other hand, younger age groups are expected to have less in assets at retirement outside of superannuation when compared with their older counterparts. “The report also shows that more men than women are retire ready. Women have longer life expectancies, and therefore need more assets to maintain a comfortable level of retirement.
  • 2. 011/2017 Women also generally have lower retirement savings due to career breaks during their child bearing years and lower average income levels throughout their working lives.” Ms Elkins also said: “People who are approaching retirement could give their savings a boost by taking advantage of the current superannuation contribution caps before they are reduced on 1 July.” “It is important that people of all ages understand how much they will need to save now to secure their financial futures.” “To help Australians see how on track they are for a comfortable retirement, CommBank has developed a retirement calculator. This is a good first step to see how retire ready you are and is a useful resource to help you get on track to reach your goals for a comfortable retirement,” she said. Five tips to be retire ready 1. If you have more than one superannuation fund, consolidate your accounts to help save on fees 2. Find out how much you’ll need for retirement using our retirement calculator at commbank.com.au/retirementcalculator 3. Develop a retirement plan – talk to a financial planner about your retirement goals 4. Revise your household budget to see if there is any spare cash to put away for retirement, using our budget planner tool at commbank.com.au/budgetplanner 5. Seek advice on how the changes to superannuation on 1 July 2017 will affect your retirement. For more information about the CommBank Retire Ready Index, and to read the full report, visit commbank.com.au/retireready. ENDS Media contact: Robyn Tolhurst Commonwealth Bank Media 02 9118 6919 media@cba.com.au
  • 3. 011/2017 About the CommBank Retire Ready Index The CommBank Retire Ready Index is a comprehensive analysis of the retirement savings and resulting retirement incomes of Australia’s working population. It looks at the percentage of the population aged 25-64 who are projected to have sufficient assets, including superannuation, personal wealth and Age Pension entitlements, to meet a comfortable level of retirement. CommBank has partnered with Rice Warner, one of Australia’s leading and most respected actuarial firms, to develop this report. The report projects the retire readiness of working Australians aged 25-64. Using data from over 10 million member superannuation accounts from Rice Warner’s Super Insights1 along with personal wealth data from the Australian Bureau of Statistics, we have provided a comprehensive picture of the wealth of the Australian population. The data excludes the family home as this asset is not typically used for retirement income purposes. Our analysis captures some of the most important factors affecting retirement adequacy, such as couple/single status and personal wealth. It also provides insights into the retire readiness of Australians by demographic split including:  Age;  Gender;  State; and  Couple/single status. Calculations and projections used in the report look at the anticipated costs of goods and services needed to maintain a comfortable standard of living. These are based on the Association of Superannuation Funds of Australia’s (ASFA) comfortable retirement standard of $43,372 and $59,619 per annum for singles and couples respectively. 1 Superannuation Market Projection Report 2015, Rice Warner
  • 4. READY,SET,GO! FORRETIREMENT. Average Australians willneed… …perannumforacomfortableretirement*COUPLE SINGLE $59,619*$59,619* $43,372*$43,372* HOWMUCH? READYFORRETIREMENT? Femalesrequire morethanmales duetolongerlife expectancies Singlesare worseoff Whilecouples aretrackingwell 27%ofsingle Australiansare expectedtoretirewith enoughretirement assets,includingthe AgePension Womenareexpectedtobeless retirereadythanmendueto loweraverageincomesand careerbreaksduringchild bearingyears.And,theyhave longerlifeexpectancies. ofsinglemalesare expectedtoberetire readycomparedto… ofsinglefemales 75%ofcouplesare expectedtoretirewith enoughretirement assets,includingthe AgePension 53%ofAustralian householdsareexpected tohaveenoughfora comfortableretirement* 47%of Australian householdsmay nothaveenough foracomfortable retirement* Today'syouthwillneed moreinretirement becausetheyare expectedtolivelonger Acoupleandsingle require$640kand $545krespectivelyfora comfortableretirement* 0% 10% 20% 30% 40% 50% 60% 0% 10% 20% 30% 40% 50% 60% 70% 80% Superonly SinglefemalesSinglemalesCouples Super+ Personal Wealth AgePension +Super AgePension +Super +Personal Wealth 53% 53% 47% 40% 17%6% 9% 22% 17% 31% 20% 75% RetireReadyIndex GenderandHouseholdRetirereadinessbyhousehold THEGENDERGAP SETFORRETIREMENT GOFORRETIREMENT 22%31% IWithouttheAgePension IWiththeAgePension 55–59 64% 60–64 49% 45–54 74% 35–44 78% Age25–34 78% CALCULATE howmuchyoumightneedforacomfortableretirementonthe CommBankwebsiteatcommbank.com.au/retirementcalculator FindoutmoreabouttheCommBankRetire ReadyIndexatcommbank.com.au/retireready THECOMMBANK RETIREREADYINDEX *AssociationofSuperannuationFundsofAustralia(ASFA)comfortableretirementstandard,asatdateofpublication † BasedontheassumptionsusedbyRiceWarnerincalculatingtheCommBankRetireReadyIndex Thingsyoushouldknow:ThisdocumenthasbeenpreparedusingdatafromtheCommBankRetireReadyIndexwhichwasdevelopedincollaborationwithRiceWarner.Youcanseeacopyof theCommBankRetireReadyIndexbygoingtocommbank.com.au/retireready.Thisdocumenthasbeenpreparedwithoutconsideringyourobjectives,nancialsituationorneeds.Youshould, beforeactingonthisadvice,consideritsappropriatenesstoyourcircumstances.CommonwealthBankofAustraliaABN48123123124AFSL234945Call132221orvisitcommbank.com.au Alittleextrainyoursuperannuationnow canmakeadifferencelater. 35YEAR-OLDCOUPLE Savinganextra$50perweek untilretirementcanmovefrom 80%to100%retirereadiness.† 45YEAR-OLDCOUPLE Savinganextra$88perweek untilretirementcanmovefrom 80%to100%retirereadiness.† 55YEAR-OLDCOUPLE Savinganextra$174perweek untilretirementcanmovefrom 80%to100%retirereadiness.† isacomprehensiveanalysisofAustralians’ retirementsavingsandresultingretirementincomes. whowillhavesufcientassetstomeettheir retirementneedsincludingtheagepension. Itprojectsthepercentage ofthepopulationaged25–64 Thereporthasuseddatafrommorethan Australiansuperannuation accountsasat30Dec2015.10m 27%75% 23102/0217 7.7millionAustraliansareontrackforcomfortableretirement* Percentageofretirementassetsheldinsuperannuation Howmuchcoupleswouldneedtodaytobeontrack– basedonaveragegrosshouseholdincomesof$107,000. 7.7million 100%retireready 1.4million 90%ontrack 1million 80%ontrack $280k $224k $362.5k $290k $420k $336k
  • 6. CONTENTS Introduction1 Highlights2 Report Results 4 Headline Results 4 Results by age and gender 5 Results by income and gender 6 Adequacy distribution 7 Required savings today by age and income 8 What this could mean for you 10 Methodology and Assumptions 11 Appendix A – Assumptions 12 Appendix B – Changes to method and average savings adequacy 14 February 2017
  • 7. The CommBank Retire Ready Index is a comprehensive analysis of the retirement savings and resulting retirement incomes of Australia’s working population. It sets out the percentage of the population aged 25–64 who are projected to have sufficient assets, including superannuation, personal wealth and Age Pension entitlements, to meet a comfortable level of retirement. CommBank has partnered with Rice Warner, one of Australia’s leading and most respected actuarial firms, to develop this report. This report projects the retire readiness of working Australians aged 25–64. Using data from over 10 million member superannuation accounts from Rice Warner’s Super Insights* along with personal wealth data from the Australian Bureau of Statistics, we have provided a comprehensive picture of the wealth of the Australian population. The data excludes the family home as this asset is not typically used for retirement income purposes. Our analysis captures some of the most important factors affecting retirement adequacy, such as couple/single status and personal wealth. It also provides insights into the retire readiness of Australians by demographic split including: • Age, • Gender, • State, and • Couple/single status Calculations and projections used in the report look at the anticipated costs of goods and services needed to maintain a comfortable standard of living. These are based on the Association of Superannuation Funds of Australia’s (ASFA) comfortable retirement standard which is currently $43,372 and $59,619 per annum for singles and couples respectively. INTRODUCTION * Superannuation Market Projection Report 2015, Rice Warner 1
  • 8. HIGHLIGHTS 53% 47% 1 in 2 Australian households (53%) are expected to be retire ready 7.7 million people aged between 25 and 64 are expected to be retire ready, while 5.1 million Australians are not likely to have enough for a comfortable retirement. Excluding the Age Pension, only 17% of Australian households are expected to be retire ready. It is anticipated that 40% of Australians households will be retire ready when including the Age Pension and superannuation assets only. 0% 10% 20% 30% 40% 50% 60% Super only Super + Personal Wealth Age Pension + Super Age Pension + Super + Personal Wealth 53% 40% 17%6% Retire Ready Index 27% of singles are expected to be retire ready compared with 75% of couples. However, 44% of singles and 94% of couples are almost retire ready and projected to have between 80–90% of what is required for a comfortable retirement. Women are expected to be less retire ready than men due to lower average incomes and career breaks during child bearing years. And, they have longer life expectancies. 27% 75% 31% of single males are expected to be retire ready compared to… 22% of single females 2
  • 9. ACT has the highest proportion of singles and couples who are expected to be retire ready while TAS and NT have the lowest. The mix of retirement assets is distinct across age groups. Older age groups have a significant amount of assets outside of superannuation, while the younger age groups are expected to accumulate more in superannuation via compulsory contributions. The Age Pension contributes more significantly to retire readiness for couples than for singles, with 75% of couples expected to be retire ready when the Age Pension is included, compared with only 20% when it is excluded. Superannuation is expected to contribute more than 75% of the total wealth for under 50s at retirement outside of the family home. 60–64 year-old singles are expected to be the least retire ready (18% of males and 9% of females) as they have not had access to compulsory Superannuation Guarantee contributions for the duration of their working lives. 55–59 64% 60–64 49% 45–54 74% 35–44 78% 0% 10% 20% 30% 40% 50% 60% 70% 80% Single females Single males Couples 9% 22% 17% 31% 20% 75% 0% 20% 40% 60% 80% 100% NSW VIC QLD ACT WA SA TAS NT 3
  • 10. Average Australians will need… … per annum for a comfortable retirementCOUPLE SINGLE $59,619*$59,619* $43,372*$43,372* HOW MUCH? *  Based on the Association of Super Funds of Australia (ASFA) standard for a comfortable retirement, as at the date of publication. Headline Results For the population analysed at 31 December 2015, 27% of single Australians are expected to retire with assets and Age Pension entitlements sufficient to meet their retirement needs. 75% of couples will retire with assets and Age Pension entitlements sufficient to cover their needs. Table 1. Retire Ready Index Singles Couples Total RRI – % of Australians 27% 75% 53% RRI – Without Age Pension 13% 20% 17% • Only 53% of Australian households are expected to be retire ready. • If only the Age Pension and superannuation assets are considered, 40% of Australian households are expected to be retire ready. • Without the Age Pension, 17% of Australian households are expected to be retire ready. REPORT RESULTS 4
  • 11. Results by age and gender Table 2 shows the results of the savings gap by age, marital status and gender. Note that when calculating adequacy for couples we have assumed for simplicity that couples consist of people in the same age cohort. In reality, there is likely to be a wider cohort distribution for couples. The results show that more males will achieve adequacy than females. Couples experience higher levels of adequacy relative to singles due to the lower per person income required under the ASFA adequacy standard and higher private savings. The results below have been calculated using the ASFA Comfortable standard and take into account the Age Pension asset test changes, which came into effect on 1 January 2017. Table 2. Retire Ready Index by age and gender including the Age Pension Age Gender Singles Couples Total Male Female 25–29 34% 29% 73% 46% 30–34 40% 28% 70% 53% 35–39 33% 27% 78% 58% 40–44 32% 25% 72% 55% 45–49 32% 18% 70% 51% 50–54 24% 18% 80% 54% 55–59 20% 15% 83% 55% 60–64 18% 9% 76% 49% Total 31% 22% 75% 53% Table 3. Retire Ready Index by age and gender excluding the Age Pension Age Gender Singles Couples Total Male Female 25–29 17% 12% 25% 19% 30–34 24% 12% 25% 22% 35–39 17% 12% 25% 21% 40–44 17% 11% 25% 21% 45–49 17% 8% 15% 14% 50–54 16% 5% 15% 13% 55–59 14% 3% 15% 12% 60–64 10% 6% 15% 12% Total 17% 9% 20% 17% 5
  • 12. Factors that increase the gap for females relative to males include: • Women are expected to have lower retirement savings due to lower incomes over their working lives and career breaks during child bearing years. • Women have a longer life expectancy and therefore need to make their income last longer in retirement. Factors that decrease the gap for females relative to males include: • The Age Pension acts as a buffer to lower retirement assets. Women are expected to receive higher Age Pensions due to having lower assets. Table 3 shows the assets relative to needs excluding Age Pension payments. By this measure, women are worse off than men in terms of saving for their retirement needs. Factors that can increase the gap for younger people: • The main driver of reduced adequacy at younger ages is improved life expectancy. These offset the impact of the planned increase in superannuation guarantee contributions and the longer period of saving with superannuation guarantee contributions. Results by income and gender It is worth noting that even when we control the results for income the gender gap is still present. In particular, this is a result of longer female life expectancy which requires women to hold greater assets to maintain the Comfortable level of income for the expected duration of their life despite their lower current balances relative to males. Table 4. Retire Ready Index by income and gender including Age Pension for singles Annual Income ($) Singles Total Male Female nil 0% 0% 0% under 46,800 0% 0% 0% 46,800–58,500 0% 0% 0% 58,500–66,300 47% 25% 38% 66,300–78,000 83% 61% 74% 78,000–93,600 100% 100% 100% 93,600–140,400 100% 100% 100% over 140,400 100% 99% 100% Total 31% 22% 27% Unlike in previous reports, this year we have not assumed that each member of a couple is earning the same income, instead we have used separate income bands to segment couples on a ‘household’ basis. Table 5 shows the retire ready index by income for couples. 6
  • 13. Table 5. Retire Ready Index by income including Age Pension for couples Annual Income ($) Couple nil 1% under 91,500 48% 91,500–114,300 100% 114,300–129,600 100% 129,600–152,400 100% 152,400–182,900 100% 182,900–274,400 100% over 274,400 100% Total 75% Adequacy distribution Table 6 reflects the distribution of retirement adequacy for single Australians. As noted above, 27% of singles are projected to meet the benchmark for retirement adequacy for their age, but this figure increases to 44% when considering individuals who are within 20% of achieving adequacy. Further, due to the effects of Age Pension entitlements no individuals fall below the level of wealth in line with 40% of their retirement needs. Table 6. Adequacy Distribution by Gender (Singles) Percentiles Singles Total Male Female 0% – 10% 100% 100% 100% 40% – 50% 100% 100% 100% 50% – 60% 96% 96% 96% 60% – 70% 84% 77% 81% 70% – 80% 67% 50% 59% 80% – 90% 51% 36% 44% 90% – 100% 39% 25% 33% 100% 31% 22% 27% In contrast to single citizens, 75% of couples meet their forecasted adequacy benchmark. A further 19% will have 80% or more of the required savings. 7
  • 14. Table 7. Adequacy Distribution by Gender (Couples) Percentiles Couple 0% – 10% 100% 40% – 50% 100% 50% – 60% 100% 60% – 70% 100% 70% – 80% 98% 80% – 90% 94% 90% – 100% 88% 100% 75% Required savings today by age and income Tables 8 through 10 show the savings an Australian would require today in order to consider themselves on track for a comfortable retirement, taking into account future contributions to superannuation and private wealth. As is expected, this benchmark grows with age and falls with income as people approach retirement and are able to convert more of their income into savings. Table 8. Required savings today for a male to achieve ASFA adequacy (today’s dollars) 25–29 30–34 35–39 40–44 45–49 50–54 55–59 60–64 nil 345,000 345,000 370,000 395,000 400,000 425,000 430,000 430,000 under 46,800 120,000 145,000 195,000 245,000 275,000 330,000 360,000 395,000 46,800– 58,500 75,000 105,000 155,000 210,000 245,000 310,000 345,000 385,000 58,500– 66,300 0 15,000 80,000 150,000 195,000 270,000 320,000 370,000 66,300– 78,000 0 0 0 55,000 125,000 220,000 285,000 355,000 78,000– 93,600 0 0 0 0 25,000 145,000 240,000 325,000 93,600– 140,400 0 0 0 0 0 0 135,000 275,000 over 140,400 0 0 0 0 0 0 0 85,000 8
  • 15. Table 9. Required savings today for a female to achieve ASFA adequacy (today’s dollars) 25–29 30–34 35–39 40–44 45–49 50–54 55–59 60–64 nil 360,000 385,000 395,000 420,000 450,000 455,000 485,000 490,000 under 46,800 140,000 185,000 215,000 265,000 325,000 355,000 420,000 450,000 46,800– 58,500 90,000 140,000 175,000 235,000 295,000 335,000 405,000 445,000 58,500– 66,300 0 55,000 100,000 175,000 245,000 295,000 375,000 430,000 66,300– 78,000 0 0 0 80,000 175,000 245,000 340,000 410,000 78,000– 93,600 0 0 0 0 75,000 170,000 290,000 385,000 93,600– 140,400 0 0 0 0 0 20,000 195,000 335,000 over 140,400 0 0 0 0 0 0 0 150,000 Table 10. Required savings today for a couple to achieve ASFA adequacy (today’s dollars) 25–29 30–34 35–39 40–44 45–49 50–54 55–59 60–64 nil 390,000 415,000 420,000 450,000 480,000 485,000 520,000 525,000 under 91,500 215,000 270,000 300,000 350,000 390,000 405,000 445,000 445,000 91,500– 114,300 205,000 265,000 295,000 340,000 385,000 400,000 440,000 435,000 114,300– 129,600 155,000 210,000 255,000 315,000 345,000 375,000 440,000 435,000 129,600– 152,400 0 0 85,000 180,000 270,000 320,000 380,000 380,000 152,400– 182,900 0 0 0 0 95,000 210,000 315,000 345,000 182,900– 274,400 0 0 0 0 0 0 165,000 290,000 over 274,400 0 0 0 0 0 0 0 0 9
  • 16. We have chosen five sample Australian households, to illustrate how this comprehensive picture of retire readiness might play out for households across Australia. For each household, we have considered the person or couple’s wealth today, their projected wealth at retirement, their income, and the average pension that can be expected under the assumptions underlying the results in this report. It is important to note that an individual’s personal wealth assets are exclusive of owner-occupied housing. Table 11. Persona Results Persona Today Projected Retirement Assets RRI Expected Retirement Income Average Super Balance Personal Wealth Total Assets Sarah 37 – ACT 260,000 22,000 282,000 795,000 124% 49,000 Abby 61 – NSW 459,000 1,684,000 2,144,000 2,445,000 362% 129,000 Brad 23 – QLD 36,000 4,000 40,000 615,000 102% 45,000 Jane and John 46 – WA 250,000 97,000 347,000 703,000 107% 65,000 Jeff and Wendy 53 – VIC 444,000 236,000 680,000 857,000 130% 70,000 WHAT THIS COULD MEAN FOR YOU 10
  • 17. METHODOLOGY AND ASSUMPTIONSThe approach to this year’s Retire Ready Index report differed from the approach in previous years’ reports. The first step was to segment the Australian population by gender, marital status, income and state. This was done primarily using the data available from the 2011 Census, the ABS Survey of Income and Housing, the ATO 2% Sample File and from other Rice Warner research, such as the Superannuation Market Projection Report 2015. Each of these segments formed the basis of a cameo, or an individual scenario, which were then assigned a weight according to the size of the population. Future entrants to the workforce are not considered and the position of those over retirement age is ignored. Couples are identified in the data and flagged, and a couple is represented by a single cameo in the model, rather than the amalgamation of two singles. Additionally, for each scenario we determined the amount of wealth members were expected to hold outside of superannuation. Data on personal wealth was primarily taken from the ABS Survey of Income and Housing and segmented according to gender, marital status, and income. This personal wealth data was then smoothed and scaled for the differences in personal wealth between Australian states. Note that personal wealth is exclusive of the value of owner-occupied housing as these assets are not typically used for retirement income. Each of these scenarios was then transferred to the Rice Warner retirement projection model. This model is used as the basis for many of Rice Warner’s retirement calculators and allows for the projection of an individual’s or a couple’s retirement balance at retirement, as well as the longevity of that balance for given income requirements. It can also be used to determine superannuation balance requirements for individuals and couples given an income requirement and life expectancy. Each of the scenarios were recreated twice – once to determine the expected retirement balance and a second time to determine the required balance to fund their retirement for each type of adequacy. The forward projection of members’ balances at retirement gives us an estimate of likely total future savings; the ‘Assets’ of the Australian working population at retirement for this report. Since we also calculate the expected requirement for savings to sustain adequate income to life expectancy, we also have an estimate of the required savings for the population, or the ‘Liabilities’ in the context of this report. Age 67 is used as a proxy for retirement age, although we note that a number of individuals will formally retire before this age. There are a number of items for which we have made implicit assumptions. It is impractical to segment the population into every potential outcome that may influence the results and there are a number of items which are significant enough to warrant comment. The model assumes that females currently working will have a full history of employment, with no breaks in service for maternity leave, career breaks etc. Similarly, it assumes that those women currently off work to bear and raise children will not return. Of course, in practice, some will leave and be replaced by others returning to the workforce. Unfortunately, there are no reliable statistics showing the extent and incidence of broken service so we have not carried out this more complex modelling. As a result, the model will overstate the Retire Ready Index for younger females. Further details on assumptions used in the model are provided in Appendix A. 11
  • 18. Appendix A – Assumptions Economic: Appendix A – Assumptions 2014 2016 Gross investment returns 7.50% 7.00% Salary growth 4.50% 4.00% Price inflation 3.00% 2.50% Expense rate 1.12% 1.10% First year insurance cost* 0.53% 0.53% Contributions tax 15.00% 15.00% Investment tax on roll-up (allows for franking credits and CGT discounts) 6.00% 6.00% * After the first year, insurance premiums are indexed to wage growth Demographic: • Mortality in accordance with the Australian Life Tables 2010–2012 published by the Australian Government Actuary. • Future improvement to post-retirement mortality in accordance with the 125 year improvement rates published by the Australian Government Actuary in the Australian Life Tables 2010–2012. Future contributions–Super: • Average current employer contribution (including salary sacrifice) of 14.0%.* • 3.0% gradual increase of employer contribution from 2014 to 2025. • Average member contribution of 3.2%. Treatment of Couples: • Reporting bands for couples’ incomes are based on equivalent bands used for singles as a % of AWOTE where the couple’s AWOTE is defined as (Male AWOTE + Female AWOTE). Note: The actual incomes of the males and females used in each band differ based on the average salaries of couples who fall within that band using data from the ATO 2% Sample File. * Estimated with analysis of ABS, APRA and Rice Warner internal data 12
  • 19. Personal Wealth: • Distributions of personal wealth are taken from the ABS Survey of Income and Housing 2013–14 and segmented by state, gender, income and marital status • 4.27% average personal wealth saving rate (varies by income) in line with Rice Warner’s Personal Investments report 2015. • 6.27% pa investment return on personal wealth. 13
  • 20. Appendix B – Changes to method and average savings adequacy B.1 Change to Methodology As was noted at the start of this report, due to improvements in methodology and the metrics underlying this report it is no longer possible to compare the retire readiness across previous years’ reports. In particular, in earlier editions the modelled results were calculated using a modified version of Rice Warner’s savings gap model. The index was calculated as the percentage of Australian members’ assets at retirement compared to their needs net of the age pension, as per: Figure 1. Retirement Ready calculation 2014 RRI = Balance Needs – Age Pension For the 2015 results, the savings gap model was replaced with an aggregation of the Australian population using our Retirement Projection engine and population data from the ABS. The Retire Ready Index is calculated as the population weighted proportion of individuals who meet this benchmark. B.2 Average savings adequacy The approach to calculating the index also changed slightly; the impact of the age pension was added to the balance at retirement, rather than subtracted from needs. As such the calculation became: Figure 2. Average Savings Adequacy 2015 ASA = Balance + Potential Age Pension Needs ‘Potential age pension’ refers to the age pension that a member would receive on the condition that they met the requirements for retirement adequacy. That is, we calculate the assets a member needs to support the income defined by one of the measures of adequacy and base their Age Pension income on this amount of assets. The aggregate Age Pension payments are then discounted to retirement and combined with the member’s balance to determine the Average Saving Adequacy (ASA). Given these changes and in the interest of providing scope for approximate cross-period comparison this section provides a sample of the results pertaining to the Average Savings Adequacy metric. 14
  • 21. B.3 Average retirement savings adequacy by age and gender including the Age Pension (ASFA) Age Gender Singles Couples Total Male Female 25–29 103% 91% 140% 112% 30–34 111% 96% 135% 121% 35–39 106% 93% 136% 122% 40–44 101% 86% 131% 116% 45–49 99% 80% 126% 111% 50–54 96% 80% 128% 111% 55–59 95% 76% 126% 108% 60–64 97% 75% 122% 106% Total 102% 85% 131% 114% B.4 Average retirement savings adequacy by age and gender excluding the Age Pension (ASFA) Age Gender Singles Couples Total Male Female 25–29 61% 50% 85% 66% 30–34 67% 55% 81% 72% 35–39 62% 51% 80% 71% 40–44 57% 44% 75% 65% 45–49 54% 38% 70% 60% 50–54 51% 37% 72% 59% 55–59 48% 33% 69% 57% 60–64 49% 30% 65% 53% Total 58% 43% 75% 64% 15
  • 22. B.5 Average retirement savings adequacy by income and gender including Age Pension (ASFA) Annual Income ($) Singles Total Male Female nil 50% 50% 50% under 46,800 67% 63% 65% 46,800–58,500 86% 80% 83% 58,500–66,300 98% 91% 95% 66,300–78,000 114% 106% 110% 78,000–93,600 139% 126% 133% 93,600–140,400 187% 163% 177% over 140,400 290% 249% 277% Total 102% 85% 94% B.6 Average retirement savings adequacy by income and gender 2015 including Age Pension (ASFA) Annual Income ($) Couple nil 80% under 91,500 99% 91,500–114,300 116% 114,300–129,600 124% 129,600–152,400 137% 152,400–182,900 161% 182,900–274,400 202% over 274,400 285% Total 131% 16
  • 23. B.7 Average retirement savings adequacy by State and gender 2015 including Age Pension Annual Income ($) Singles Couples Total Male Female NSW 103% 87% 131% 114% VIC 100% 85% 132% 114% QLD 100% 83% 130% 113% ACT 133% 117% 141% 134% WA 114% 87% 129% 117% SA 92% 79% 129% 109% TAS 87% 75% 132% 109% NT 100% 83% 126% 109% Total 102% 85% 131% 114% B.8 Required savings at retirement by age and gender to achieve ASFA Comfortable standard (today’s dollars) Male Female Couples 25–29 599,000 625,000 677,000 30–34 560,000 625,000 674,000 35–39 562,000 600,000 637,000 40–44 560,000 596,000 639,000 45–49 531,000 597,000 637,000 50–54 527,000 564,000 602,000 55–59 499,000 562,000 603,000 60–64 466,000 531,000 569,000 17
  • 24. Stay Connected commbank.com.au Visit In branch Call 1800 241 996 Things you should know: About the CommBank Retire Ready Index. The CommBank Retire Ready Index was developed in collaboration with Rice Warner Pty Limited (Rice Warner), and is based on data from more than 10 million Australian superannuation accounts as at 31 December 2015 along with personal wealth data from the Australian Bureau of Statistics. The Index is a measure of the percentage of assets Australians are likely to have at retirement relative to their comfortable retirement needs.This has been defined according to the Association of Superannuation Funds of Australia (ASFA) comfortable standard of living which is currently $43,372 p.a. for a single and $59,619 p.a. for a couple.The CommBank Retire Ready Index assumes a retirement age of 67 and includes the Age Pension asset test changes which came into effect on 1 January 2017.The data excludes the family home as this asset is not typically used for retirement income purposes.This document has been prepared without considering your objectives, financial situation or needs.You should, before acting on this advice, consider its appropriateness to your circumstances. Commonwealth Bank of Australia ABN 48 123 123 124 AFSL 234945 Call 13 2221 or visit commbank.com.au 23125/0217