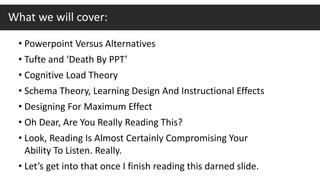
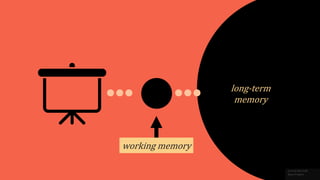
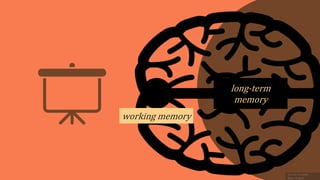
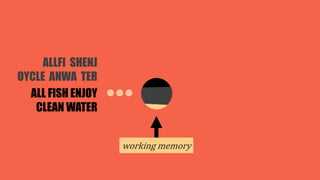
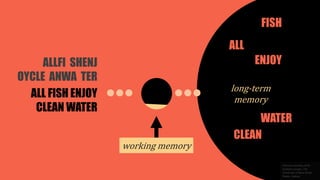
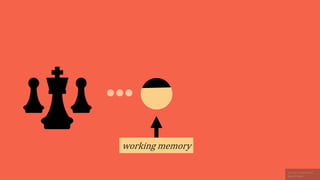
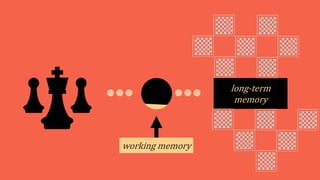
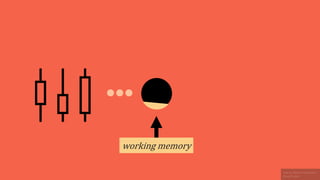
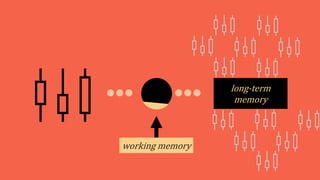
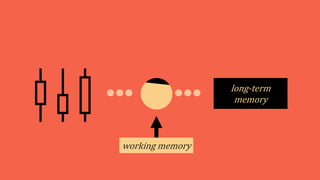
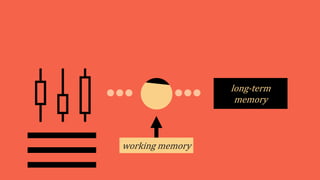
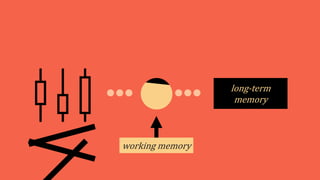
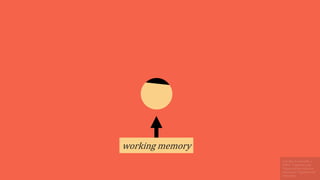
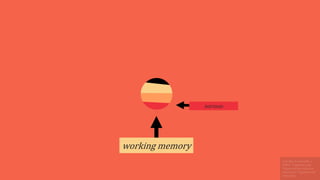
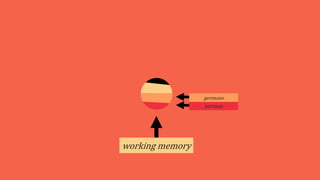
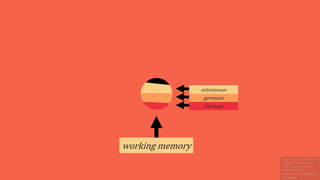
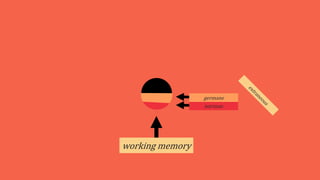
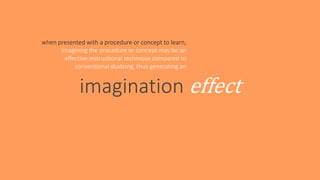
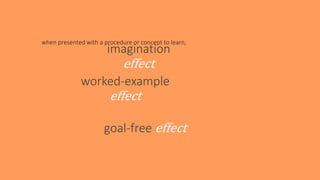
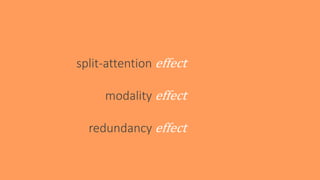
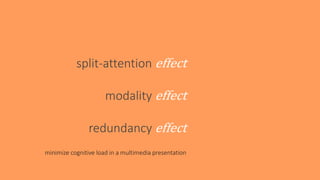
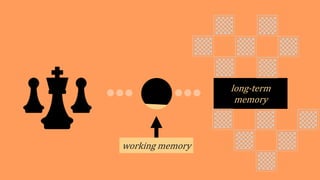
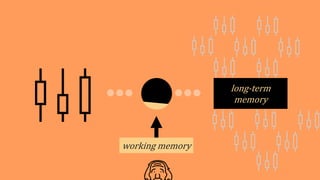
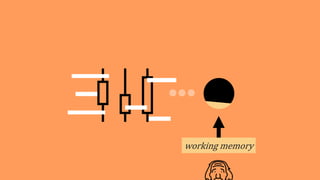
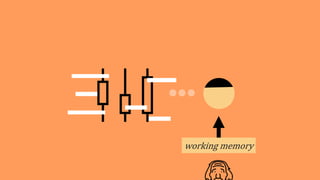
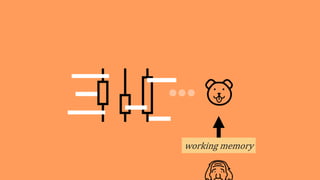
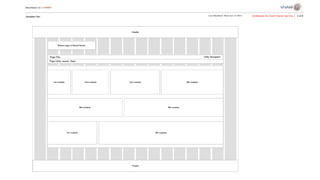
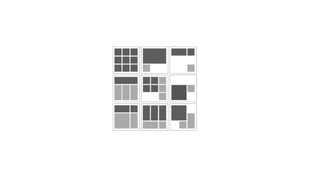
Science of Presentation
• Powerpoint Versus Alternatives
• Tufte and ‘Death By PPT’
• Cognitive Load Theory
• Schema Theory, Learning Design And Instructional Effects
• Designing For Maximum Effect
• Oh Dear, Are You Really Reading This?
• Look, Reading Is Almost Certainly Compromising Your
Ability To Listen. Really.
• Let’s get into that once I finish reading this darned slide.
What we will cover:
let’s get to it for real.
science of presentation
Icon by Polina Flegontovna
Noun Project
WHY
WHY?WHAT&
WHY?WHAT& (it is and isn’t)
it isn’t
it isn’t it is!
it isn’t
it isn’t it is!
it isn’t
it isn’t it is!
REPORT
REPORT
REPORT
REPORT
PRESENTATION
death by powerpoint
is it real ?
according to statistician and info design pioneer
ed tufte
it might be…
what’s the problem, tufte?
powerpoint comes with a
b g
attitude.
power … point?
cognitive load theory
working memory
long-term
memory
long-term
memory
working memory
long-term
memory
working memory
92
working memory
7953
working memory
39246715
working memory
1
2 4
7
working memory
1
2 4
7
long-term
memory
My father’s
brother’s
grandfather is
my grandfather’s
brother’s father
working memory
My father’s
brothers’
grandfather is
my grandfathers’
brothers’ father
working memory
ALLFI SHENJ
OYCLE ANWA TER
working memory
ALL FISH ENJOY
CLEAN WATER
ALLFI SHENJ
OYCLE ANWA TER
working memory
long-term
memory
ENJOY
CLEAN
ALL
WATER
FISH
ALL FISH ENJOY
CLEAN WATER
ALLFI SHENJ
OYCLE ANWA TER
working memory
working memory
long-term
memory
working memory
working memory
long-term
memory
working memory
long-term
memory
working memory
long-term
memory
working memory
long-term
memory
working memory
working memory
intrinsic
working memory
intrinsic
germane
working memory
intrinsic
germane
extraneous
working memory
intrinsic
germane
learning effects
learning effects
working memory
Angle A = 55° Angle C = 45°
Angle ABC = 180°
= 180° - 55° - 45°
= 80°
Angle DBE = 80° (Vertically opposite angles are equal)
A
D
B
E
C
Angle DBE = 80° (Vertically opposite angles are equal)
A
D
B
E
C
55°
45°
Angle ABC
= 180° - 55° - 45°
split / attention effect
S T E P 1
S T E P 2
S T E P 3
working memory
working memory
HO H
O O
H
H
O
H
H
Electron Dot Formula: Water Example
1.
Draw all atoms with
valence electrons.
There are six valence
electrons in oxygen
atom and one valence
electron in each
hydrogen atom.
2.
One valence electron
of one hydrogen atom
gets bonded with
central atom that is
oxygen atom and
forms a covalent bond.
3.
Another hydrogen
atom also bonded to
oxygen atom to form
one covalent bond and
gets duplet
configuration.
4.
We can draw line as a
bond in place of dots
in electron dot
structure.
HO H
O
O
H
H
O
H
H
1.
2.
3.
4.
modality effect
working memory
working memory
Relationships within Europe before the First World War
Austria -
HungaryItaly
Bulgaria
Serbia
Germany
Russia
Britain
Ottoman
Empire
France
Key
Ai Aid
Al Alliance
T Treaty
Triple Entente
Triple Alliance
Balkans
Austria -
HungaryItaly
Bulgaria
Serbia
Germany
Russia
Britain
Ottoman
Empire
France
Key
Triple Entente
Triple Alliance
Balkans
redundancy effect
working memory
working memory
working memory
fore·shad·ow
/fôrˈSHadō/
gerund or present participle: foreshadowing
be a warning or indication of
(a future event)
imagination effect
ready to be
depressed?
(long-term?)
guess where
the line goes
yikes.
imagination effect
imagination effect
when presented with a procedure or concept to learn,
imagining the procedure or concept may be an
effective instructional technique compared to
conventional studying, thus generating an
imagination
effect
when presented with a procedure or concept to learn,
imagination
effect
when presented with a procedure or concept to learn,
worked-example
effect
goal-free effect
split-attention effect
modality effect
redundancy effect
split-attention effect
minimize cognitive load in a multimedia presentation
modality effect
redundancy effect
imagination
effect
when presented with a procedure or concept to learn,
worked-example
effect
goal-free effect
Angle DBE = 80° (Vertically opposite angles are equal)
A
D
B
E
C
55°
45°
Angle ABC
= 180° - 55° - 45°
A
D
B
E
C
55°
45°
Find Angle DBE
worked-example effect
working memory
long-term
memory
working memory
long-term
memory
(novice)
(novice)
A
D
B
E
C
55°
45°
Find all the angles you can.
A
D
B
E
C
55°
45°
Find Angle DBE
goal-free effect
working memory
(novice)
GOAL
available space
(novice)
GOAL
NO GOAL :
NO GOAL :
Mean –
3rd quartile –
2nd quartile –
1st quartile –
4th quartile –
How to understand a boxplot:
Mean –
3rd quartile –
2nd quartile –
1st quartile –
4th quartile –
How to understand a boxplot:
(not a
novice)
Mean –
3rd quartile –
2nd quartile –
1st quartile –
4th quartile –
How to understand a boxplot:
Duh!
expertise reversal effect
working memory
long-term
memory
working memory
working memory
working memory
expertise reversal effect
school’s out!
REPORT
PRESENTATION
design principles
this is intimidating.
VISUAL HIERARCHY
VISUAL HIERARCHY
You can use
a whole bunch of things
for visual hierarchy.
You can use
color
for visual hierarchy.
You can use
a whole bunch of things
for visual hierarchy.
size
You can use
weight // CAPS // italics
for visual hierarchy.
You can use
color
for visual hierarchy.
font
You can use
spacing
for visual hierarchy.
You can use
alignment
for visual hierarchy.
VISUAL HIERARCHY
exercise
VISUAL HIERARCHY@
• Overall, across single and
multi-click paths, 1 of 2 click
paths had both search and
display interactions
Multi Touch Display
Multi Touch Search
Multi Touch Search &
Display
Single Touch Display
Single Touch Search
Path Analysis
PAT H A N A LY S I S
Overall, across single and multi-click paths,
10% of click paths
had both search and display interactions
Multi Touch Display
Multi Touch Search
Multi Touch Search &
Display
Single Touch Display
Single Touch Search
REPORT
PRESENTATION
REPORT
REPORT
REPORT
REPORT
PRESENTATION
Fun fact!
this guy is actually crying,
because stock
photography is
the worst.
+
remember
this?
(theoretically it’s in your
long-term memory….)
Well.
C O L L A B O R AT E
R E TA I L
I N N OVAT I O N
M O B I L I T Y
I N T E G R AT I O N S H O P P I N G C A R T
A F F I N I T Y
O R G A N I C
G LO B A L
exercise
@
•Blah
•Blah
Step 1
•Blah
•Blah
Step 2
•Blah
•Blah
Step 3
• Blah
• Blah
S T E P 1
• Blah
• Blah
S T E P 2
• Blah
• Blah
S T E P 3
• Blah
• Blah
S T E P 1
• Blah
• Blah
S T E P 2
• Blah
• Blah
S T E P 3
Blah Blah Blah Blah
Blah Blah Blah Blah
GRIDs
who
run
the
world?
who
run
the
world?
GRIDs
GRIDsexercise
GRIDs@
N E W H O M E PA G E – L A U N C H I N G E N D O F M A R C H
• Forecast campaign performance to set budgets & mitigate risk
• Predict audience response at an individual level to prioritize your
investments
Predict your audience’s response
Testing / Validation
Predictive
Analytics
Entertainment Case Study
• Identified KPI’s with client
• Modeled diminishing returns by tactic to set
budgets for maximum efficiency
• Reporting views enabled us to take advantage of
market disruptions
• Forecast campaign performance to set budgets & mitigate risk
• Predict audience response at an individual level to prioritize your investments
Predict your audience’s response
Testing / Validation
Predictive Analytics
Entertainment Case Study
• Identified KPI’s with client
• Modeled diminishing returns by
tactic to set budgets for
maximum efficiency
• Reporting views enabled us to
take advantage of market
disruptions
Entertainment Case Study
• Identified KPI’s with client
• Modeled diminishing
returns by tactic
to set budgets for
maximum efficiency
• Reporting views enabled
us to take advantage of
market disruptions
Forecast campaign performance to set budgets & mitigate risk
Predict audience response at an individual level to prioritize your investments
Predict your audience’s response
Predictive
Analytics
WHITE SPACE
WHITE SPACE ALLOWS CONTENT TO
MACRO
micro
WHITE SPACE
exercise
WHITE SPACE
@
Agenda for Date
Time Item One
Time Item Two
Time Item Three
Time Item Four
Time Item Five
Time Item Six
Contents
•
4 6 12
Competitor Overview Competitive Landscape Rank & Impression
• • •
14 17 19
Keyword Analysis Conquesting Campaign Visitor Attrition
• • •
20 23 24
Site Comparison Strategy Overview Recommendations
Column Column Column Column Column
Label Value Value Value Value
Column Column Column Column Column
Label Value Value Value Value
Column Column Column Column Column
Label Value Value Value Value
Column Column Column Column Column
Label Value Value Value Value
&most importantly,
most importantly,
PLAY

Cognitive Load Theory for PPT

Editor's Notes

  • #2 Thanks for joining, all of you, and welcome to The Science of Presentation.
  • #3 [Read slide as usual until sign]
  • #6 I first want to touch on why we need this, why we need to think about the way people process information when embarking on presentations. You might say, yeah, Teeka, I know that reading off bullet points isn’t terribly engaging, and the slide isn’t the prettiest, but it’s functional, it gets the job done. My job is to make information go from point A to point B, and if something does that much, then I’ve done my job, and done it efficiently. Well I’m going to argue that the reason for thinking about the science of understanding is perhaps the reason why anyone does anything:
  • #7 Money. Let me make my case:
  • #8 We’ve got a presentation here.
  • #9 And the assumption behind bullets, or most presentations is that people are ingesting everything
  • #10 Like people have a photographic memory. But we know, we know this isn’t true. Because that’s a rare, crazy thing, a photographic memory.
  • #11 But when we go about our presentations, we’re making them under the assumption that we do. When I said, as long as the info gets to Point A to Point B, it’s fine, but is that information really getting from Point A to Point B?
  • #12 It looks something a little more like this, and as an audience member, we get this. I mean, how many of your have been in this situation, where you go in, present this thing you’ve spent hours and hours on, and a few slides later, it’s like nothing got through. Or they get stuck on something that isn’t even the main point. Something goes wrong, and you don’t know why. [Describe]
  • #13 So when these guys, your client, your colleagues, your classmates, go back to use what you presented, in whatever context – which is what you want, no matter what the circumstance, right?
  • #14 When some sort of value, tangible or not is at the table,
  • #15 They’re going in with bits and pieces. How can we make sure this doesn’t happen? This is what this presentation is about, making our presentations, with pretty minimal effort, as effective as possible. NEXT SLIDE NEXT SLIDE NEXT SLIDE
  • #16 We’ve gone through why this is important, now I want to briefly go into [SLIDE CHANGE]
  • #17 What [SLIDE CHANGE]
  • #18 This is and isn’t. Gif speech
  • #19 Telling you what you’re doing is wrong or bad. At all.
  • #20 Instead, telling you how people respond to things, how they learn information. When you know that information, you can make what seems like a superficial change, but gets people to listen to you and learn from you so much more. ‘ So why not make those little changes, and do justice to your good work, which is what you all are known for already.
  • #21 Give you 8 brilliant rules that will solve all your problems, and is some didactic mumbo jumbo
  • #22 8 brilliant rules, 1, don’t exist, and 2, would be irrelevant and useless because that top layer of design is always changing. What this will do here is give you a way to think about your presentations critically, using the way people actually process information and cues. This will automatically make your presentations cleaner, more persuasive and powerful without having to remember ridiculous rules before you start every single deck.
  • #23 So finally, it’s not supposed to be adding to your workload, and boring and another annoying, frustrating thing to think about when embarking on a powerpoint facing that white screen of death
  • #24 Hopefully you’ll actually be more excited about making that deck, because it’s going to be a way to highlight your expertise, thoughtfulness, creativity, and just general brilliance.
  • #25 So here we go! We’ve gotten through the why and what of this training, but there’s another question. We say presentation to mean a lot of things. Almost everything. So let’s piece that apart a bit
  • #26 We’ve got you, the data, and the audience
  • #31 So here’s the thing. It seems like no matter which of these we’re doing,
  • #32 We deck it, don’t we. All of these needs and deliverables converge onto one tool, PPT.
  • #33 Is this a problem? Is death by PPT real?
  • #41 But when we do end up choosing a powerpoint, what should we do to make sure we’re making our point?
  • #42 To answer this. I’ve decided to use cognitive load theory. What is says is, audio and visual stimuli create a load on you. And the thing that holds this load, called working memory, is finite. This is a theory developed maybe 30 years ago, by an educational psychologist John Sweller. He says that we can use the way we present something to reduce the cognitive load on people, opening up their capacity to learn.
  • #43 So if we go back to our audience, they’re picking up on bits and pieces of our presentation,
  • #44 Their working memory is being taxed at different levels. If you want them to learn something, they’ve only got so much room.
  • #46 [Explanation] So let’s do a quick run-through of how this works
  • #51 These last guys have no chance of getting through to your long-term memory.
  • #52 Cognitive load is especially overloaded when something is complex and has a lot of relationships.
  • #54 Now let’s do another one. Try remembering this.
  • #55 Just switch around some of the spaces and – it’s a whole lot easier.
  • #56 This is because your long-term memory is helping you. As English speakers, you can really quickly recognize words, and really quickly remember words that are close in subject. This is automatic to you.
  • #57 Here’s another example of schemas in action…
  • #58 These schemas, that lessen cognitive load because the brain can automatically fill in the blanks, are grown with time, practice and usage. For most of us, chess is difficult.
  • #59 For chess masters, they can make moves without even thinking about it, even though chess is such an incredibly complex game. Things in long-term memory, the more they’re embedded in there with that practice and usage, come automatically. So, This is relevant to us. Because often times we’re presenting pretty complicated stuff.
  • #60 A boxplot for example, we can understand it without thinking about it. It’s easy.
  • #62 For someone who’s never seen it, it’s way more tough.
  • #63 As for any stuff that’s accompanying your boxplot,
  • #64 Forget about it. That’s never going to take.
  • #65 So we’ve got this cognitive load with anything we’re presenting right? But some part of that is always going to exist, it’s inevitable that when we’re speaking and presenting, we’re going to use up some of a persons concentration, and we can’t get rid of that.
  • #66 That’s called intrinsic load.
  • #67 A more recent development that used to be called intrinsic, is germane load. This is changeable, based on a persons expertise level. (germane: relevant to a subject under consideration.)
  • #68 Finally, extraneous. And this is the load caused by when we’ve got extra stimuli and slides that unnecessarily challenge people,
  • #69 And we’re trying to get rid of that.
  • #70 So now we go into the actual effects on learning, now like I said, the foundation of cognitive load theory was in education, so I thought the best way to present this…
  • #71 Would be to take you back to school.
  • #72 Keep in mind this little illustration of working memory, For each effect, I’m going to present you with two different ways of explaining or solving a problem, and I want you to think about which one causes more strain to the working memory.
  • #73 First, welcome to Period One, Geometry. I’m telling you how to solve for the angle DBE. Like this,
  • #74 Or this. ???
  • #75 This is because of the split attention effect: so [NEXT SLIDE]
  • #76 when you’re presenting disparate sources of information that must be mentally integrated in order for the information to be understood,
  • #77 those sources of information should be presented in integrated format
  • #78 Period 2: Chemistry. Here’s how to make an electron dot formula for water.
  • #79 Or I could have the illustration accompanied by my voiceover for the steps. What do you think?
  • #80 two messages on similar elements should be provided through different sensory modalities. Research suggest that more memory capacity is available when dual modalities were used, however it may lead to a split-attention effect and excessive animated multimedia may lead to a general overload. Also: Isolated interacting elements effect
  • #82 when presenting disparate sources of information that must be mentally integrated in order for the information to be understood, those sources of information should be presented in integrated format
  • #85 when the same information is presented more than once the multiple processing is negative for comprehension since it increases external cognitive load. If novices can benefit from partially redundant information (integrated text and picture for example), expert's performances can be impaired .
  • #86 when presenting disparate sources of information that must be mentally integrated in order for the information to be understood, those sources of information should be presented in integrated format
  • #87 when presenting disparate sources of information that must be mentally integrated in order for the information to be understood, those sources of information should be presented in integrated format
  • #88 when presenting disparate sources of information that must be mentally integrated in order for the information to be understood, those sources of information should be presented in integrated format
  • #96 mentally simulating the functioning and interaction of elements allow experts to obtain better results.
  • #104 A worked example provides a step-by-step solution to a problem or task. The worked example effect occurs when learning is enhanced by studying worked examples to problems rather than by trying to solve the original problems.
  • #109 novice learners with a specific learning goal (like a precise question to answer) focus on the goal and pay no attention to other information. This is detrimental to learning. Because focus is undirected
  • #124 So here’s the thing. It seems like no matter which of these we’re doing,
  • #125 Flat design Play Enthusiasm towards subject
  • #141 Path Length : In these longer paths, generic often initiates (Supporting slides, without these generics, we would have a CPL decrease of X, Top Conversion Paths
  • #142 Path Length : In these longer paths, generic often initiates (Supporting slides, without these generics, we would have a CPL decrease of X, Top Conversion Paths
  • #145 Builds can be used to accentuate a visual hierarchy
  • #156 This isn’t just designers being pretentious – this is grounded in science
  • #160 Think about what the human eye can take in and process in just a second
  • #198 And this sounds like a generic piece of advice that caps every single thing on design but it does for a reason. When it comes to design, everything is so subjective and that’s a wonderful and rare opportunity. We’re analysts in a technical field, and in so many things we’re driving towards a single point of optimization, the most efficient thing, the most accurate thing, and there is no most beautiful or most effective design, ever. A presentation shouldn’t be a drag, it’s an opportunity for you to use your imagination and creativity, to showcase your expertise and thoughtfulness, in a way that usually can’t be exercised in your day to day because we’re always directed towards some goal or outcome. So use your presentation to take a few creative risks, be unique, and express yourself and have fun, because it’s a rare opportunity, and the work that you guys do deserve it. Anyway, on that softie note, thanks for joining, and hopefully see you at the next one!