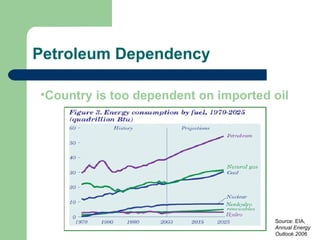
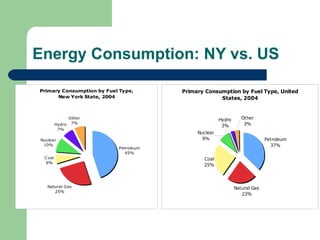
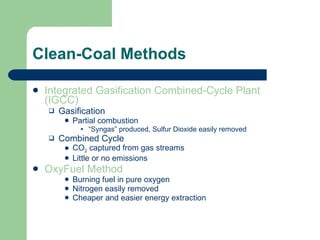
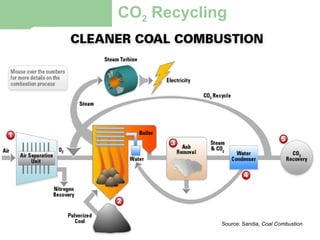
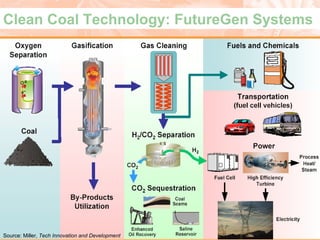
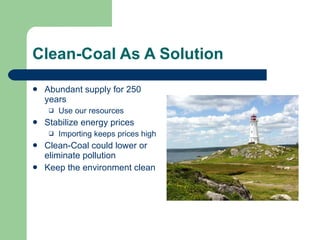
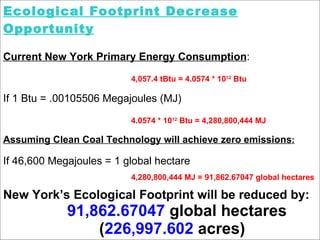
Current Options, Future Problems: New York City’s Current Fuel Options, the Energy Situation, and Their Effects on the Ecological Footprint Presented by: Yoni Jacobs HNRS 226
Abstract Current energy decisions are not the best New York and U.S. too dependent on oil Fossil fuels have damaging effects Can coal be used? Should we switch to other energy sources? Nuclear Wind Solar
Petroleum Dependency Country is too dependent on imported oil Source: EIA,  Annual Energy Outlook 2006
Coal Production and Consumption “ America’s most abundant indigenous fuel source” 95% of U.S. fossil energy reserves 250 year supply Coal Production and Consumption:  United States, 2005   Total [in million short tons] Coal Total [in Quadrillion Btus (Quads)] Energy Total  [in Quadrillion Btus (Quads)] Percent of Total Coal Production 1,131.50 23.41 70.72 33.10% Coal Consumption 1,105.40 22.9 100.49 22.79%
Energy Consumption: NY vs. US
Higher Priced Energy No coal mines in state Must import via rail High transport cost High cost of living High natural gas, petroleum, electricity prices Good side – higher Btu content in NY coal
Coal As An Option Positives Cheap Base Price 250 years of domestic supply Clean-coal and other technology  Could make coal a viable option Negatives Hard to change fuel source Destroy the environment CO 2  emissions Deforestation Climate change (global warming) Acid Rain Threat to society and health High externality costs
Coal Prices Coal cheapest source Residential, Commercial, Industrial, Electric sectors Used as energy source 6% of time in NY Only accounts for .25% of energy expenditures $3.13/mmBtu of energy Compared to: $9.95 for Natural Gas $23.07 for Propane
Proposed Expenditure Changes Proposed Expenditure Changes Currently : Coal Price (2004) Residential   $4.96/mmBtu Commercial   $2.26/mmBtu Industrial   $2.18/mmBtu Electric Generation   $1.54/mmBtu (U.S. Average) Net Energy Consumed (2004) Residential   846.2 trillion Btu Commercial   698.7 trillion Btu Industrial   252.3 trillion Btu Estimated Expenditures (Based on Current Energy Sources) Residential    $14.8 billion   Commercial    $12.8 billion Industrial    $2.3 billion Coal Based : Estimated Expenditures (Based on a Coal System) Residential    846.2 trillion Btu at $4.96/mmBtu  846,200,000 mmBtu * $4.96 =  $4,197,152,000   Commercial    698.7 trillion Btu at $2.26/mmBtu  698,700,000 mmBtu * $2.26 =  $1,579,062,000 Industrial   252.3 trillion Btu at $2.18/mmBtu  252,300,000 mmBtu * $2.18 =  $550,014,000
Coal’s Real Cost:  “Inconsistent with society’s best interests  (Cherry and Shogren, 6)” Market Failure Damage to environment, society, and health Externalities not accounted for in market price If they were, cost would be much higher Market Solution True cost    socially and economically cheapest source Not just cheapest market price
Externalities Land Clearing Loss of habitat Increased flooding Coal extraction Property damage Water + air contamination Noise pollution Worker death + injury Processing and disposal Acid mine drainage Regulating + insurance cost Damage to water quality Transportation of coal Damage to roads Railroad construction and maintenance Deaths from accidents Utilization Air pollution Emissions Asthma Other respiratory disease Death Waste Acid Rain
Coal’s Real Cost (cont.) $30/ton market price Acid rain ~ $11/ton Climate change ~ $4/mmBtu Social costs ~ 200% of base cost High of 464% for pollution costs  Source: (Cherry and Shogren, “Social Cost of Coal”) Could be the most under-priced energy Cost is appr. $190/ton - $220/ton
Clean-Coal Technology Coal contributes to 81% of CO 2  emissions related to power generation Elimination of carbon dioxide Re-use, absorption, etc. Zero-emissions an achievable goal No longer the “black sheep of the energy family”
Clean-Coal Methods Integrated Gasification Combined-Cycle Plant (IGCC)  Gasification Partial combustion “ Syngas” produced, Sulfur Dioxide easily removed Combined Cycle CO 2  captured from gas streams Little or no emissions OxyFuel Method Burning fuel in pure oxygen Nitrogen easily removed Cheaper and easier energy extraction
CO 2  Recycling Source: Sandia,  Coal Combustion
Clean Coal Technology: FutureGen Systems Source: Miller,  Tech Innovation and Development
Clean-Coal As A Solution Abundant supply for 250 years Use our resources Stabilize energy prices Importing keeps prices high Clean-Coal could lower or eliminate pollution Keep the environment clean
Ecological Footprint Decrease Opportunity Current New York Primary Energy Consumption : 4,057.4 tBtu = 4.0574 * 10 12  Btu If 1 Btu = .00105506 Megajoules (MJ) 4.0574 * 10 12  Btu = 4,280,800,444 MJ  Assuming Clean Coal Technology will achieve zero emissions : If 46,600 Megajoules = 1 global hectare 4,280,800,444 MJ = 91,862.67047 global hectares New York’s Ecological Footprint will be reduced by: 91,862.67047  global hectares ( 226,997.602  acres)
Green Buildings/Roofs Advantages Increased efficiency Less wasted energy Reduced storm water runoff Improved air quality Implementation Rebates Stricter ventilation rules Requirements for “cool roofs”
Bloomberg’s PlaNYC A call for a “ Greener, Greater New York” Improved transportation Better water quality  Prevent climate change (hybrid vehicles) New housing (clearing of brownfields) Convert open space to parks
Conclusion Standard coal is harmful to the environment and people The price of coal neglects externalities Coal can be “cleaned” and emit no pollution The U.S. has an abundant resource It should take advantage of it Clean-coal technology as a path to: Ensuring stable fuel prices and a growing economy Stop our dependency on imported fuels Maintain a healthy and clean environment New York can save money, lives, and the environment by adopting a clean-coal-based system and “Green” policy

Coal presentation

  • 1.
    Current Options, FutureProblems: New York City’s Current Fuel Options, the Energy Situation, and Their Effects on the Ecological Footprint Presented by: Yoni Jacobs HNRS 226
  • 2.
    Abstract Current energydecisions are not the best New York and U.S. too dependent on oil Fossil fuels have damaging effects Can coal be used? Should we switch to other energy sources? Nuclear Wind Solar
  • 3.
    Petroleum Dependency Countryis too dependent on imported oil Source: EIA, Annual Energy Outlook 2006
  • 4.
    Coal Production andConsumption “ America’s most abundant indigenous fuel source” 95% of U.S. fossil energy reserves 250 year supply Coal Production and Consumption: United States, 2005   Total [in million short tons] Coal Total [in Quadrillion Btus (Quads)] Energy Total [in Quadrillion Btus (Quads)] Percent of Total Coal Production 1,131.50 23.41 70.72 33.10% Coal Consumption 1,105.40 22.9 100.49 22.79%
  • 5.
  • 6.
    Higher Priced EnergyNo coal mines in state Must import via rail High transport cost High cost of living High natural gas, petroleum, electricity prices Good side – higher Btu content in NY coal
  • 7.
    Coal As AnOption Positives Cheap Base Price 250 years of domestic supply Clean-coal and other technology Could make coal a viable option Negatives Hard to change fuel source Destroy the environment CO 2 emissions Deforestation Climate change (global warming) Acid Rain Threat to society and health High externality costs
  • 8.
    Coal Prices Coalcheapest source Residential, Commercial, Industrial, Electric sectors Used as energy source 6% of time in NY Only accounts for .25% of energy expenditures $3.13/mmBtu of energy Compared to: $9.95 for Natural Gas $23.07 for Propane
  • 9.
    Proposed Expenditure ChangesProposed Expenditure Changes Currently : Coal Price (2004) Residential  $4.96/mmBtu Commercial  $2.26/mmBtu Industrial  $2.18/mmBtu Electric Generation  $1.54/mmBtu (U.S. Average) Net Energy Consumed (2004) Residential  846.2 trillion Btu Commercial  698.7 trillion Btu Industrial  252.3 trillion Btu Estimated Expenditures (Based on Current Energy Sources) Residential  $14.8 billion Commercial  $12.8 billion Industrial  $2.3 billion Coal Based : Estimated Expenditures (Based on a Coal System) Residential  846.2 trillion Btu at $4.96/mmBtu  846,200,000 mmBtu * $4.96 = $4,197,152,000 Commercial  698.7 trillion Btu at $2.26/mmBtu  698,700,000 mmBtu * $2.26 = $1,579,062,000 Industrial  252.3 trillion Btu at $2.18/mmBtu  252,300,000 mmBtu * $2.18 = $550,014,000
  • 10.
    Coal’s Real Cost: “Inconsistent with society’s best interests (Cherry and Shogren, 6)” Market Failure Damage to environment, society, and health Externalities not accounted for in market price If they were, cost would be much higher Market Solution True cost  socially and economically cheapest source Not just cheapest market price
  • 11.
    Externalities Land ClearingLoss of habitat Increased flooding Coal extraction Property damage Water + air contamination Noise pollution Worker death + injury Processing and disposal Acid mine drainage Regulating + insurance cost Damage to water quality Transportation of coal Damage to roads Railroad construction and maintenance Deaths from accidents Utilization Air pollution Emissions Asthma Other respiratory disease Death Waste Acid Rain
  • 12.
    Coal’s Real Cost(cont.) $30/ton market price Acid rain ~ $11/ton Climate change ~ $4/mmBtu Social costs ~ 200% of base cost High of 464% for pollution costs Source: (Cherry and Shogren, “Social Cost of Coal”) Could be the most under-priced energy Cost is appr. $190/ton - $220/ton
  • 13.
    Clean-Coal Technology Coalcontributes to 81% of CO 2 emissions related to power generation Elimination of carbon dioxide Re-use, absorption, etc. Zero-emissions an achievable goal No longer the “black sheep of the energy family”
  • 14.
    Clean-Coal Methods IntegratedGasification Combined-Cycle Plant (IGCC) Gasification Partial combustion “ Syngas” produced, Sulfur Dioxide easily removed Combined Cycle CO 2 captured from gas streams Little or no emissions OxyFuel Method Burning fuel in pure oxygen Nitrogen easily removed Cheaper and easier energy extraction
  • 15.
    CO 2 Recycling Source: Sandia, Coal Combustion
  • 16.
    Clean Coal Technology:FutureGen Systems Source: Miller, Tech Innovation and Development
  • 17.
    Clean-Coal As ASolution Abundant supply for 250 years Use our resources Stabilize energy prices Importing keeps prices high Clean-Coal could lower or eliminate pollution Keep the environment clean
  • 18.
    Ecological Footprint DecreaseOpportunity Current New York Primary Energy Consumption : 4,057.4 tBtu = 4.0574 * 10 12 Btu If 1 Btu = .00105506 Megajoules (MJ) 4.0574 * 10 12 Btu = 4,280,800,444 MJ Assuming Clean Coal Technology will achieve zero emissions : If 46,600 Megajoules = 1 global hectare 4,280,800,444 MJ = 91,862.67047 global hectares New York’s Ecological Footprint will be reduced by: 91,862.67047 global hectares ( 226,997.602 acres)
  • 19.
    Green Buildings/Roofs AdvantagesIncreased efficiency Less wasted energy Reduced storm water runoff Improved air quality Implementation Rebates Stricter ventilation rules Requirements for “cool roofs”
  • 20.
    Bloomberg’s PlaNYC Acall for a “ Greener, Greater New York” Improved transportation Better water quality Prevent climate change (hybrid vehicles) New housing (clearing of brownfields) Convert open space to parks
  • 21.
    Conclusion Standard coalis harmful to the environment and people The price of coal neglects externalities Coal can be “cleaned” and emit no pollution The U.S. has an abundant resource It should take advantage of it Clean-coal technology as a path to: Ensuring stable fuel prices and a growing economy Stop our dependency on imported fuels Maintain a healthy and clean environment New York can save money, lives, and the environment by adopting a clean-coal-based system and “Green” policy