Clustering is the use of unsupervised techniques for grouping similar objects In , unsupervised refers to the problem of finding hidden structure within unlabeled data.
What is clustering?
•Clustering is the use of unsupervised techniques for grouping
similar objects.In machinelearning, unsupervised refers to the
problem of finding hidden structure within unlabeled data.
• Clustering methods find the similarities between objects
according to the object attributes and group the similar objects
into clusters. Clustering techniques are utilized in marketing,
economics, and various branches of science.
3.
K-MEANS:
• k-means isan analytical technique that, for a chosen value of k,
identifies k clusters of objects based on the objects’proximity to the
center of the k groups.
• The center is determined as the arithmetic average(mean) of each
cluster’s n-dimensional vector of attributes.
• Somespecific applications of k-means are image processing, medical,
and customer segmentation.
4.
Overview of theMethod : Algorithm
• To illustrate the method to find k clusters from a collection of M
objects with n attributes,the two-dimensional case (n= 2) is examined.
It is much easier to visualize the k-means method in two dimensions.
• The cluster‘s mean is called a centroid.
• A centroid refers to a point that corresponds to the center of mass for
an object.
5.
Steps:
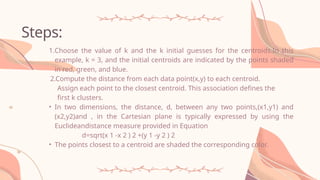
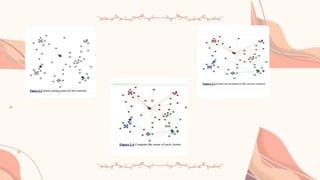
1.Choose the valueof k and the k initial guesses for the centroids.In this
example, k = 3, and the initial centroids are indicated by the points shaded
in red, green, and blue.
2.Compute the distance from each data point(x,y) to each centroid.
Assign each point to the closest centroid. This association defines the
first k clusters.
• In two dimensions, the distance, d, between any two points,(x1,y1) and
(x2,y2)and , in the Cartesian plane is typically expressed by using the
Euclideandistance measure provided in Equation
d=sqrt(x 1 -x 2 ) 2 +(y 1 -y 2 ) 2
• The points closest to a centroid are shaded the corresponding color.
6.
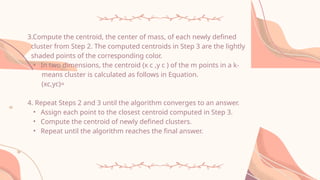
3.Compute the centroid,the center of mass, of each newly defined
cluster from Step 2. The computed centroids in Step 3 are the lightly
shaded points of the corresponding color.
• In two dimensions, the centroid (x c ,y c ) of the m points in a k-
means cluster is calculated as follows in Equation.
(xc,yc)=
4. Repeat Steps 2 and 3 until the algorithm converges to an answer.
• Assign each point to the closest centroid computed in Step 3.
• Compute the centroid of newly defined clusters.
• Repeat until the algorithm reaches the final answer.
7.
Example:
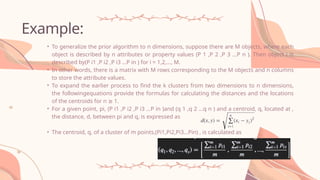
• To generalizethe prior algorithm to n dimensions, suppose there are M objects, where each
object is described by n attributes or property values (P 1 ,P 2 ,P 3 …P n ). Then object i is
described by(P i1 ,P i2 ,P i3 …P in ) for i = 1,2,…, M.
• In other words, there is a matrix with M rows corresponding to the M objects and n columns
to store the attribute values.
• To expand the earlier process to find the k clusters from two dimensions to n dimensions,
the followingequations provide the formulas for calculating the distances and the locations
of the centroids for n 1.
≥
• For a given point, pi, (P i1 ,P i2 ,P i3 …P in )and (q 1 ,q 2 …q n ) and a centroid, q, located at ,
the distance, d, between pi and q, is expressed as
• The centroid, q, of a cluster of m points,(Pi1,Pi2,Pi3…Pin) , is calculated as
9.
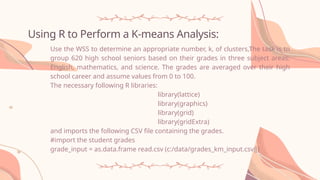
Using R toPerform a K-means Analysis:
Use the WSS to determine an appropriate number, k, of clusters,The task is to
group 620 high school seniors based on their grades in three subject areas:
English, mathematics, and science. The grades are averaged over their high
school career and assume values from 0 to 100.
The necessary following R libraries:
library(lattice)
library(graphics)
library(grid)
library(gridExtra)
and imports the following CSV file containing the grades.
#import the student grades
grade_input = as.data.frame read.csv (c:/data/grades_km_input.csv‖)
10.
The following Rcode formats the grades for processing. The data file contains four
columns.
The first column holds a student identification (ID) number, and the other three columns
are for the grades in the three subject areas.
kmdata_orig=as.matrix(grade_input[,c(―Student‖,―English‖,―Math‖,―Science‖)])
kmdata <- kmdata_orig[,2:4]
kmdata[1:10,]
English Math Science
[1,]99 96 97
[2,]99 96 97
[3,]98 97 97
[4,]95 100 95
[5,]95 96 96
[6,]96 97 96
[7,]100 96 97
[8,]95 98 98
11.
[9,]98 96 96
[10,]9999 95
To determine an appropriate value for k, the k-means algorithm is used to identify
clusters for k = 1, 2, …, 15.
The following R code loops through several k-means analyses for the number of
centroids, k, varying from 1 to 15.
wss<- numeric(15)
for (k in 1:15)
wss[k] <- sum(kmeans(kmdata, centers=k, nstart=25)$withinss)
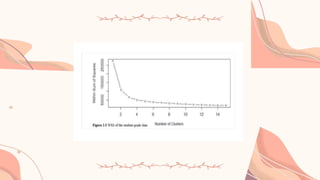
Using the basic R plot function, each WSS is plotted against the respective number of
centroids, 1 through 15.
plot(1:15, wss, type=―b‖, xlab=―Number of Clusters‖, ylab=―Within Sum of
Squares‖)
13.
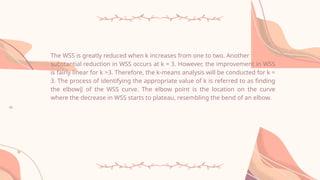
The WSS isgreatly reduced when k increases from one to two. Another
substantial reduction in WSS occurs at k = 3. However, the improvement in WSS
is fairly linear for k >3. Therefore, the k-means analysis will be conducted for k =
3. The process of identifying the appropriate value of k is referred to as finding
the elbow‖ of the WSS curve. The elbow point is the location on the curve
where the decrease in WSS starts to plateau, resembling the bend of an elbow.

![The following R code formats the grades for processing. The data file contains four
columns.
The first column holds a student identification (ID) number, and the other three columns
are for the grades in the three subject areas.
kmdata_orig=as.matrix(grade_input[,c(―Student‖,―English‖,―Math‖,―Science‖)])
kmdata <- kmdata_orig[,2:4]
kmdata[1:10,]
English Math Science
[1,]99 96 97
[2,]99 96 97
[3,]98 97 97
[4,]95 100 95
[5,]95 96 96
[6,]96 97 96
[7,]100 96 97
[8,]95 98 98](https://image.slidesharecdn.com/clustering-251114061329-3bee6da6/85/Clustering-algorithmic-nearest-neighbour-10-320.jpg)
![[9,]98 96 96
[10,]99 99 95
To determine an appropriate value for k, the k-means algorithm is used to identify
clusters for k = 1, 2, …, 15.
The following R code loops through several k-means analyses for the number of
centroids, k, varying from 1 to 15.
wss<- numeric(15)
for (k in 1:15)
wss[k] <- sum(kmeans(kmdata, centers=k, nstart=25)$withinss)
Using the basic R plot function, each WSS is plotted against the respective number of
centroids, 1 through 15.
plot(1:15, wss, type=―b‖, xlab=―Number of Clusters‖, ylab=―Within Sum of
Squares‖)](https://image.slidesharecdn.com/clustering-251114061329-3bee6da6/85/Clustering-algorithmic-nearest-neighbour-11-320.jpg)