Clinical use of high-efficiency hemodialysis treatments- Long-term assessment
1. Hemodialysis International 2006; 10: 73–81
Clinical use of high-efficiency hemodialysis
treatments: Long-term assessment
Juan P. BOSCH,1 Susie Q. LEW,2 Viroj BARLEE,1 Gary J. MISHKIN,3 Beat von ALBERTINI4
1Gambro Healthcare Inc., Lakewood, Colorado, U.S.A.; 2George Washington University, Washington,
District of Columbia, U.S.A.; 3Alcavis International Inc., Gaithersburg, Maryland, U.S.A.; 4Clinique Cecil
Centre de Dialyse, Lausanne, Switzerland
Abstract
Significant technological changes in blood flow rate, dialyzer membrane permeability, bicarbonate
dialysate, and ultrafiltration-controlled delivery systems permitted the implementation of 3 modi-fications
to conventional hemodialysis as follows: high-efficiency hemodialysis (HEHD), high-flux
hemodialysis (HFHD), and double-high-flux hemodiafiltration (HDF). The impact of these techniques
on the quantity of the treatment administered and treatment time were assessed. One hundred and
eighty-three patients were enrolled over 6 years. Monthly Kt/Vurea and dialysis treatment time were
compared among the treatment techniques. In vivo extracorporeal clearances were measured for the
dialyzers used. In vivo kinetically derived effective dialyzer clearances were calculated from Kt/V.
Patient survival and standardized mortality ratio (SMR) were determined for each treatment modality.
Treatment time averaged 192 28, 176 29, and 159 32 min, Kt/Vurea averaged 1.33 .34,
1.29 .30, 1.41 .32, and in vivo delivered urea clearance averaged 222 51, 272 34, and
333 43 mL/min for HEHD, HFHD, and HDF, respectively. These results were achieved even in pa-tients
with body weights in excess of 80 kgs. Net ultrafiltration rate during the treatment reached
20–30 mL/min, without clinical untoward effects. Blood flow rate ranged between 450–650 mL/min
in all patients. Kaplan-Meier Survival analysis yielded a significant difference when high-efficiency
treatments were compared with USRDS outcomes. Standardized mortality ratio analysis showed
significance for only HDF vs. USRDS. High-efficiency treatments can provide the same quantity of
treatment in a shorter period of time without affecting mortality. The increased spectrum of solutes
removal provided by HFHD and HDF may be a further advantage of these treatments.
Key words: Double high-flux hemodiafiltration, hemodialysis, high-efficiency hemodialysis, high-flux
hemodialysis
INTRODUCTION
Significant technological changes in hemodialysis have
occurred over the last 2 decades. Blood flow rates in ex-cess
of 250, from 300 to 500 mL/min, resulted in an in-crease
in dialyzer clearance without deleterious effects to
the patients.1,2 Patients did not tolerate urea clearances in
excess of 180 mL/min when sodium acetate was used in
the dialysate. A finite metabolic rate of acetate conversion
into bicarbonate was the limiting step in increasing the
treatment efficiency.3,4 Whereas, the institution of bicar-bonate
dialysate resulted in vascular stability,5 partial re-lief
of hypotension, and improvement in symptomatology.
The combination of increased blood flow rate and use
of bicarbonate dialysate resulted in urea clearances great-er
than 180 mL/min.
More permeable membranes, such as polysulfone
membrane and a series of modified cellulose membranes
which became available in 1984, facilitated the introduc-tion
of high-flux hemodialysis (HFHD) by increasing the
Correspondence to: S. Lew, MD, FACP, FASN, 2150
Pennsylvania Avenue, NW, Suite 4-425, Washington, DC
20037, U.S.A. E-mail: sqlew@gwu.edu
r 2006 The Authors. Journal compliation r 2006 International Society for Hemodialysis 73
2. spectrum of solutes removed during the treatment.6 The
clinical use of highly permeable membranes with high
blood flow rates, however, resulted in increased rates of
ultrafiltration and in many cases severe hypotension. This
complication limited the clinical application of high-flux
membranes. The wide use of HFHD was only possible
when volumetric control of ultrafiltration became incor-porated
into the hemodialysis equipment.
The objective of the dialysis treatment has evolved from
control of plasma urea levels early in the genesis of dial-ysis
to increases in the removal of middle molecules, and
now back to the removal of urea, albeit this time in re-lation
to body weight (Kt/V).7 It is ironic that when these
technological advances were ready for clinical use, the
objective of the treatment had shifted from the removal of
middle molecules to the removal of urea. The removal of
urea resulted in emphasizing the reduction in treatment
time without fully understanding the consequences of
using high blood flow rates and high urea clearances. A
backlash against these techniques had occurred and ef-forts
have been made to limit their application.8
The objective of this paper is to review the clinical ap-plication
of high-efficiency treatments over 6 years in one
outpatient facility. Clinical issues as well as the patients’
outcomes are discussed. These techniques represent a sig-nificant
advancement in the way dialysis is performed today.
Their application, however, requires a specialized knowl-edge
and a systematic quality control in their application.
METHODS
Patients (n=183) receiving hemodialysis in the outpatient
dialysis facility of George Washington University Medical
Center were studied over a 6-year period. (Table 1).
Treatment modalities are defined as follows:
1. Conventional hemodialysis is a hemodialysis treat-ment
having a urea clearance less than 180 mL/min.
Blood flow rate is 300 mL/min or less. Patients gen-erally
have compromised vascular access and may be
using percutaneous catheters. Bicarbonate dialysate
is used.
2. High-efficiency treatments are extracorporeal thera-pies
achieving urea clearances in excess of 180 mL/
min. All these therapies share blood flow rates over
300 mL/min and use bicarbonate dialysate.9
a. High-efficiency hemodialysis (HEHD) is a hemodi-alysis
treatment that uses a dialyzer made with cell-ulosic
or modified cellulosic membranes. Thus, the
spectrum of solutes cleared is limited. Ultrafiltration
is equal to the weight loss during the treatment.
b. High-flux hemodialysis (HFHD) is a hemodialysis
treatment that uses a dialyzer made with synthetic
or modified cellulosic high-flux membrane possess-ing
high Kuf and large surface area so that when
used in conjunction with high blood and dialysate
flow rates, it results in an increase in water and sol-ute
permeability. An ultrafiltration-controlled sys-tem
is used. The total volume of ultrafiltrate during
the treatment is greater than weight loss. In other
words, in addition to ultrafiltration for weight loss, a
considerable amount of fluid is exchanged by ultra-filtration
inside the filter (backfiltration).
c. Double high-flux hemodiafiltration (HDF) is an ex-tracorporeal
treatment that uses diffusion and con-vection
to remove solutes.10 A wide spectrum of
solutes is removed compared with the other treat-ments.
The volume of ultrafiltrate during the treat-ment
is much greater than the change in body
weight during the treatment. As in HEHD, in addi-tion
to ultrafiltration for weight loss, a considerable
amount of fluid is exchanged by ultrafiltration in-side
the filters (backfiltration). In order to perform
Double High-Flux hemodiafiltration, modifications
in the standard dialysate path must be made. Two
synthetic or modified cellulosic high-flux mem-brane
dialyzers are used in series for this treatment
modality.
Patient characteristics for the treatment groups are in-cluded
in Table 2. Patients were initially assigned to a
treatment modality according to their vascular access and
blood flow rate potential. Those patients with the best
access were selected for HFHD or HDF. Patients with high
blood flow rates, but who were unwilling to reuse dial-yzers,
were assigned to HEHD. Since most patients had
high blood flow rates, body weight eventually became the
predominant selection factor for treatment modality. Pa-tients
with body weight over 75 kg were referred for HDF.
Patients were allowed to move to another treatment mo-dality
depending on their needs and vascular access.
There were no other specific inclusion or exclusion cri-teria
for assigning patients to a treatment modality except
for potential blood flow rate.
In HEHD, the delivery systems were Fresenius 2008 C,
D, and E (Fresenius, Medical Care North America, Le-xington,
MA, U.S.A.); Althin System 1000 (Althin Med-ical
Inc., Miami Lakes, FL, U.S.A.); and B. Braun Secura
(B. Braun Medical Inc., Bethlehem, PA, U.S.A.). Baxter CA
hollow fiber (Baxter Healthcare Corporation, McGaw
Park, IL, U.S.A.) and, Gambro 6N, Gambro Alpha 600
and Alpha 700 (Gambro Renal Products, Lakewood, CO,
Bosch et al.
74 Hemodialysis International 2006; 10: 73–81
3. Table 1 Patients per year (top) and patient percent modality distribution by year in study (bottom)
Year on dialysis Year 0 Year 1 Year 2 Year 3 Year 4 Year 5 Year 6
First year (incident Pt) 56 14 23 29 26 17 28
Second year on treatment 46 10 17 20 15 10
Third year on treatment 33 5 11 17 11
Fourth year on treatment 22 4 8 15
Fifth year on treatment 14 3 8
Sixth year on treatment 12 2
Seventh year on treatment 9
Total Pt per year 56 60 66 73 75 72 83
Modality distribution n (%)
CHD 12 (20) 7 (10) 6 (8) 4 (5) 2 (3) 2 (2)
HEHD 23 (38) 23 (35) 22 (30) 26 (35) 14 (20) 20 (25)
HFHD 24 (40) 39 (45) 23 (32) 24 (32) 30 (41) 36 (43)
HDF 1 (2) 7 (10) 22 (30) 21 (28) 26 (36) 25 (30)
CHD=conventional hemodialysis; HEHD=high-efficiency hemodialysis; HFHD=high flux hemodialysis; HDF=hemodiafiltration.
U.S.A.), cuprophan, parallel plate, single-use dialyzers
were used. Dialysate flow rates ranged from 500–800 mL/
min. In HFHD, the delivery systems were the Fresenius
2008 C, D, and E and Althin System 1000. The dialyzers
used were hollow fiber cellulose triacetate Baxter CT-
190G, and Fresenius polysulfone hollow fiber F80, F80A,
and F80B (Fresenius, Medical Care North America). All
of these dialyzers were reused, and reuse ranged from 6–
10 uses per dialyzer. Dialysate flow rates varied from
750–800 mL/min. In Double High-Flux HDF, the delivery
system included Fresenius 2008 C, D, and E, modified
with a dialysate flow rate of 800 mL/min. Double High-
Flux HDF was performed using 2 large dialyzers con-nected
in series with a dialysate flow restrictor between
the dialyzers to enhance the filtration and backfiltration
in the dialyzers. It provides both a large membrane sur-face
area for diffusion and high rates of simultaneous ul-trafiltration
with replacement by backfiltration of
prefiltered dialysate.10 The dialyzers used were Fresenius
F80 2, Hospal acrilonitrile Filtral 20 2, Baxter cellu-lose
triacetate CT-190G 2, and Toray B1-2.1-U 2.
Dialyzers were reused, and reuse ranged between 6–10
uses per dialyzer.
Effective blood flow rates during dialysis were calculat-ed
from the pump digital readout (recorded blood flow).
The pre-pump negative pressure (arterial pressure) was
measured during the treatment, as described previously.11
Bloodlines were able to withstand the high pressures
encountered. Large 8-mm diameter pump segments were
used in all treatments. Fifteen gauge-size needles (1.8mm
diameter 1 in. in length) were used with HFHD, while
14 gauge needles (2.0mm diameter 1 in. in length)
were used in HDF.
Bicarbonate dialysate was prepared according to the
AAMI standards for water quality, including microbial
and endotoxin levels. In HFHD and HDF, where backfil-tration
does occur, the dialysate was ultrafiltrated prior to
reaching the dialyzer. This technique has been published
previously.12
Dialyzers were reprocessed automatically using Sera-tronic
DRS 4 systems. Dialyzers were first cleaned using
RO water, which met AAMI standards, with reverse
ultrafiltration pressure combined with 0.4% of sodium
hypochlorite (NaOCl) solution for a short time as regu-lated
by the DRS 4 system. Automatic measurements for
volume, fiber leak test, and Kuf were performed. Dial-yzers
were subsequently filled with 4% formalin disin-fectant
and stored for a minimum of 24 hr before reuse.
In vitro extracorporeal clearance was obtained from the
manufacturer’s published data or calculated from the re-ported
KoA using Michael’s equation, as quoted by Bosch
and Ronco.13 In vivo extracorporeal clearance was calcu-lated
from 10-min clearance periods in which Qb re-mained
stable. Pre and post dialyzer blood samples were
analyzed for urea nitrogen. Only experiments with a mass
balance error o5% were utilized for analysis. Clearances
Table 2 Patient characteristics by treatment modality
Characteristics HEHD HFHD HDF
Males/females 48/52 55/45 78/22
Hypertension (%) 24 39 26
Diabetes (%) 37 20 15
Other (%) 39 41 59
HEHD=high-efficiency hemodialysis; HFHD=high flux hemodial-ysis;
HDF=hemodiafiltration.
High-efficiency hemodialysis treatments
Hemodialysis International 2006; 10: 73–81 75
4. were calculated using the mass removed during the pe-riod
divided by the mid period plasma concentration,
calculated from the average of the pre-and post dialyzer
blood samples.
In vivo kinetically derived effective dialyzer clearance
was calculated in 10 separate treatments for each modal-ity
and was derived from the urea clearance using stand-ard
equations.
ðKmL= minÞ ðt minÞ=ðV mLÞ ¼ X
K mL= min ¼ ðXÞ ðV mLÞ=ðt minÞ
X is the Daugirdas Formula-Derived Kt/V14; K is the
clearance in mL/min; t is the time in minutes; and V is
the body volume in mL, and is calculated using Watson’s
formula.15 The Kt/V was calculated from the pre and post
treatment urea nitrogen concentration and the Daugirdas
formula.14 All post treatment samples were obtained 10–
15-min post treatment when the patient was completely
disconnected from the dialysis machine. The more effi-cient
the treatment, the greater the period allowed for
equilibration.16,17
Steady-state pretreatment chemistries were measured on
the first dialysis session (Monday or Tuesday) of the first
week of each month. Analyses were carried out using Ektac-hem
9501RC in the routine chemistry laboratory of the
medical center. Albumin levels were measured using the
bromcresol green method.18 Yearly averages were calculated.
Patient survival was assessed by the log-rank test ap-plied
to the Kaplan-Meier survival estimates using the
Statview Survival Tools (Abacus Concepts Inc., Berkley,
CA, U.S.A.). Patient records verified dialysis initiation
date. Date of death was verified by death certificate. Miss-ing
data were resolved by contacting the Mid Atlantic
Renal Coalition Databank. United States hemodialysis pa-tient
survival was determined by USRDS survival statistics
for 1, 2, 5, and 10 years, weighted for our patient pop-ulation
accounting for primary diagnosis, age, race, and
sex.18 Standardized mortality ratio for prevalent hemodi-alysis
patients during the study period was calculated us-ing
the software provided by the USRDS and as described
by Wolfe et al.19,20 Patients were divided by treatment
modality. Patients were only included after 90 days of
ESRD on hemodialysis. A 60-day carryover period was
performed when a patient changed hemodialysis modal-ity.
Significance for both the Kaplan-Meier and SMR anal-ysis
was considered at the po0.05 level.
RESULTS
The Kt/V at the start of the study averaged 1.0 0.2, with
an average treatment time of 240 29 min. By the end of
the study period, the average Kt/V for all the high-effi-ciency
treatments increased to 1.35 0.3 and the treat-ment
time was reduced to 180 29 min. Similarly, there
was an increase in the average quantity of treatment de-livered
from 40.5 4.5 to 54.9 7.7 L of urea clearance
per treatment.
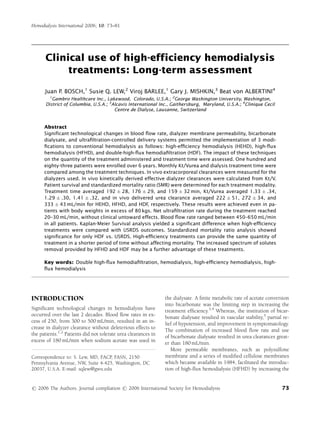
Figure 1 depicts the monthly means SD for treatment
time in min (panel A), the delivered Kt/V (panel B), the net
ultrafiltration rate during the treatment in mL/min (panel
C), and the patient’s weight in kilograms (panel D) for all 3
treatment modalities. Treatment time for the 6 years of
observation averaged 192 28 for HEHD, 176 29 for
HFHD, and 159 32 min for HDF. The mean Kt/V during
the study period was 1.33 0.34, 1.29 0.30, and
1.41 0.32 for HEHD, HFHD, and HDF, respectively.
These large quantities of therapy were given to patients
regardless of their body weight. Figure 1 (panel C) shows
the mean SD net ultrafiltration rate for the 3 treatment
modalities. Notice that as a result of the shorter treatment
time, net ultrafiltration rates were as high as 20–30 mL/
min. Figure 1 (panel D) shows the mean SD patient
weight. This figure shows that the larger weight patients
were assigned to the more efficient treatments.
Figure 2 depicts the average monthly recorded blood
flow rate for each of the 3 treatment modalities. Negative
arterial pressure in excess of 300 mmHg was not ob-served.
This was because of the use of large-diameter
needles with short length. Blood flow rates between 450–
500 mL/min were achieved in almost all patients, and in
excess of 600 mL/min in a few. These patients benefited
from HDF.
Table 3 depicts the calculation of the in vivo kinetically
derived effective dialyzer clearance. In HEHD, in vivo ki-netically
derived effective dialyzer urea clearance averaged
222 51 mL/min at a blood flow rate of 455 83
mL/min. In HFHD, effective urea clearance averaged
272 34 mL/min at a blood flow rate of 500 0 mL/
min. In HDF, urea clearance averaged 333 43 mL/min
at a blood flow rate of 640 21 mL/min. HEHD is dif-ferent
from HFHD and HDF, and HFHD is different from
HDF (po0.05). The relationship between the in vivo ex-tracorporeal
clearance and the in vivo kinetically derived
effective dialyzer clearance is shown in Figure 3. In gen-eral,
there was an excellent correlation between the in
vitro manufacturer clearance and the measured in vivo
extracorporeal clearance. The calculation of the in vivo
extracorporeal clearance from the manufacturer-reported
KoA was also adequate.13 From our data, it is apparent
that the in vivo extracorporal clearance can be adequately
derived from the manufacturer data and/or the KoA and
available equations.
Bosch et al.
76 Hemodialysis International 2006; 10: 73–81
5. 225
200
175
150
125
Panel A
1.6
1.5
1.4
1.3
1.2
1.1
High-efficiency hemodialysis treatments
# # #
@, $
Panel C Panel D
30
25
20
15
@ @, $
Table 4 depicts the average monthly chemistries for the
last year of this study. No significant differences were
noted between treatment modalities. Acid/base and nu-tritional
parameters were adequate.
Kaplan-Meier Survival Curves for the overall unit, in-cluding
all treatment modalities, compared with the US-RDS
are shown in Figure 4. Standardized mortality ratios
for each of the high-efficiency treatment modalities com-pared
with USRDS are also shown, Figure 5.
85
80
75
70
65
DISCUSSION
High-efficiency hemodialysis treatments result in a sig-nificant
reduction in treatment time without compromis-ing
the quantity (liters of clearance) or the quality
(treatment tolerance) of the delivered dialysis prescrip-tion.
It must be pointed out that HEHD, HFHD, and HDF
also result in a significant increase in ‘‘middle molecule
clearance’’ compared with conventional HD. On average,
100
Rx Time (min)
Year
60
Patient Weight (kg)
Year
10
Ultrafiltration Rate (ml/min)
Yr0
Yr1
Yr2
Yr3
Yr4
Yr5
Yr6
Yr0
Yr1
Yr2
Yr3
Yr4
Yr5
Yr6
Yr0
Yr1
Yr2
Yr3
Yr4
Yr5
Yr6
Yr0
Yr1
Yr2
Yr3
Yr4
Yr5
Yr6
Year
Panel B
1
Kt/V
Year
@HEHD v HFHD p.05
#HFHD v HDF p.05
$HEHD v HDF p.05
@
@
@
@, $
@, $
@,$ @,$ @,$
@, $
#
#
#
#
#
#
#
@
@
@
# #
#
@, $
@,$ @,$
@, $
#
#
#
@, $
#
#
#
#
@, $
@, $
@, $
@, $
@, $
#
Figure 1 For Panels A, B, and C: HEHD HFHD HDF. Panel A: Average treatment time for each high-efficiency
modality for each year of the study. Treatment times were increased in year 4 (Year 4) as urea rebound became a
concern. Panel B: Increase in Kt/V as the inception of high-efficiency treatments. In Year 1, ‘‘adequate’’ Kt/V was increased from
1.0 to 1.2. By Yr 4, Kt/V was approximately 1.3, with a posturea sample taken 10 min after treatment. Panel C: Average
ultrafiltration rate (mL/min) for the high-efficiency therapies. Ultrafiltration rates greater than 30 mL/min were achieved
without complications. Panel D: HEHD HFHD HDF. Patients’ body weights for each of the 3 treatments for each year.
HDF was prescribed for patients weighing more than 75 kg.
Hemodialysis International 2006; 10: 73–81 77
6. Bosch et al.
700
600
500
400
300
200
100
0
HEHD
HFHD
HDF
# # # #
@ $
# #
@, $
@, $
@, $
@, $ @, $
Yr 0 Yr1 Yr 2 Yr 3 Yr 4 Yr 5 Yr 6
Year
Blood Flow (ml/min)
@HEHD v HFHD p.05
#HFHD v HDF p.05
$HEHD v HDF p.05
Figure 2 Recorded blood flow rates for each of the 3 treat-ments.
These values are the recorded blood flow rates and
are not the effective blood flow rates.
conventional HD provides 4.8 L of inulin clearance.21
Using inulin clearance data from a previous study21 we
estimate HEHD, HFHD, and HDF provide, in a typical
treatment, approximately 7.7, 21.1, and 31.8 L of inulin
clearance, respectively.
The significant reduction in treatment time encourages
patient rehabilitation. It also permits an increase in the
productivity of the dialysis unit. The number of treat-ments
Y = 0.75 X + 105
150 350
200 250 300 400 450
In vivo Extracorporeal
Urea Clearance (ml/min)
450
400
350
300
250
200
150
Figure 3 In vivo extracorporeal urea clearance vs. the in vivo
delivered urea clearance. The slope of the line implies a re-duction
in clearance of approximately 25%.
provided in this period by the facility increased
In Vivo Delivered Urea Clearance (ml/min)
without changes in personnel. Each station treated 6.9
patients per week compared with the industry standard in
the USA of 6.0 patients per week.
Early in the application of these treatment modalities,
we became aware of the intercompartmental resistance or
double-pool phenomenon observed with high urea clear-ances.
16,17 For this reason, all of our posttreatment blood
samples were obtained 10–15 min after discontinuation
of the treatment when the patient was completely dis-connected
from the dialysis machine.22 This time interval
Table 3 Patient treatment averages for high-efficiency hemodialysis (HEHD), high-flux hemodialysis (HFHD), and hem-odiafiltration
(HDF)
Modality HEHD HFHD HDF
Td (min) ( SD) 192 (28)ab 176 (29)c 159 (32)
Qb (mL/min) ( SD) 455 (83)ab 500 (0)c 640 (21)
Pre-Wt (kg) ( SD) 57.8 (5.38)ab 73.3 (4.9)c 91.2 (20.9)
DWt ( SD) 2.7 (0.8)ab 3.4 (1.0) 3.6 (1.2)
Kt/V ( SD) 1.33 (0.34)a 1.29 (0.30)c 1.41 (0.32)
In vivo extracorporeal urea clearance (mL/min) ( SD) 294 (27)ab 362 (0)c 444 (6)
In vivo delivered urea clearance (mL/min) ( SD) 222 (51)ab 272 (34)c 333 (43)
Din CL (%) ( SD) 25 (14) 25 (9) 25 (10)
aHEHD vs. HFHD, po0.05.
bHEHD vs. HDF, po0.05.
cHFHD vs. HDF, po0.05.
Din CL=in vitro urea clearance (manufacturer’s published clearance)delivered urea clearance (actual delivered clearance calculated from
the Daugirdas formula (Kt/V)D, the treatment time, and the anthropometric body volume); pre-Wt=weight before dialysis; Qb=recorded
blood flow; Td=treatment time; Dwt=predialysis weightpostdialysis weight.
78 Hemodialysis International 2006; 10: 73–81
7. obliterates most of the urea rebound phenomena ob-served
at high urea clearances. If this period for equili-bration
is not allowed, the quantity of treatment
administered would be exaggerated and the amount of
urea removed would be overestimated.
The reduction in treatment time requires an increase in
the net ultrafiltration rate (mL/min) during the treatment.
This was achieved without clinically untoward effects. In
HFHD and HDF, in addition to the increase in ultrafiltra-tion
rate, a considerable but undetermined amount of
back filtration occurred. No clinical side effects were
observed. It has been speculated that the upper limit of
patient stability appears to be a maximum of 2 kg/hr of
High-efficiency hemodialysis treatments
fluid removal.23 This was also our experience. In most of
our patients, we were able to reach their dry weight with-out
side effects.
The lack of pyrogenic reactions observed during the
course of the study may be related to the filtration of the
dialysate used in our HFHD and HDF circuit.13 This
modification would appear to be an essential additional
safety measure when using these treatment modalities.
The clinical application of these treatment modalities
requires strict adherence to the prescribed treatment
time. Patients and staff must be aware that the shorter
the treatment time, the greater the impact of non-com-pliance
on the delivery of the prescription. Common
causes for loss of efficiency during the treatment were
keep: alarm conditions, dialysate bypass condition, re-duction
of blood flow rate in the presence of hypotension,
and vascular access problems during the treatment. If the
blood flow rate is decreased for a period of time, the du-ration
of the treatment should be extended to compen-sate.
These treatments were possible because high blood
flow rates were obtained in our patients. The needles
used to cannulate the vascular access were always be-tween
1.8–2.0mm in diameter and 1 in. in length. Small-
Table 4 Patient chemistries by treatment modality for study year 6
Patient chemistries HEHD (SD) HFHD (SD) HDF (SD)
Albumin (g/dL) 3.9 (0.5) 3.9 (0.4) 4.0 (0.3)
Alkaline phosphatase (m/L) 125.6 (77.5) 115.0 (70.5) 95.6 (51.7)
Calcium (mg/dL) 9.1 (0.9) 9.3 (1.0) 9.2 (0.9)
Creatinine (mg/dL) 13.3 (4.2) 13.1 (3.5) 14.8 (3.2)
Phosphorus (mg/dL) 5.8 (2.0) 5.7 (0.7) 5.5 (1.8)
Total CO2 (mmol/L) 21.8 (3.3) 20.9 (3.5) 21.8 (2.5)
Hct (%) 29.1 (5.9) 30.0 (4.5) 30.1 (4.8)
HDF=hemodiafiltration; HEHD=high-efficiency hemodialysis; HFHD=high flux hemodialysis.
*
Years on Dialysis
Cumulative Survival
1.0
0.8
0.4
0.2
0.0
*
*
GWU-ADC
USRDS
0.6
*
* p.05
0.0 2.5 5.0 7.5 10.0
Figure 4 Kaplan-Meier survival curves for patients on high-efficiency
treatments in our center (GWU). USRDS survival
curves were created using all patient USRDS survival data on
years 1, 2, 5, and 10, weighted for our patient population’s
characteristics. Log-rank test yielded a significant difference
in survival between the 2 groups (po0.05).
1.5
1
0.5
0
USRDS HEHD HFHD HDF
SMR
p0.05
1.00 0.98 0.70 0.41
Figure 5 The standardized mortality ratio (SMR) reached
significance for HDF only. Although SMR was less than 1.0
for HEHD and HFHD, significance was not reached. This
implies that the reduction in treatment time was not associ-ated
with an increase in relative risk.
Hemodialysis International 2006; 10: 73–81 79
8. er and longer needles do not permit the safe use of these
flows as they create large negative pressure gradients,
which adversely compromise the effective blood flow
rate.
Recirculation is of relatively minor importance in con-ventional
hemodialysis. In high-efficiency hemodialysis,
however, undetected recirculation can rapidly result in
underdialysis and increased morbidity. Recirculation in
our patients was monitored periodically and was an im-portant
issue in the quality control of these treatments.
The in vivo kinetically derived effective dialyzer urea
clearance was consistently 25% lower than the in vivo
extracorporeal urea clearance. (Figure 3) This difference
was most likely because of recirculation, loss of surface
area, differences in actual treatment time, blood flow
changes during the treatment, etc. This difference was
consistent but of variable magnitude from patient to pa-tient.
Knowledge of both the extracorporeal and kinetic-ally
derived effective dialyzer clearances provides a
valuable tool to assess the delivery of the prescription.
If a difference between the in vivo measured extracorpo-real
urea clearance and the calculated in vivo kinetically
derived effective dialyzer urea clearance is less than
15%, this observation must be attributed to an unequil-ibrated
post treatment blood sample, and the quantity
of treatment delivered is being overestimated. If the dif-ference
is greater than 25%, increasing recirculation,
shorter treatment time than prescribed, or other techni-cal
problems may have occurred during the delivery of
the treatment.
It is of interest to note that if the current standard of
practice of a Kt/V of 1.2 or better is applied, few patients
can be treated with conventional dialysis for less than 4 hr
with dialyzers of 1.8m2 as described in this paper. For
example, a 70 kg patient with a urea space of 42 L treated
with an in vivo extracorporeal urea clearance of 250 mL/
min would require 269 min of treatment to provide a Kt/
V=1.2. Few patients in the United States are treated in
excess of 4 hr. An in vivo extracorporeal dialyzer clear-ance
of 250 mL/min can only be achieved by a dialyzer
with a KoA of 800 and a blood flow rate in excess of
500 mL/min. Our studies suggest that an in vivo extra-corporeal
clearance of 250 mL/min would only provide
an in vivo kinetically derived effective dialyzer clearance
of 187.5 mL/min. Clearly, to achieve treatment times of
less than 4 hr, while providing a Kt/V of 1.2 or higher to
patients over 70 kg, these high-efficiency treatments are
needed. However, a dialyzer with a larger surface area of
2.1m2 (i.e., PSA-210, Baxter Healthcare, Renal Division,
McGaw, Park, IL, U.S.A.) may achieve a treatment time of
less than 4 hr. Assuming that the delivered clearance is
80% of ex vivo clearance, then the delivered clearances
are 210 mL/min for Qb 300 mL/min, 246 mL/min for Qb
400 mL/min, and 272 mL/min for Qb 500 mL/min.
Thus, a 70 kg person, assuming 60% body water
(V=42 L), would require 240 min (4 hr), 205 min (3 hr
25 min), and 185 min (3 hr 5 min) for Qb 300, 400, and
500 mL/min, respectively, to achieve a Kt/V of 1.2, where-as
patients weighing more than 80 kg may find it difficult
to achieve adequate dialysis in less than 4 hr even with a
larger dialyzer surface area and higher blood flow rates.
Increased quantity in treatment delivered, in particular
HFHD and HDF, resulted in improved outcomes. The
overall SMR was statistically better with HDF than the
national average. Recent studies have demonstrated better
survival with modified cellulose and synthetic mem-branes.
24 As our patients were selected in each modali-ty,
it is not possible for us to state better outcomes with
any particular treatment. On the other hand, we can state
that the reduction in treatment time did not result in
increased mortality.
Using a setup similar to double high-flux HDF, convective-controlled
double high-flux HDF compared with HFHD
in a 6-month trial resulted in higher beta2-microglobulin
clearance (106.2 15.4 vs. 48.9 6.1, po0.01), higher
Kt/V urea (2.4 0.4 vs. 2.0 0.4, po0.05), improved
quality of life, and no differences in clinical and technical
complications.24 In our opinion, HEHD is indicated in
low-size patients, less than 64 kg body weight with mod-erate
blood flow rate capabilities, between 300 and
400 mL/min. Large size patients will require treatment
times in excess of 180 min. High efficiency hemodialysis
allows for the delivery of increased quantity of treatment
in patients with blood flow rates greater than 400 mL/
min. Ultrafiltration rate was adequate for weight loss. Re-use
was avoided in HEHD.
In our opinion, HFHD is indicated in moderate-size
patients of 65 to 75 kg body weight with blood flow rate
capabilities greater than 400 mL/min. Reuse in this ther-apy
is optional. Patients with body weight in excess of
75 kg may require treatment times in excess of 180 min.
In our opinion, Double High-Flux HDF is indicated in
patients weighing more than 80 kg body weight because
of the efficiency of the treatment. Blood flow rate must be
in excess of 550 mL/min. Reuse is mandatory, given the
need to use 2 dialyzer filters during each treatment. This
treatment modality was the only therapy capable of de-livering
adequate treatment to patients over 80 kg within
180 min.
In conclusion, high-efficiency treatments can provide
the same quantity of dialysis in a shorter treatment time.
The increased spectrum of solutes provided by HFHD
Bosch et al.
80 Hemodialysis International 2006; 10: 73–81
9. and HDF may be another advantage of these treatment
modalities. Mortality rates were not affected by reduced
treatment time. Ultrafiltration rate was not a factor in re-ducing
treatment time.
Manuscript received November 2004; revised October
2005.
REFERENCES
1 Geronemus R, von Albertini B, Glabman S, Bosch JP.
High flux hemofiltration: Further reduction in treatment
time. Proc Clin Dial Transplant Forum. 1979; 9:125–127.
2 Kubota K, Kawauchi A, Nakajima M, Ohta H, Koike T,
Ishii J. Arteriovenous shunt flow measurement by ultra-sonic
duplex system. ASAIO Trans. 1987; 33:144–146.
3 Lundquist F. Production and utilization of free acetate in
man. Nature. 1962; 193:579–560.
4 Kveim M, Nesbakken R. Utilization of exogenous acetate
during hemodialysis. Trans Am Soc Artif Intern Organs.
1975; 21:138–143.
5 Graefe U, Milutinovich J, Follete WC, Vizzo JE, Babb AL,
Scribner BH. Less dialysis-induced morbidity and vas-cular
instability with bicarbonate in the dialysate. Ann
Intern Med. 1978; 88:332–336.
6 Streicher E, Scheneider H. The next generation of dialysis
membrane: Barriers or pathways. Contrib Nephrol. 1985;
44:127–136.
7 Gotch FA, Sargent JA. A mechanistic analysis of the Na-tional
Cooperative Dialysis Study (NCDS). Kidney Int.
1985; 28:526–534.
8 Held PJ, Levin NW, Bovbjerg RR, Pauly MV, Diamond
LH. Mortality and duration of dialysis treatment. JAMA.
1991; 265:871–875.
9 Keshaviah P, Collins A. Rapid high efficiency bicarbonate
hemodialysis. ASAIO Trans. 1986; 32:17–23.
10 Miller JH, von Albertini B, Gardner PW, Shinaberger JH.
Technical aspects of high-flux hemodiafiltration for ad-equate
short (under 2 hours) treatment. Trans Am Soc
Artif Intern Organs. 1984; 30:377–381.
11 Bosch JP, Barlee V, Valdecasas JG. Blood flow measure-ments
during hemodialysis. Adv Ren Replace Ther. 1994;
1:83–88.
High-efficiency hemodialysis treatments
12 Bosch JP. Should hemodialysis fluid be sterile? Semin Di-al.
1991; 6:30–32.
13 Bosch JP, Ronco C. High efficiency treatments: Risks and
common problems encountered in clinical application.
In: Bosch JP, Stein JH eds. Contemporary Issues in Ne-phrology:
Hemodialysis: High Efficiency Treatments. New
York, NY: Churchill Livingstone; 1993:209–224.
14 Daugirdas JT. Linear estimates of variable volume, single-pool
Kt/V: An analysis of error. Am J Kid Dis. 1993;
22:267–270.
15 Watson PE, Watson ID, Batt RD. Total body water vol-umes
for adult males and females estimated from simple
anthropometric measurements. Am J Clin Nutr. 1980;
33:27–39.
16 Abramson F, Gibson S, Barlee V, Bosch JP. Urea kinetic
modeling in hemodialysis at high urea clearance. J Am
Soc Nephrol. 1991; 2:312A.
17 Abramson F, Gibson S, Barlee V, et al. Urea kinetic mode-ling
at high urea clearances: Implications for clinical
practice. Adv Ren Replace Ther. 1994; 1:5–14.
18 Northan BK, Willowson GM. Determination of serum
albumin by autoanalyzer using bromcresol green. Assoc
Clin Biochem Tech Bull. 1967; 11:1.
19 Wolfe RA, Gaylin DS, Port FK, Held PJ, Wood CL. Using
USRDS generated mortality tables to compare local ESRD
mortality rates to national rates. Kidney Int. 1992;
42:991–996.
20 Wolfe RA. The standardized mortality ratio revisited:
Improvements, innovations and limitations. Am J Kid
Dis. 1994; 24:290–297.
21 von Albertini B, Bosch JP. Short hemodialysis. Am J Ne-phrol.
1991; 11:169–173.
22 Collins AL. High efficiency treatments using convention-al
equipment. In: Bosch JP, Stein JH eds. Contemporary
Issues in Nephrology: Hemodialysis: High Efficiency Treat-ments.
New York, New York: Churchill Livingstone,
1993;91–104.
23 Hakim RM, Held PJ, Stannard DC, et al. Effect of the
dialysis membrane on mortality of chronic hemodialysis
patients. Kidney Int. 1996; 50:566–570.
24 Pisitkun T, Eiam-Ong S, Tiranathanagul K, et al. Con-vective-
controlled double high flux hemodiafiltration: A
novel blood purification modality. Int J Artif Organs.
2004; 27:195–204.
Hemodialysis International 2006; 10: 73–81 81