Download to read offline

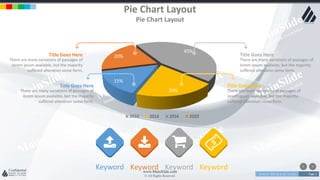


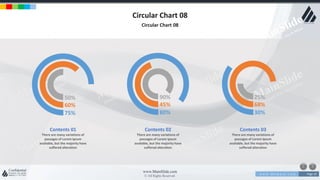


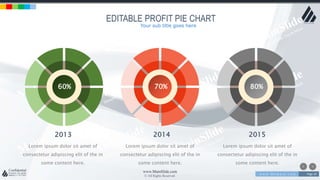


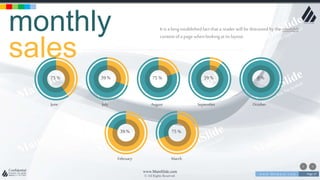


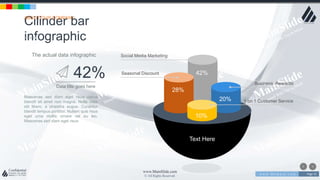


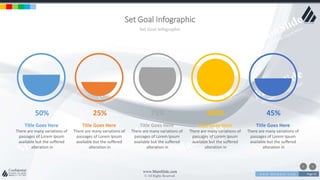

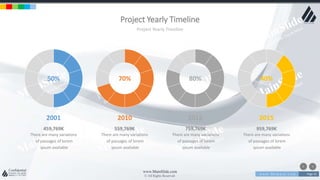


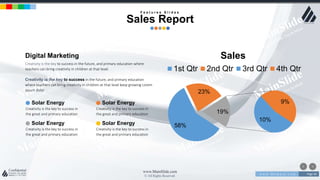


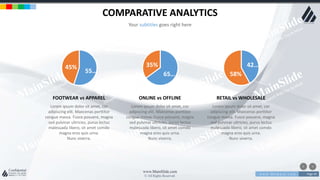
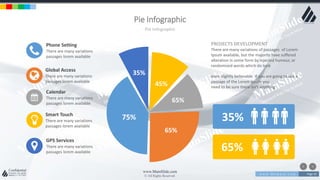


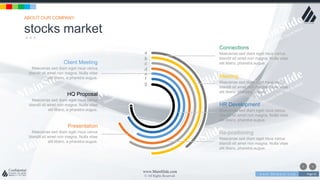


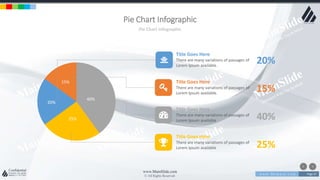


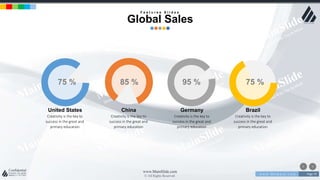


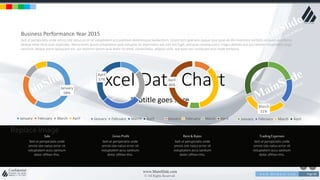


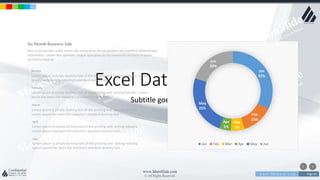

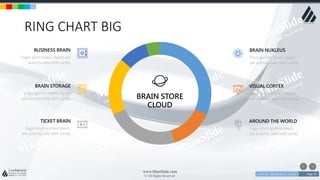


The document contains examples of various pie charts and circular charts displaying percentages and numerical data. There are 21 pages showing different pie chart and circular chart layouts that can be used in business presentations. The charts include editable templates for profit percentages over years, as well as charts imported from Excel displaying sales, revenue, and other financial metrics.


