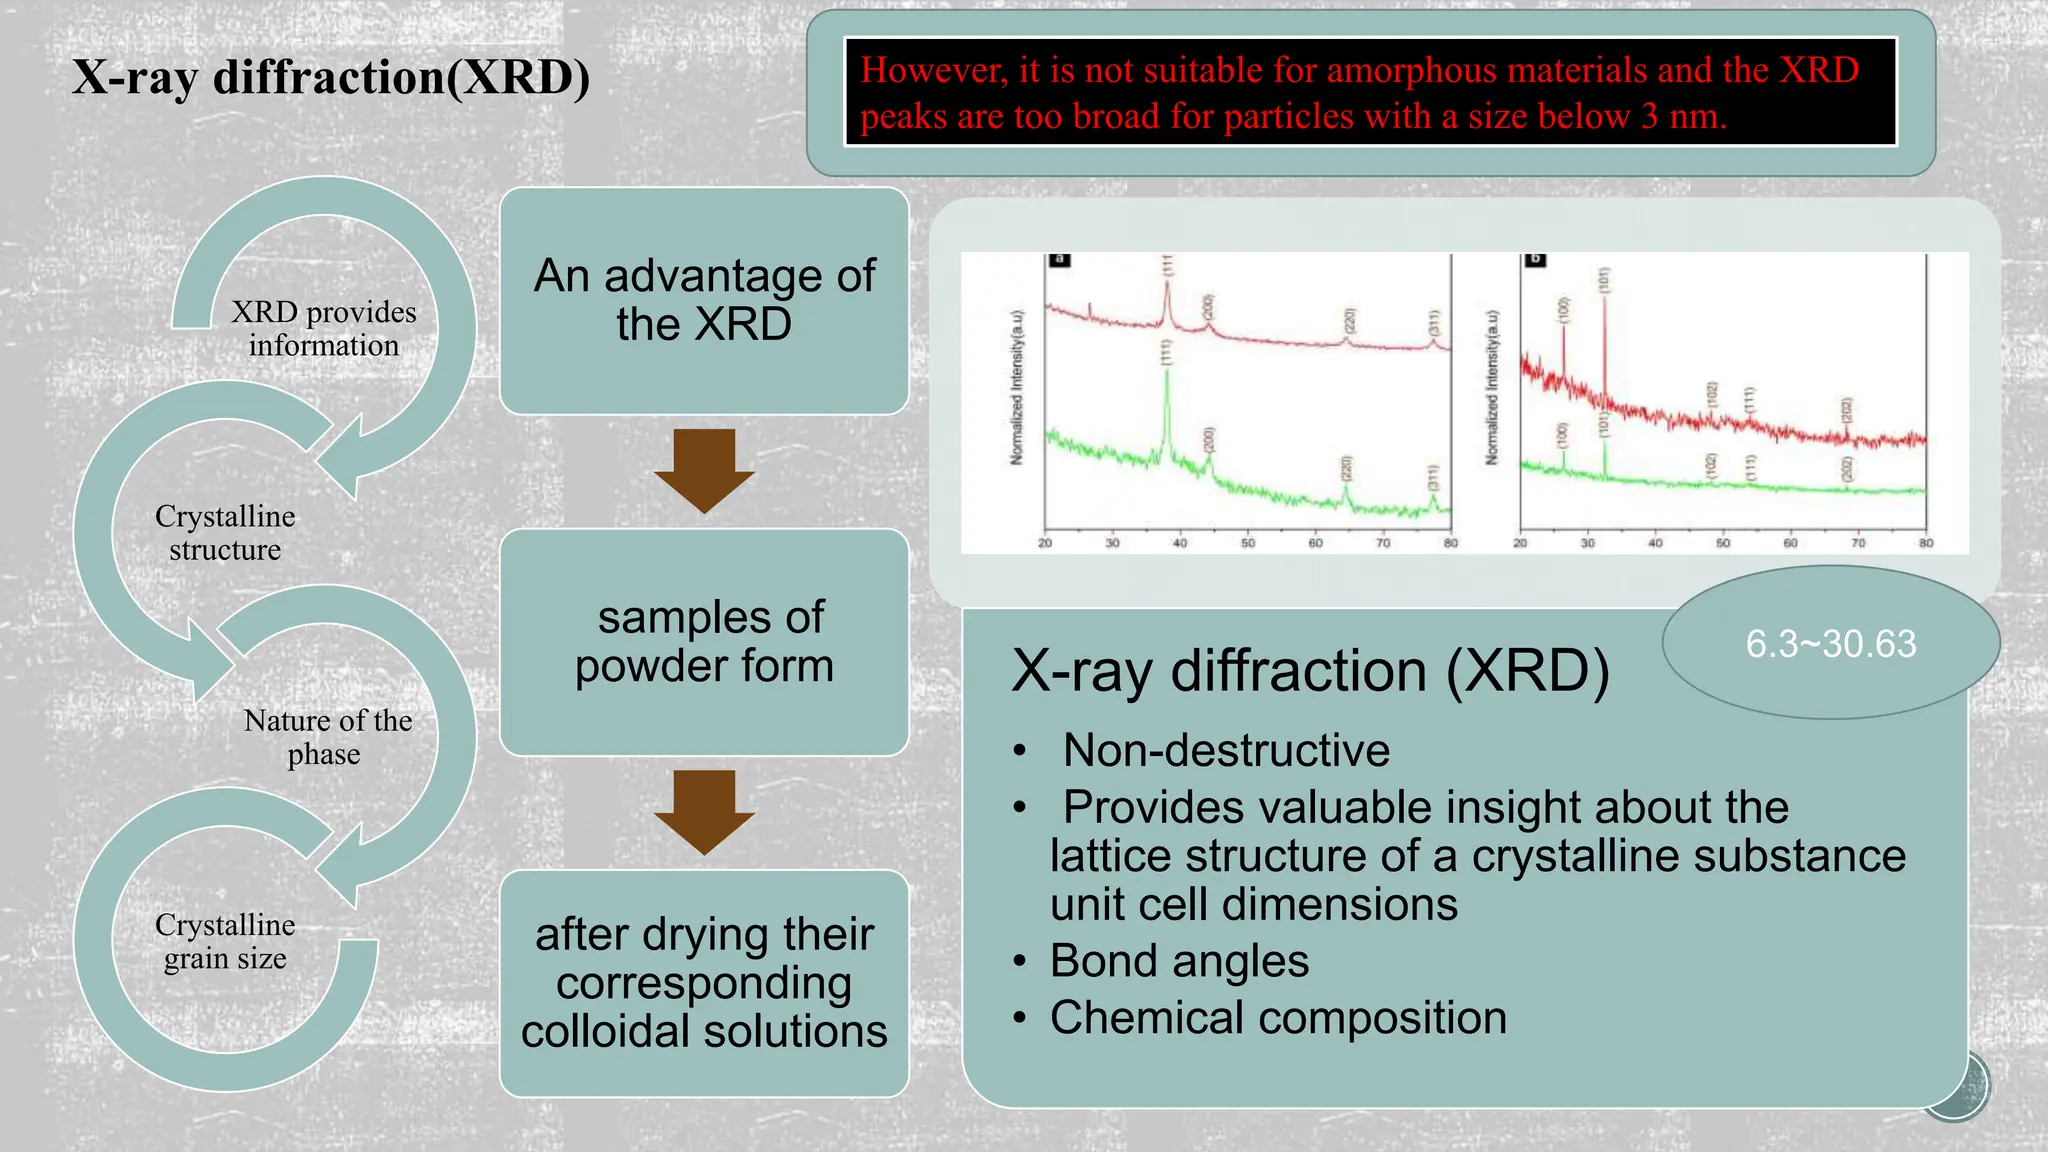
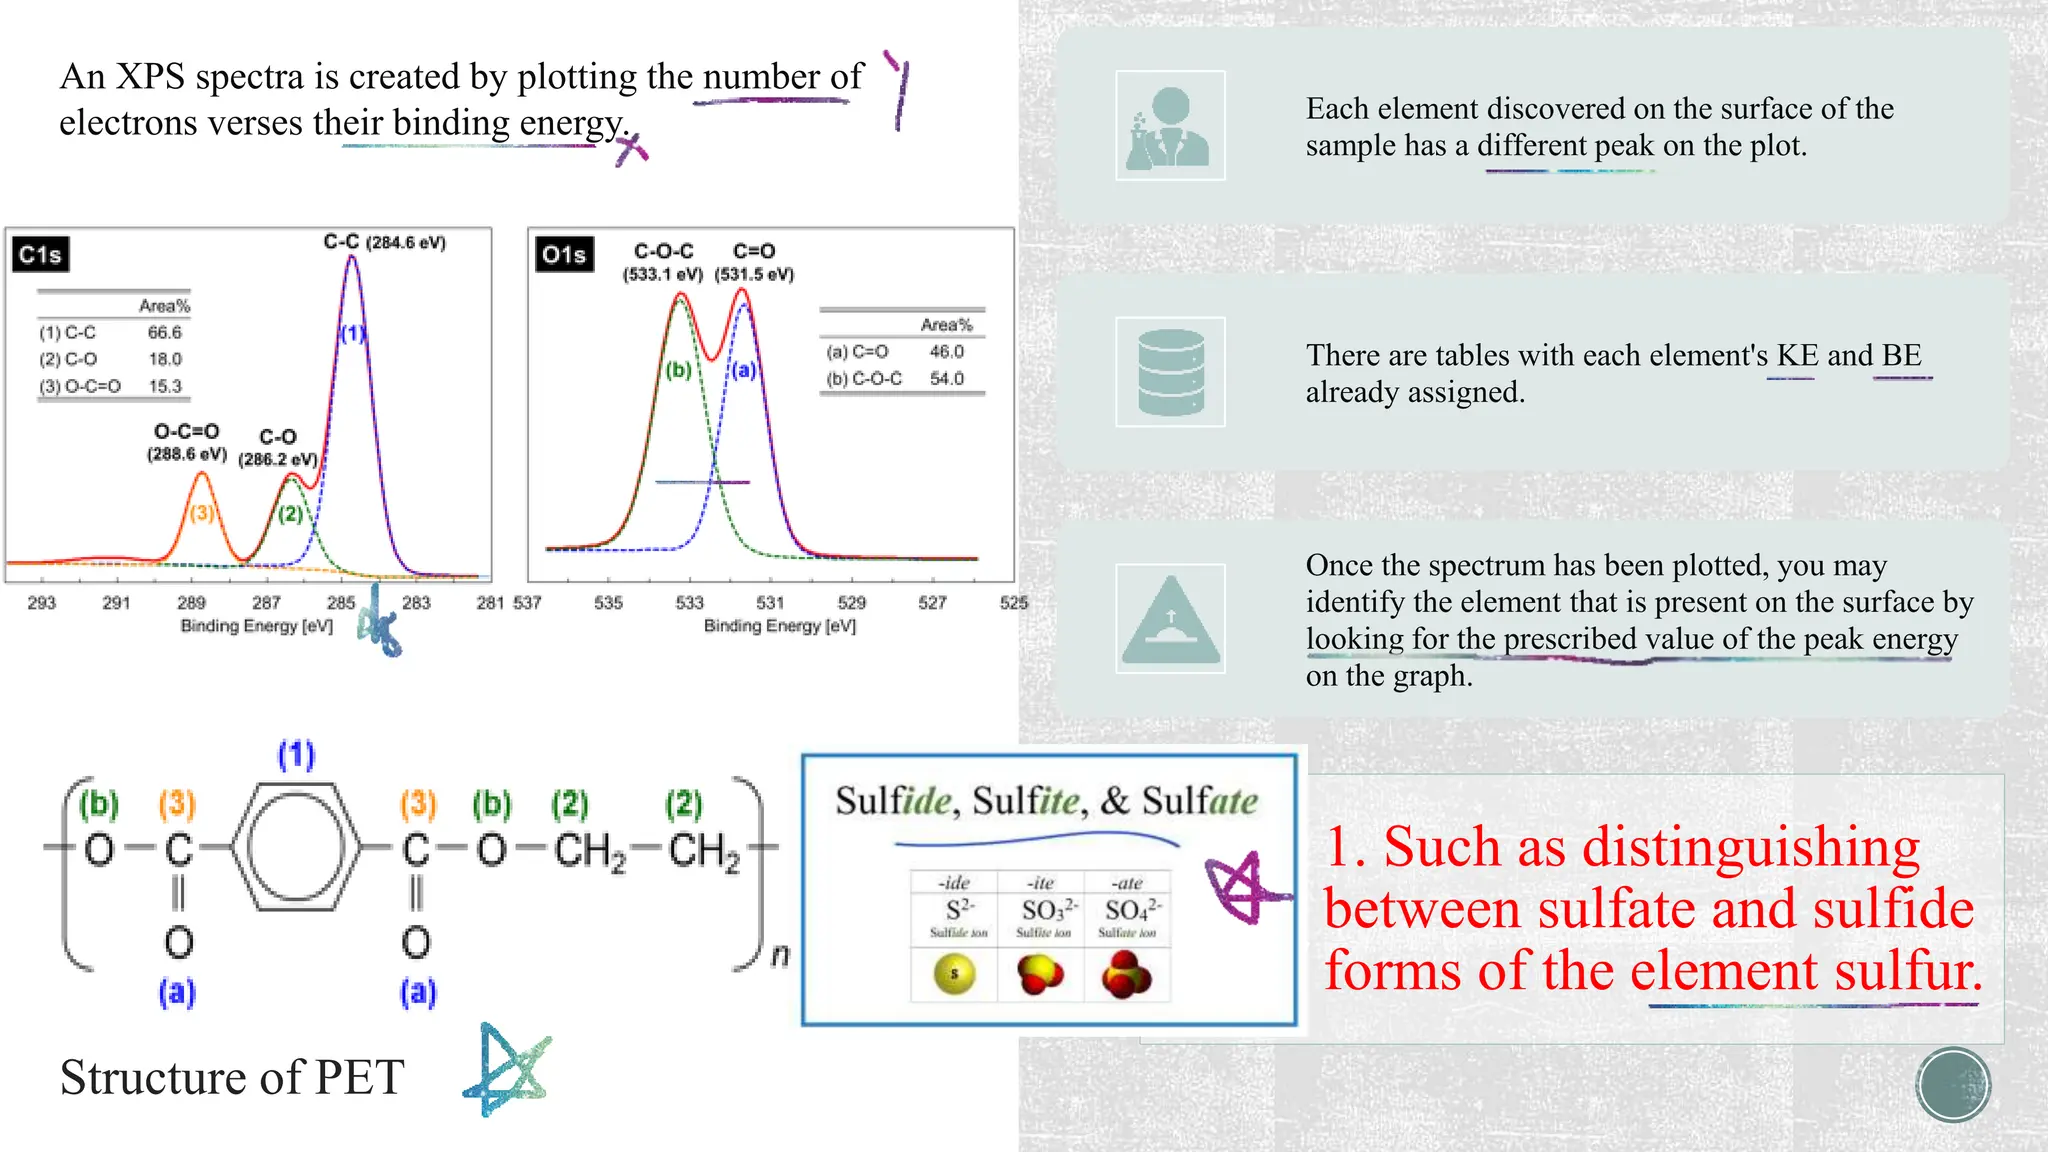
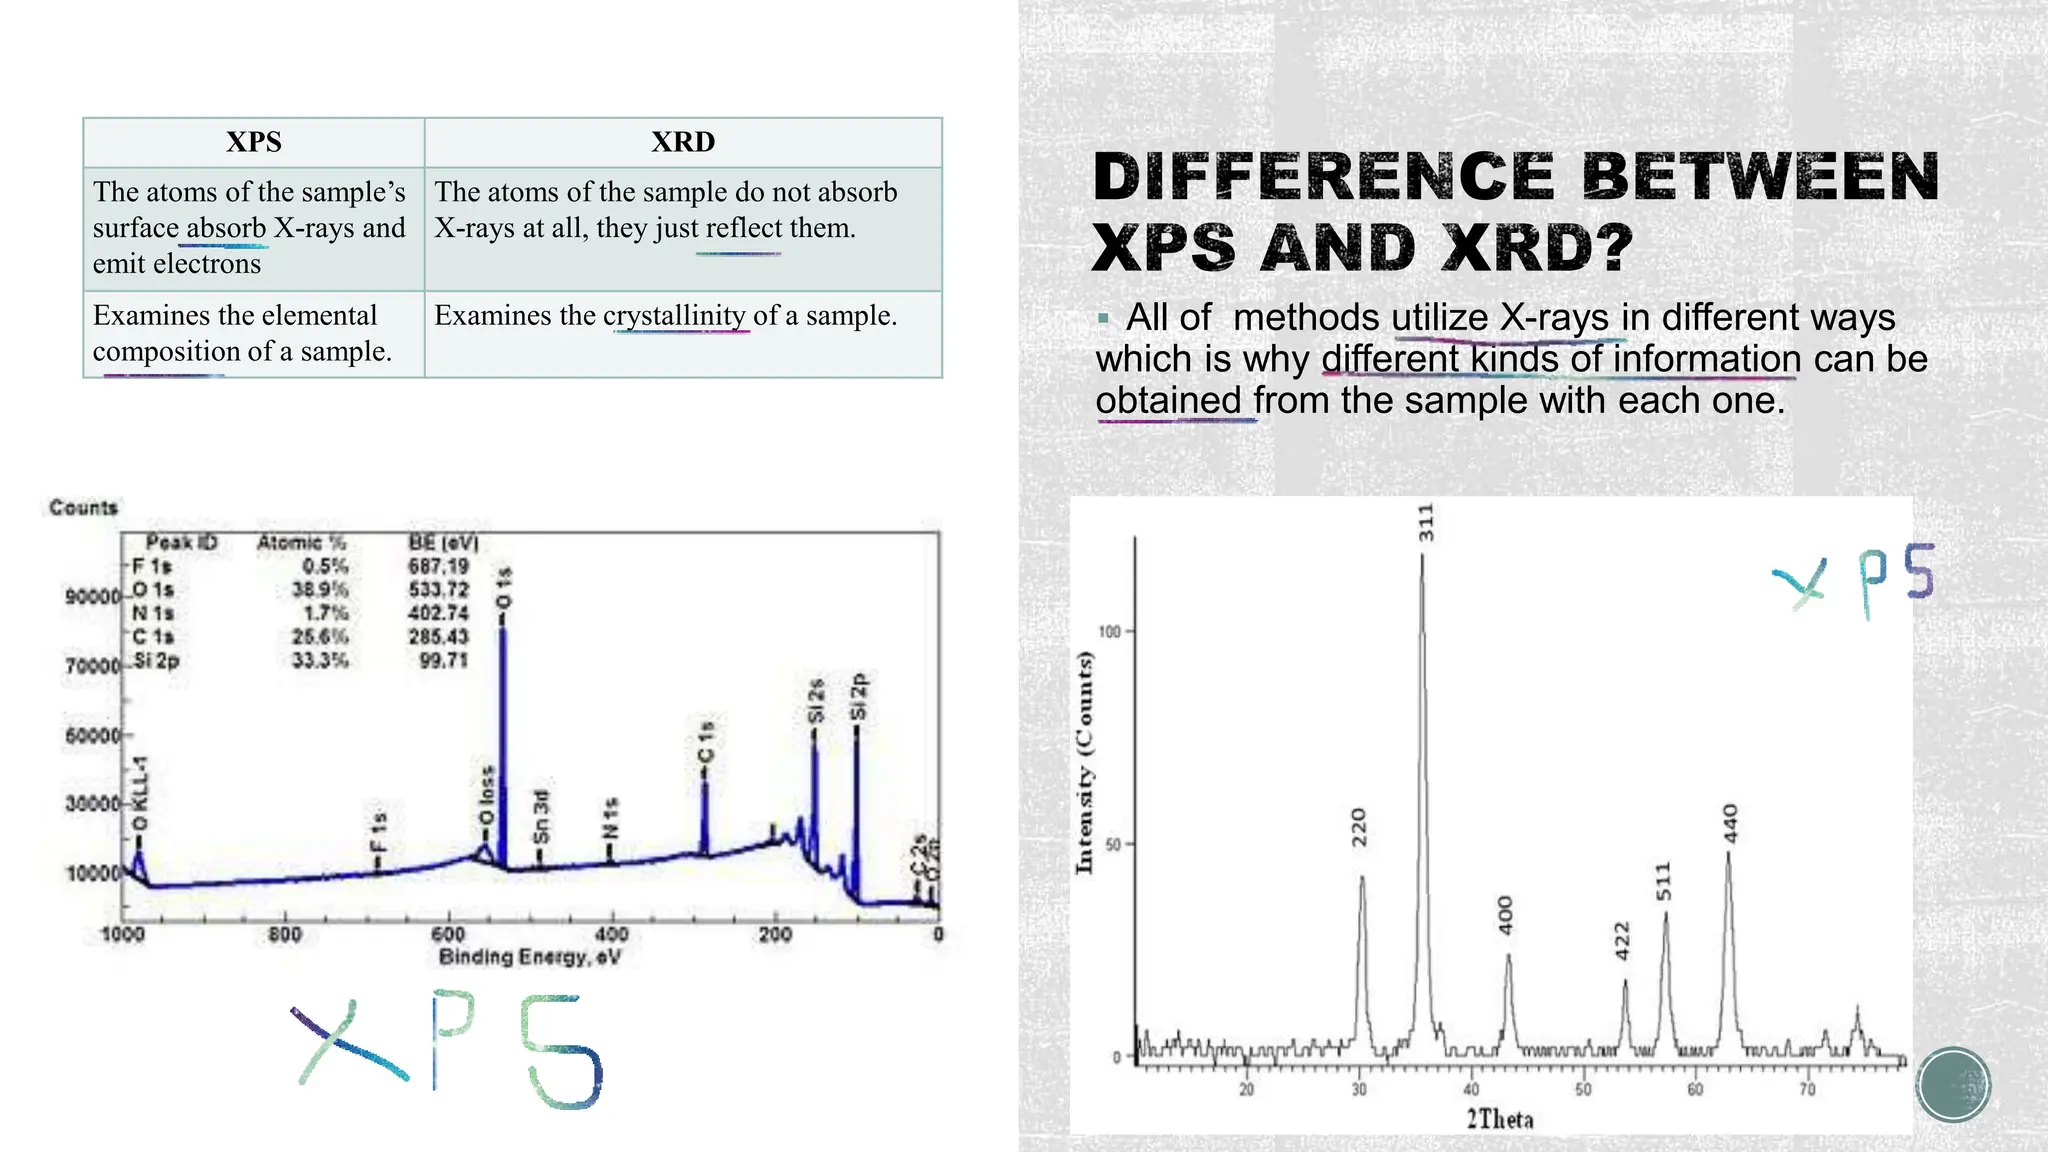
Importance of characterization of
nanomaterials
Characterization of nanomaterial with several
techniques
•Study the characterize the size, crystal structure,
elemental composition and a variety of other
physical properties of nanoparticles.
Classified
according to
Concept/group of the
technique used
The information they
can provide
Materials that they
are destined for.
1.General characterization
method
1.Microscopy
• Scanning Electronic Microscopy
(SEM)
1.Spectroscopy
• X-ray Diffraction (XRD)
• Energy Dispersive X-ray (EDX)
Exploring the potentials of halophilic
prokaryotes from a solar saltern for
synthesizing nanoparticles: The case
of silver and selenium
SEM
EDX
XRD
XRD provides
information
Crystalline
structure
Nature of the
phase
Crystalline
grain size
X-ray diffraction(XRD)
An advantage of
the XRD
samples of
powder form
after drying their
corresponding
colloidal solutions
However, it is not suitable for amorphous materials and the XRD
peaks are too broad for particles with a size below 3 nm.
X-ray diffraction (XRD)
• Non-destructive
• Provides valuable insight about the
lattice structure of a crystalline substance
unit cell dimensions
• Bond angles
• Chemical composition
6.3~30.63
Scanning electron microscopy (SEM)
 Generates photo-like images
 Very high-resolution images are possible
 SEM can yield valuable information regarding the purity as
well as degree of aggregation
• Singular
• Aggregated
Spherical
In Shape
Energy Dispersive X-ray (EDX or EDS)
Since each element has a unique atomic structure, it can distinguish X-rays that are
characteristic of that element.
used to identify the elemental composition of materials.
The Data Generated By EDX
Analysis Consist Of Spectra
Peaks Corresponding To The Elements
True Composition Of The Sample
Elemental Mapping Of A Sample And
Image Analysis Are Also Possible
Non-destructive
X-ray Photoelectron Spectroscopy (XPS)
X-ray Photoelectron Spectroscopy (XPS), also known as Electron
Spectroscopy for Chemical Analysis (ESCA), is used to determine
quantitative atomic composition and chemistry.
Explore surface
chemistry.
The surface sensitivity of
XPS means that it reveals
the surface chemistry at
atomic level.
Used to see how the
composition changes from
surface to bulk.
1.Details of elements
present.
2.Chemical states of those
elements.
• Photons of a specific energy are used to
excite the electronic states of atoms
below the surface of the sample.
• Electrons ejected from the surface are
energy filtered to intensity for a defined
energy is recorded by a detector.
• Since core level electrons in solid-state
atoms are quantized, the resulting energy
spectra exhibit peaks characteristic of the
electronic structure for atoms at the
sample surface.
• X-rays may penetrate deep into the
sample.
• Energies around 1400 eV, ejected
electrons from depths greater than 10nm.
XPS
instrument is
1. Such as distinguishing
between sulfate and sulfide
forms of the element sulfur.
An XPS spectra is created by plotting the number of
electrons verses their binding energy. Each element discovered on the surface of the
sample has a different peak on the plot.
There are tables with each element's KE and BE
already assigned.
Once the spectrum has been plotted, you may
identify the element that is present on the surface by
looking for the prescribed value of the peak energy
on the graph.
Structure of PET
 All of methods utilize X-rays in different ways
which is why different kinds of information can be
obtained from the sample with each one.
XPS XRD
The atoms of the sample’s
surface absorb X-rays and
emit electrons
The atoms of the sample do not absorb
X-rays at all, they just reflect them.
Examines the elemental
composition of a sample.
Examines the crystallinity of a sample.
1. Boddolla, S.: A review on Characterization techniques of Nanomaterials. (2018)
2. Mourdikoudis, S., Pallares, R.M., Thanh, N.T.K.: Characterization techniques for nanoparticles: comparison and
complementarity upon studying nanoparticle properties. Nanoscale. 10, 12871–12934 (2018).
https://doi.org/10.1039/C8NR02278J
3. Energy Dispersive X-Ray Analysis (EDX), https://www.intertek.com/analysis/microscopy/edx/
4. Abdollahnia, M., Makhdoumi, A., Mashreghi, M., Eshghi, H.: Exploring the potentials of halophilic prokaryotes
from a solar saltern for synthesizing nanoparticles: The case of silver and selenium. PLoS One. 15, (2020).
https://doi.org/10.1371/JOURNAL.PONE.0229886
5. López-Serrano, A., Olivas, R.M., Landaluze, J.S., Cámara, C.: Nanoparticles: a global vision. Characterization,
separation, and quantification methods. Potential environmental and health impact. Analytical Methods. 6, 38–56 (2013).
https://doi.org/10.1039/C3AY40517F
6. Morgan, D.J.: Comments on the XPS Analysis of Carbon Materials. C 2021, Vol. 7, Page 51. 7, 51 (2021).
https://doi.org/10.3390/C7030051
7. Surface Analysis | Surface Analysis Techniques | Thermo Fisher Scientific - SA,
https://www.thermofisher.com/sa/en/home/materials-science/xps-technology/multi-technique-workflow.html
8. X-ray Photoelectron Spectroscopy, https://serc.carleton.edu/msu_nanotech/methods/xps.html
9. X-Ray Photoelectron Spectroscopy (XPS). (2018)
10. Potter, Dominic. (2017). Re: What is difference between XRD and XPS methods?. Retrieved from:
https://www.researchgate.net/post/What-is-difference-between-XRD-and-XPS-
methods/59e0a0263d7f4b29614af362/citation/download.

characterization of nanomaterials by technology

  • 2.
    Importance of characterizationof nanomaterials Characterization of nanomaterial with several techniques •Study the characterize the size, crystal structure, elemental composition and a variety of other physical properties of nanoparticles. Classified according to Concept/group of the technique used The information they can provide Materials that they are destined for. 1.General characterization method 1.Microscopy • Scanning Electronic Microscopy (SEM) 1.Spectroscopy • X-ray Diffraction (XRD) • Energy Dispersive X-ray (EDX)
  • 3.
    Exploring the potentialsof halophilic prokaryotes from a solar saltern for synthesizing nanoparticles: The case of silver and selenium SEM EDX XRD
  • 4.
    XRD provides information Crystalline structure Nature ofthe phase Crystalline grain size X-ray diffraction(XRD) An advantage of the XRD samples of powder form after drying their corresponding colloidal solutions However, it is not suitable for amorphous materials and the XRD peaks are too broad for particles with a size below 3 nm. X-ray diffraction (XRD) • Non-destructive • Provides valuable insight about the lattice structure of a crystalline substance unit cell dimensions • Bond angles • Chemical composition 6.3~30.63
  • 5.
    Scanning electron microscopy(SEM)  Generates photo-like images  Very high-resolution images are possible  SEM can yield valuable information regarding the purity as well as degree of aggregation • Singular • Aggregated Spherical In Shape
  • 6.
    Energy Dispersive X-ray(EDX or EDS) Since each element has a unique atomic structure, it can distinguish X-rays that are characteristic of that element. used to identify the elemental composition of materials. The Data Generated By EDX Analysis Consist Of Spectra Peaks Corresponding To The Elements True Composition Of The Sample Elemental Mapping Of A Sample And Image Analysis Are Also Possible Non-destructive
  • 7.
    X-ray Photoelectron Spectroscopy(XPS) X-ray Photoelectron Spectroscopy (XPS), also known as Electron Spectroscopy for Chemical Analysis (ESCA), is used to determine quantitative atomic composition and chemistry. Explore surface chemistry. The surface sensitivity of XPS means that it reveals the surface chemistry at atomic level. Used to see how the composition changes from surface to bulk. 1.Details of elements present. 2.Chemical states of those elements.
  • 8.
    • Photons ofa specific energy are used to excite the electronic states of atoms below the surface of the sample. • Electrons ejected from the surface are energy filtered to intensity for a defined energy is recorded by a detector. • Since core level electrons in solid-state atoms are quantized, the resulting energy spectra exhibit peaks characteristic of the electronic structure for atoms at the sample surface. • X-rays may penetrate deep into the sample. • Energies around 1400 eV, ejected electrons from depths greater than 10nm. XPS instrument is
  • 9.
    1. Such asdistinguishing between sulfate and sulfide forms of the element sulfur. An XPS spectra is created by plotting the number of electrons verses their binding energy. Each element discovered on the surface of the sample has a different peak on the plot. There are tables with each element's KE and BE already assigned. Once the spectrum has been plotted, you may identify the element that is present on the surface by looking for the prescribed value of the peak energy on the graph. Structure of PET
  • 10.
     All ofmethods utilize X-rays in different ways which is why different kinds of information can be obtained from the sample with each one. XPS XRD The atoms of the sample’s surface absorb X-rays and emit electrons The atoms of the sample do not absorb X-rays at all, they just reflect them. Examines the elemental composition of a sample. Examines the crystallinity of a sample.
  • 12.
    1. Boddolla, S.:A review on Characterization techniques of Nanomaterials. (2018) 2. Mourdikoudis, S., Pallares, R.M., Thanh, N.T.K.: Characterization techniques for nanoparticles: comparison and complementarity upon studying nanoparticle properties. Nanoscale. 10, 12871–12934 (2018). https://doi.org/10.1039/C8NR02278J 3. Energy Dispersive X-Ray Analysis (EDX), https://www.intertek.com/analysis/microscopy/edx/ 4. Abdollahnia, M., Makhdoumi, A., Mashreghi, M., Eshghi, H.: Exploring the potentials of halophilic prokaryotes from a solar saltern for synthesizing nanoparticles: The case of silver and selenium. PLoS One. 15, (2020). https://doi.org/10.1371/JOURNAL.PONE.0229886 5. López-Serrano, A., Olivas, R.M., Landaluze, J.S., Cámara, C.: Nanoparticles: a global vision. Characterization, separation, and quantification methods. Potential environmental and health impact. Analytical Methods. 6, 38–56 (2013). https://doi.org/10.1039/C3AY40517F 6. Morgan, D.J.: Comments on the XPS Analysis of Carbon Materials. C 2021, Vol. 7, Page 51. 7, 51 (2021). https://doi.org/10.3390/C7030051 7. Surface Analysis | Surface Analysis Techniques | Thermo Fisher Scientific - SA, https://www.thermofisher.com/sa/en/home/materials-science/xps-technology/multi-technique-workflow.html 8. X-ray Photoelectron Spectroscopy, https://serc.carleton.edu/msu_nanotech/methods/xps.html 9. X-Ray Photoelectron Spectroscopy (XPS). (2018) 10. Potter, Dominic. (2017). Re: What is difference between XRD and XPS methods?. Retrieved from: https://www.researchgate.net/post/What-is-difference-between-XRD-and-XPS- methods/59e0a0263d7f4b29614af362/citation/download.

Editor's Notes

  • #3 Different strengths and limitations of each technique complicate the choice of the most suitable method, while often a combinatorial characterization approach isneeded
  • #6 This method involves striking a specimen with an electron beam & interacting with its atoms. Secondary electrons, back scattered electrons and characteristic X-ray signals are then generated that provide information on the surface topography and composition of the samples.
  • #8 XPS analysis can be extended into a material through a process known as depth profiling, which slowly removes material using an ion beam, collecting data after each etching cycle. Depth profiling enables a composition profile with high depth resolution to be measured. Depth profiles can be used to see how the composition changes from surface to bulk; for example, due to corrosion, oxidation of the surface, or to understand the chemistry at interfaces where different materials are joined together. XPS is used to measure: elemental composition of the surface (top 1–10 nm usually) empirical formula of pure materials elements that contaminate a surface chemical or electronic state of each element in the surface uniformity of elemental composition across the top surface (or line profiling or mapping) uniformity of elemental composition as a function of ion beam etching (or depth profiling) XPS can determine Elemental composition, Stoichiometry, electrical/chemical states Examine surface contamination. XPS is an elemental analysis technique that is unique in Providing chemical state information of the detected elements, The method is used for determining the elemental composition of the surface, the chemical states of the elements as well as the electronic structure of the compounds Depth profiling, removes material using an ion beam, collecting data after each etching cycle. Enables a composition profile with high depth resolution to be measured.
  • #9 apply quantum theory to, especially form into quanta, in particular restrict the number of possible values of (a quantity) or states of (a system) so that certain variables can assume only certain discrete magnitudes background signal Contribute to the background signal rather than well-defined primary photoelectric peaks.
  • #10  An x-ray beam usually comprised of k-alpha x-rays is focused on the sample. The absorption of incident x-rays results in the ejection of electrons. The energy of the ejected electrons is measured by the detector.
  • #11 X-ray photoelectron spectroscopy (XPS) can analyze a chemical state of element present on a sample surface by utilizing a change in binding energy (a shift of peak in a spectrum) with a change in chemical binding with surrounding elements. Shown below is an example of chemical binding analysis of polyethylene terephthalate (PET). PET has a structure in which carbon and oxygen atoms have multiple bindings individually as shown in Figure 1. Amount of peak shift is different at each binding and, therefore, C1s and O1s spectra are obtained by combination of multiple peaks (see a red line in Figure 2). Looking at each peak dividing a spectrum, a location of peak indicates a biding state and an area of peak indicates a ratio of binding.
  • #12 XRD examines the crystallinity of a sample. It tells you the crystal structure(s) of your sample, as well as the space group, lattice parameters, preferred orientation and crystallite size. XPS examines the elemental composition of a sample. It tells you which elements are present in your sample, in which concentrations, and in which oxidation states.