Downloaded 488 times
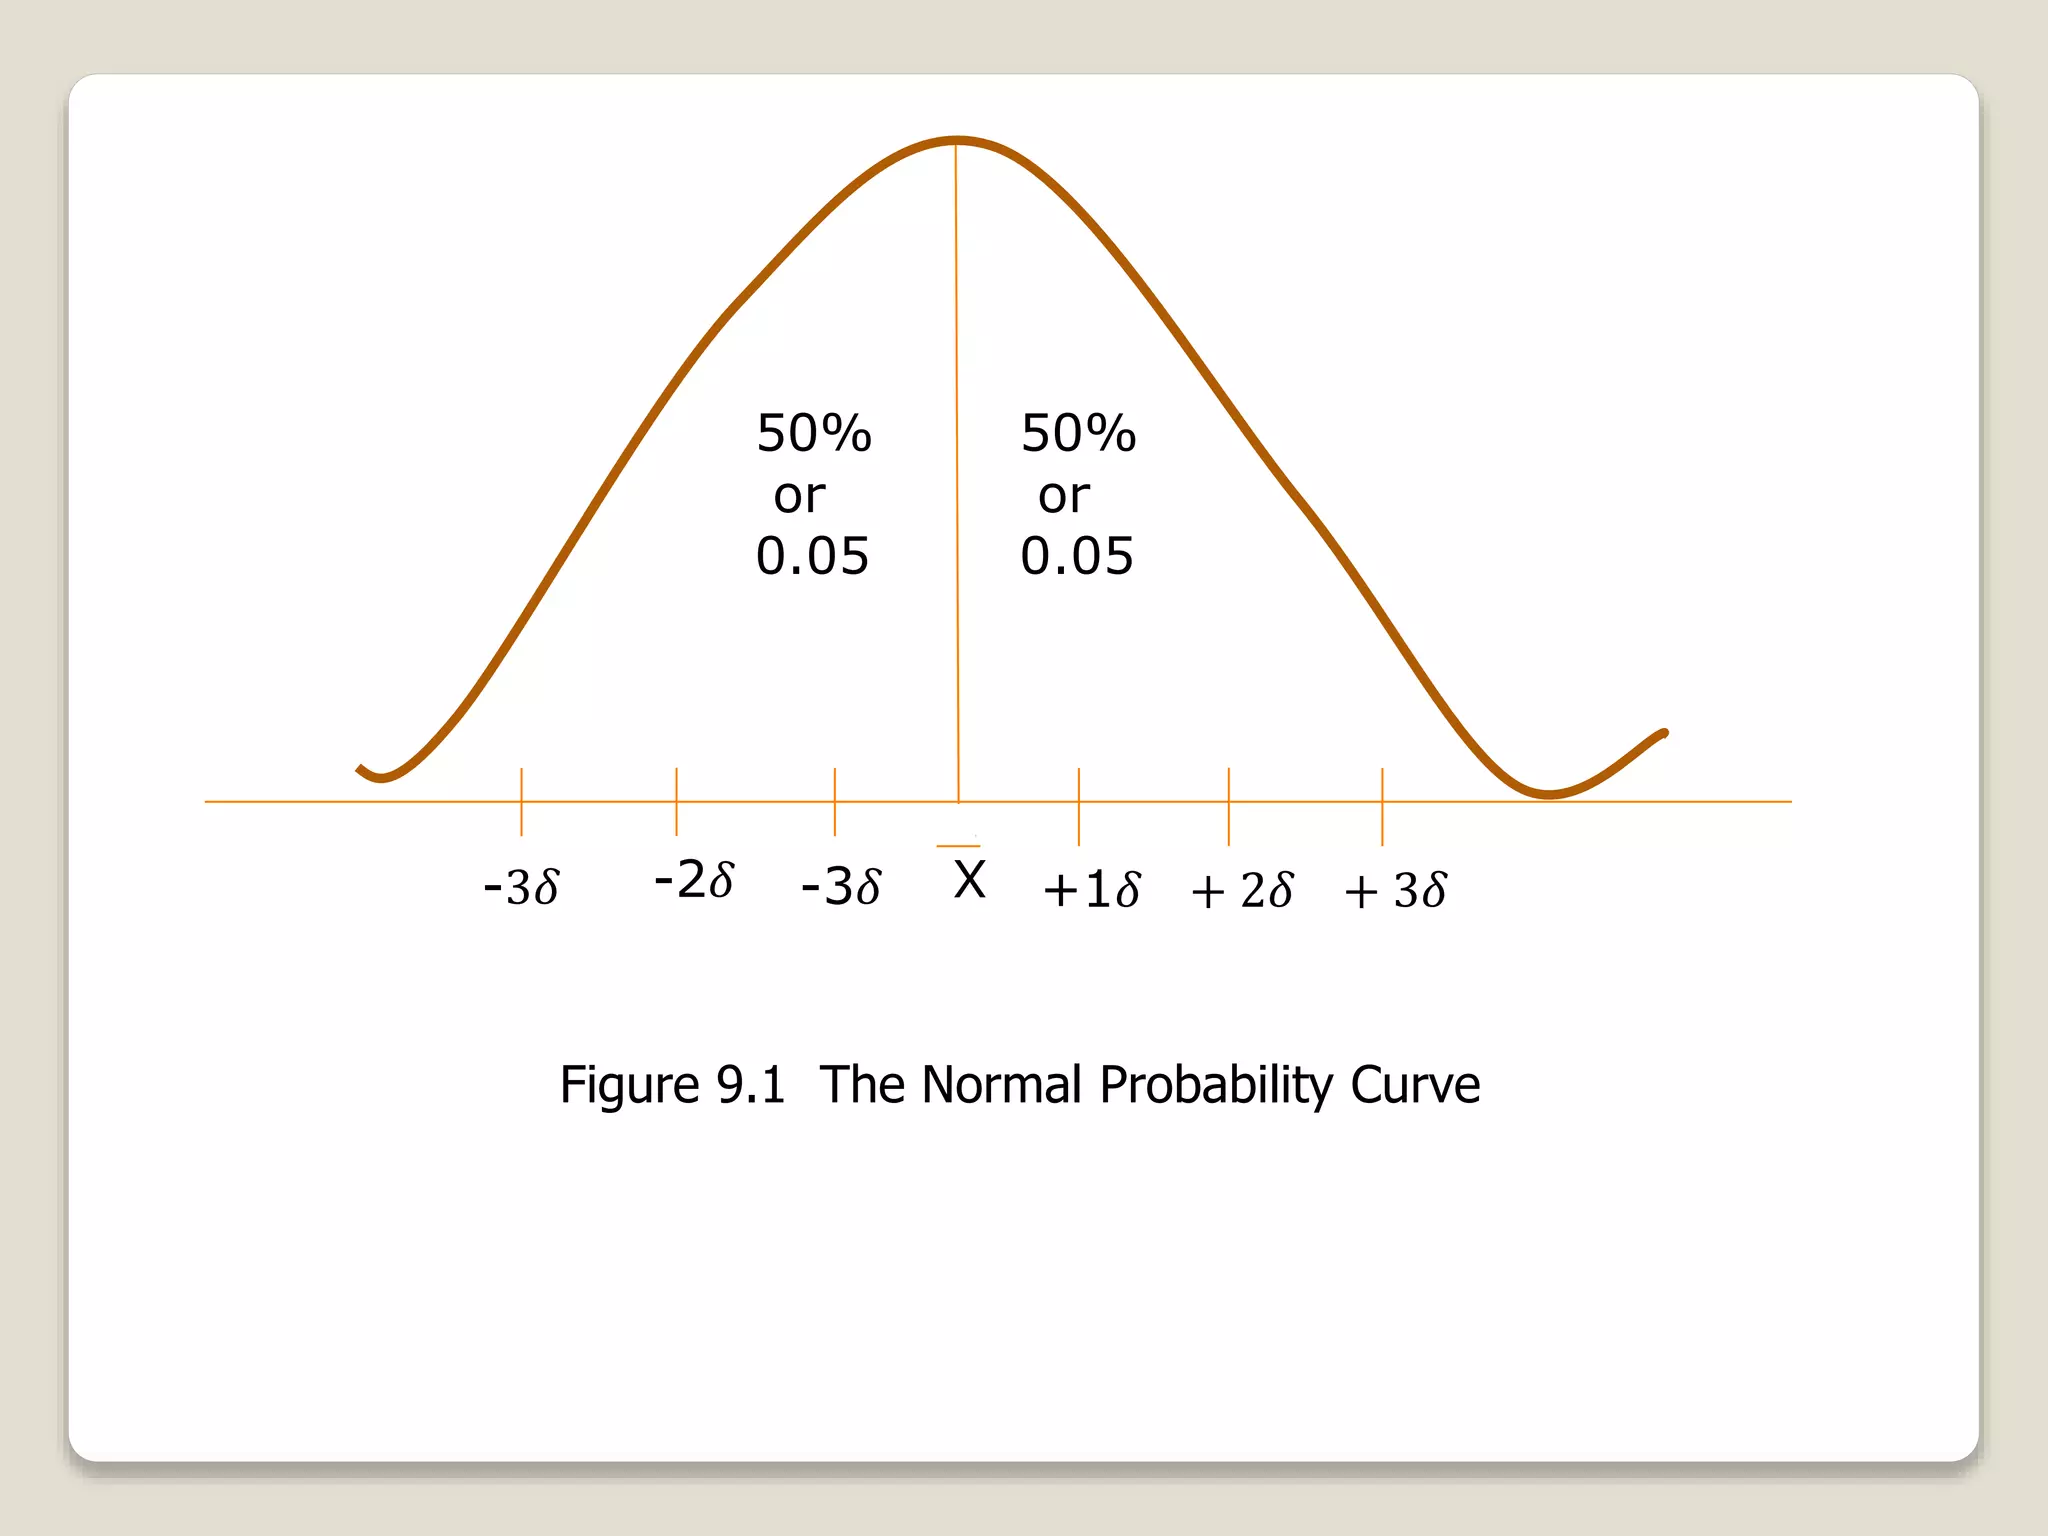
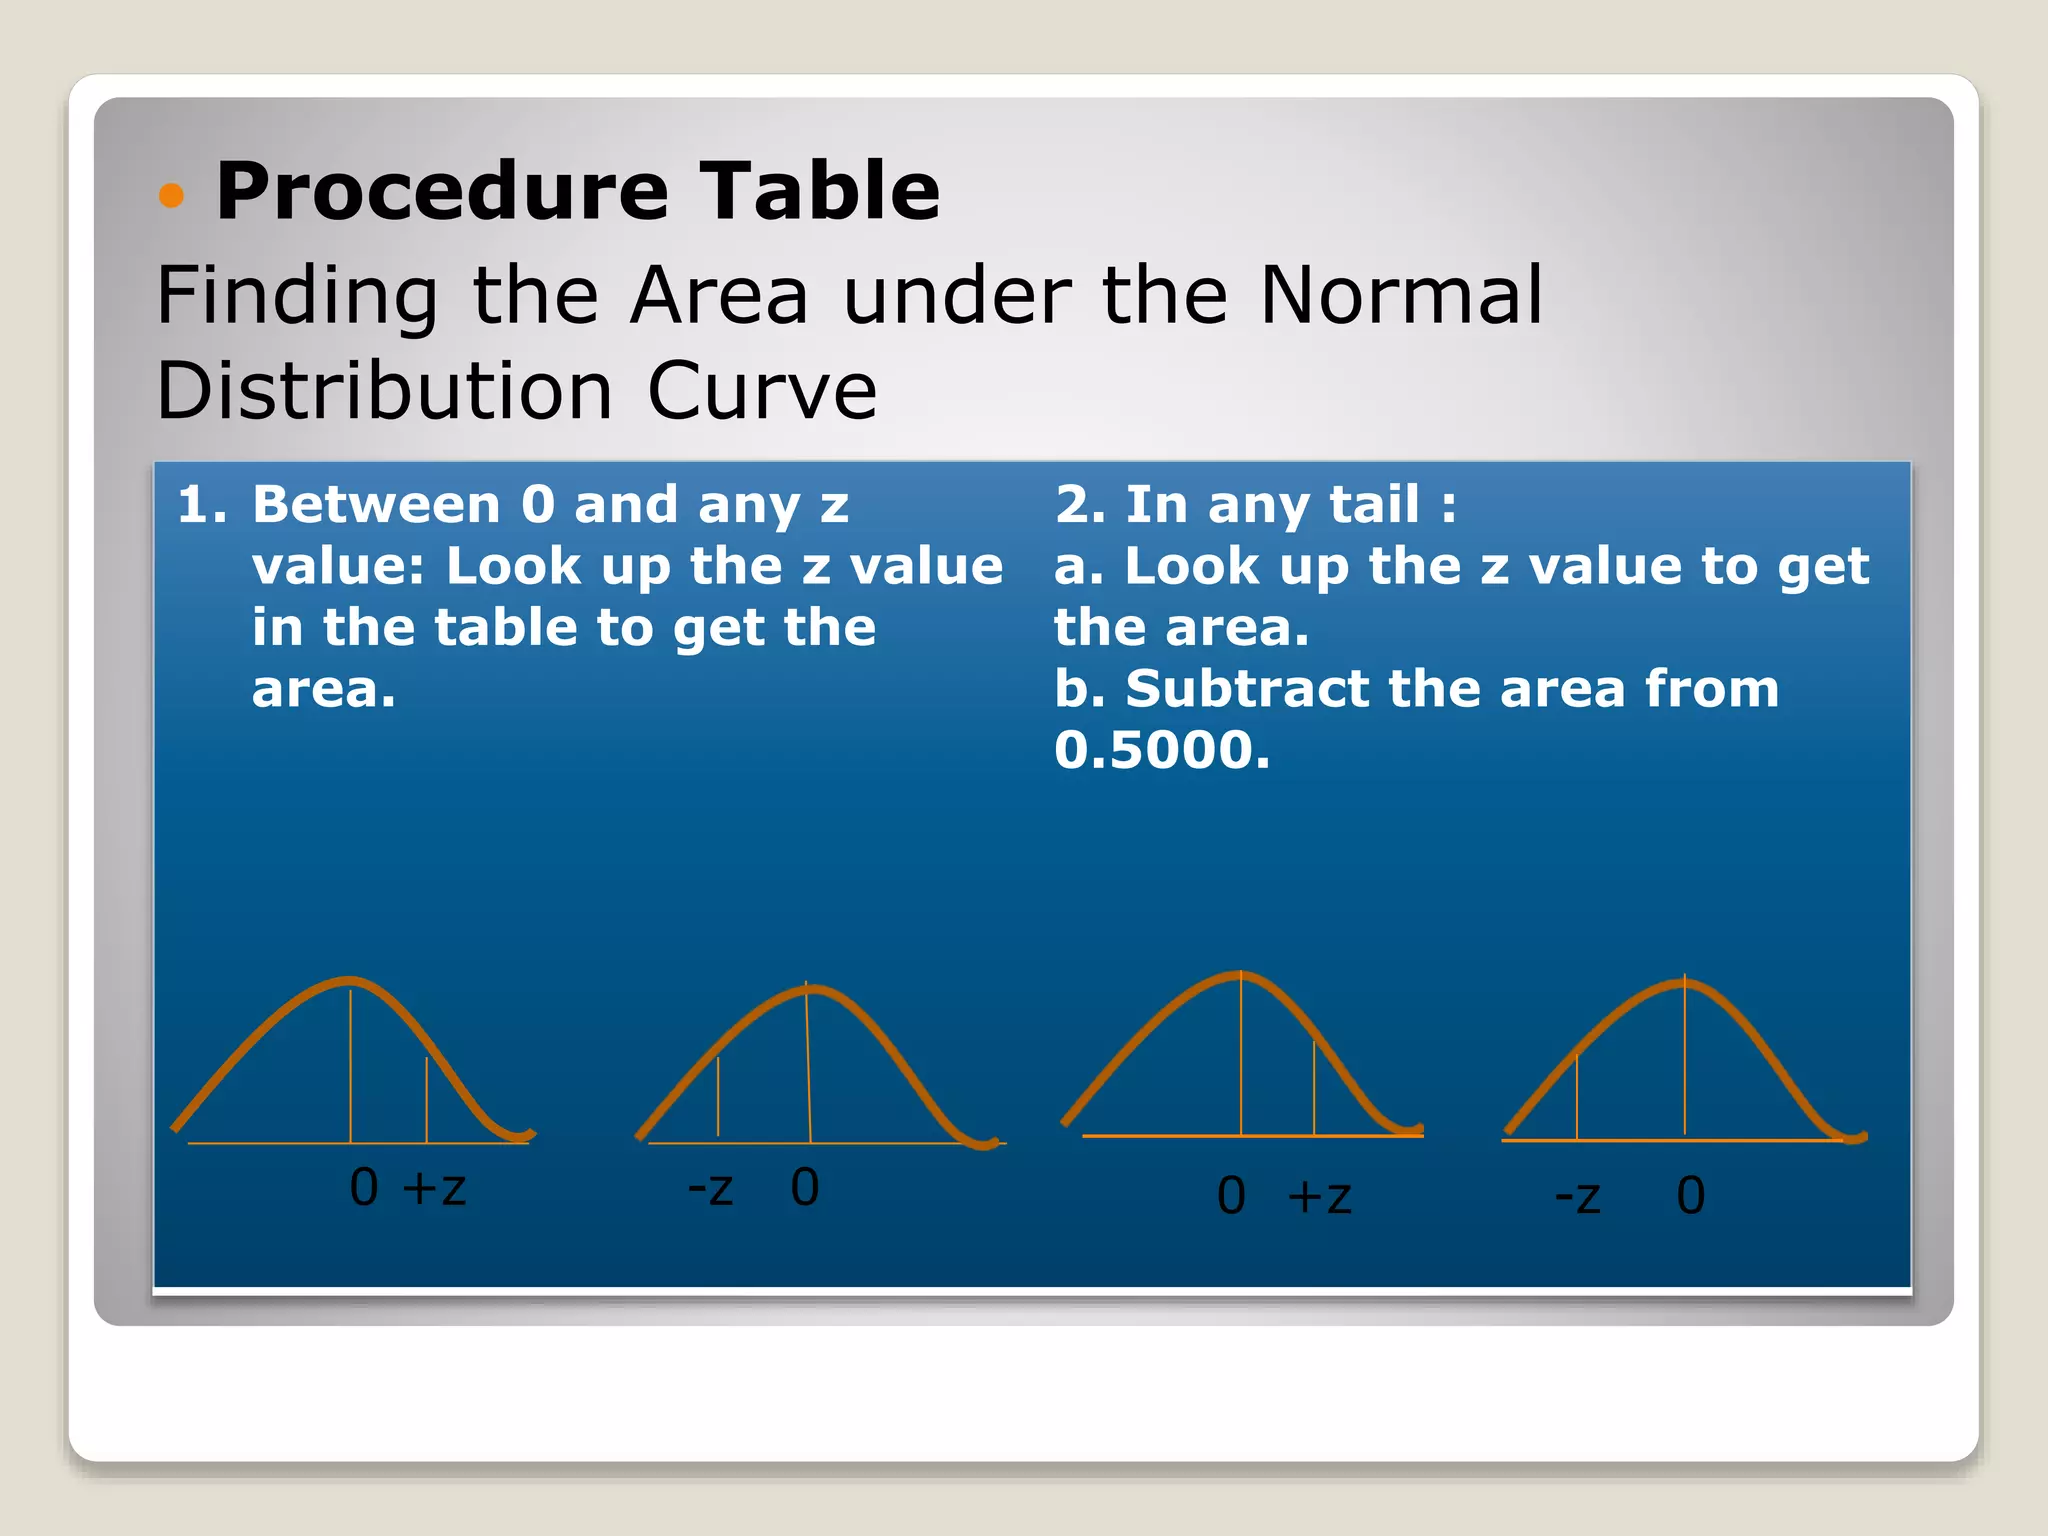
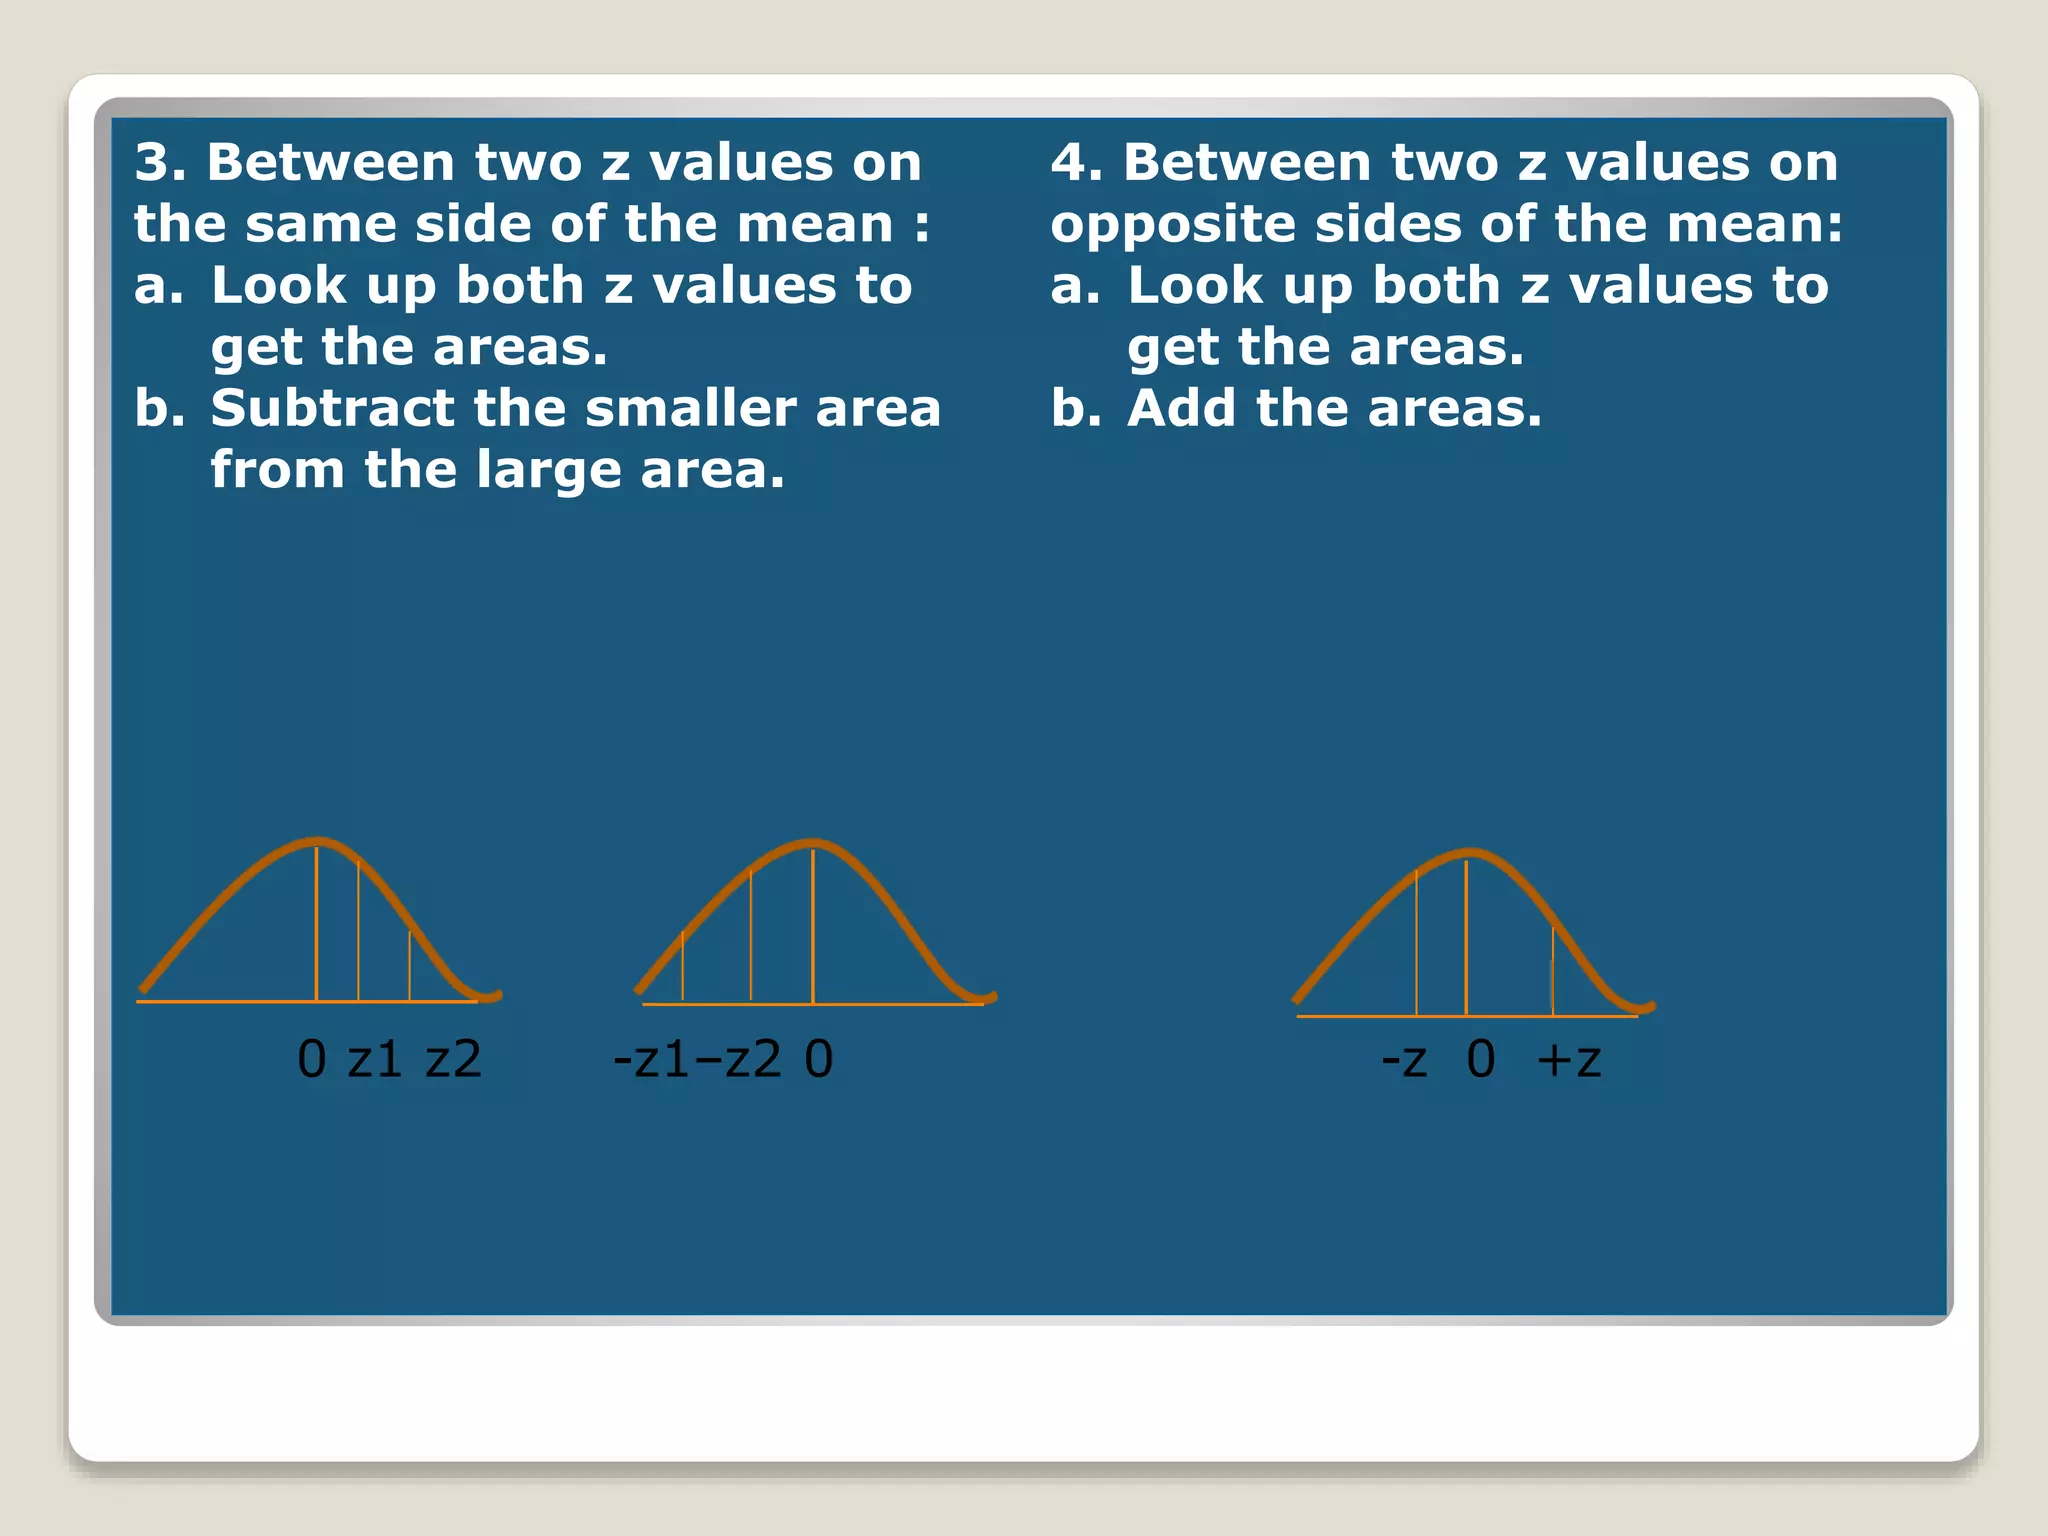
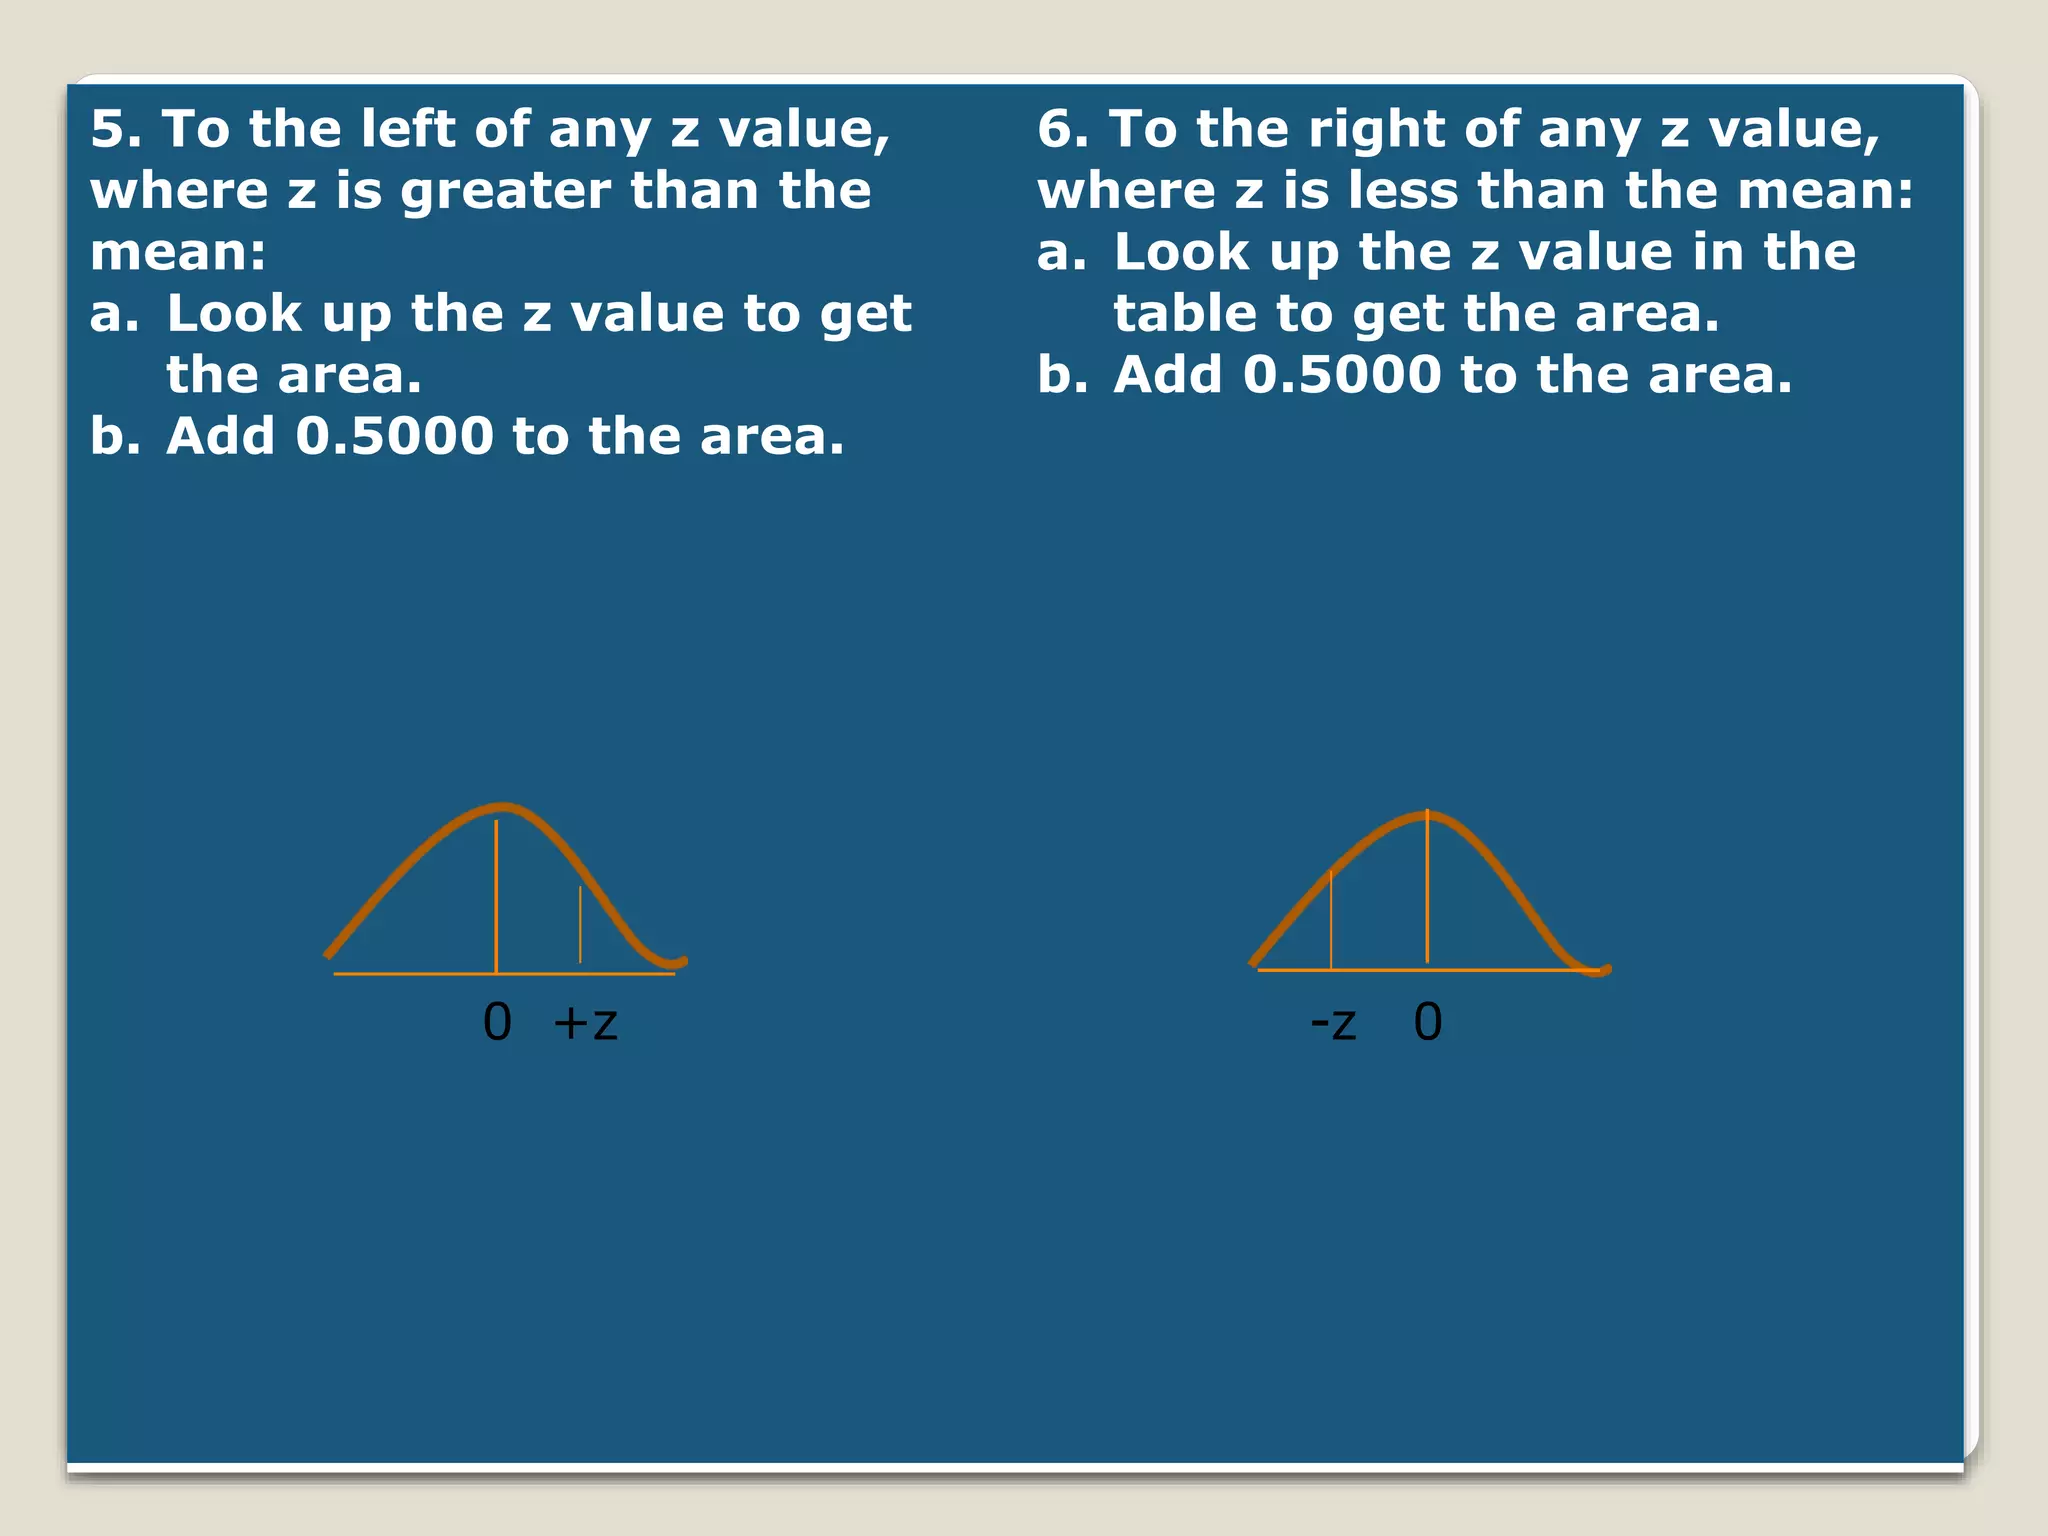
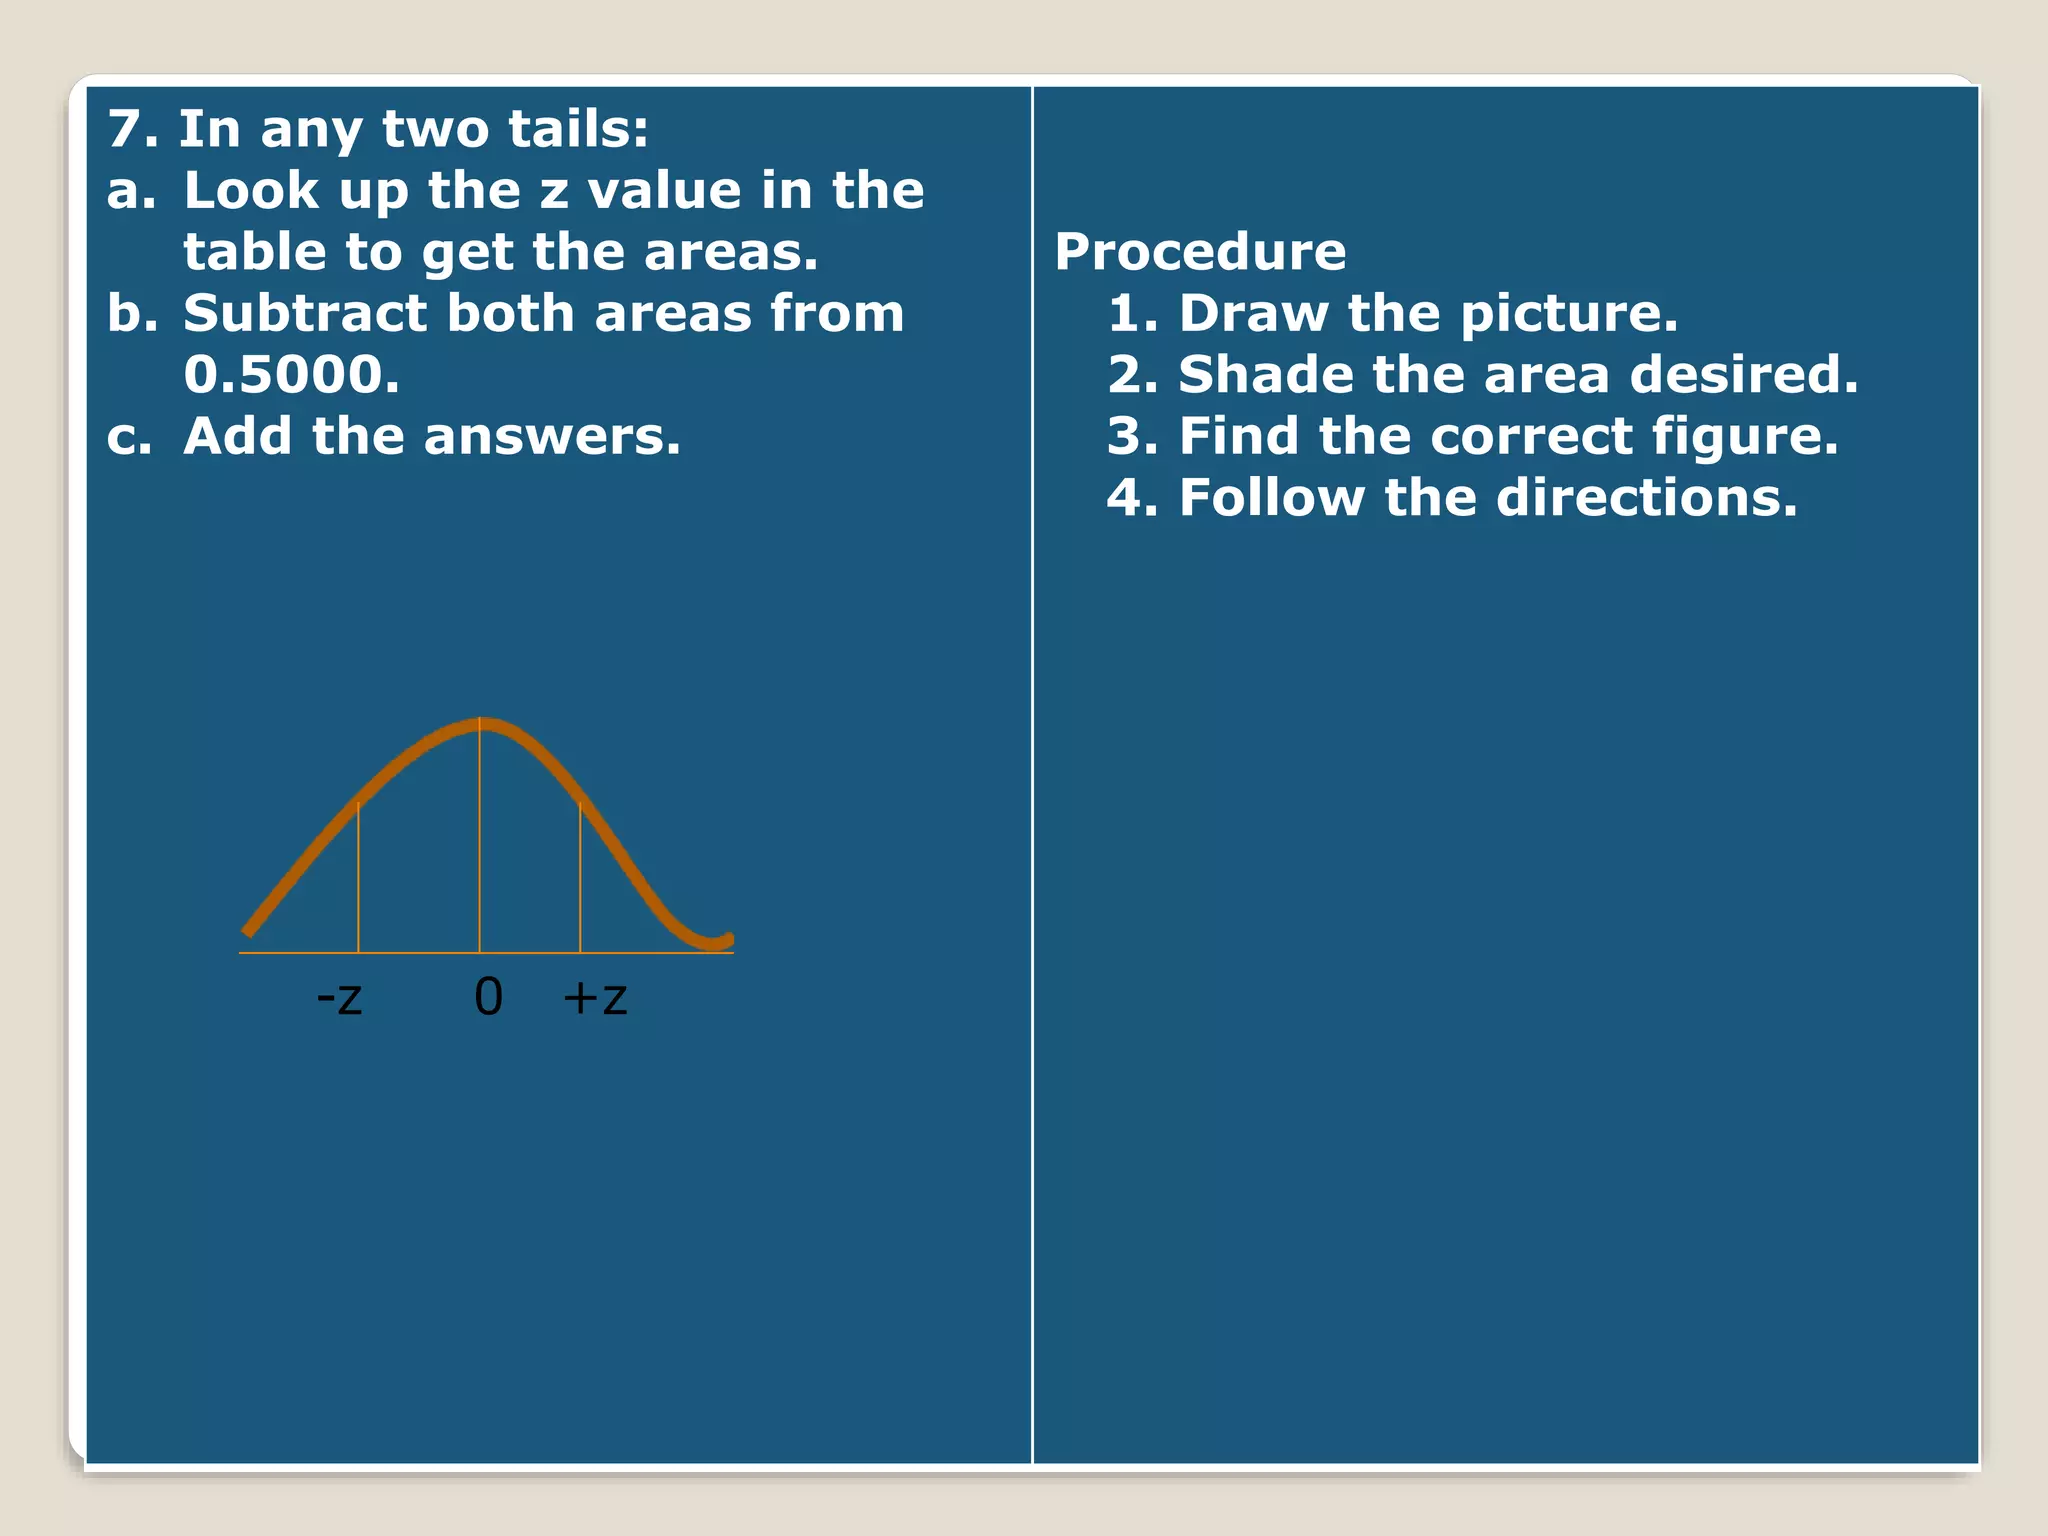
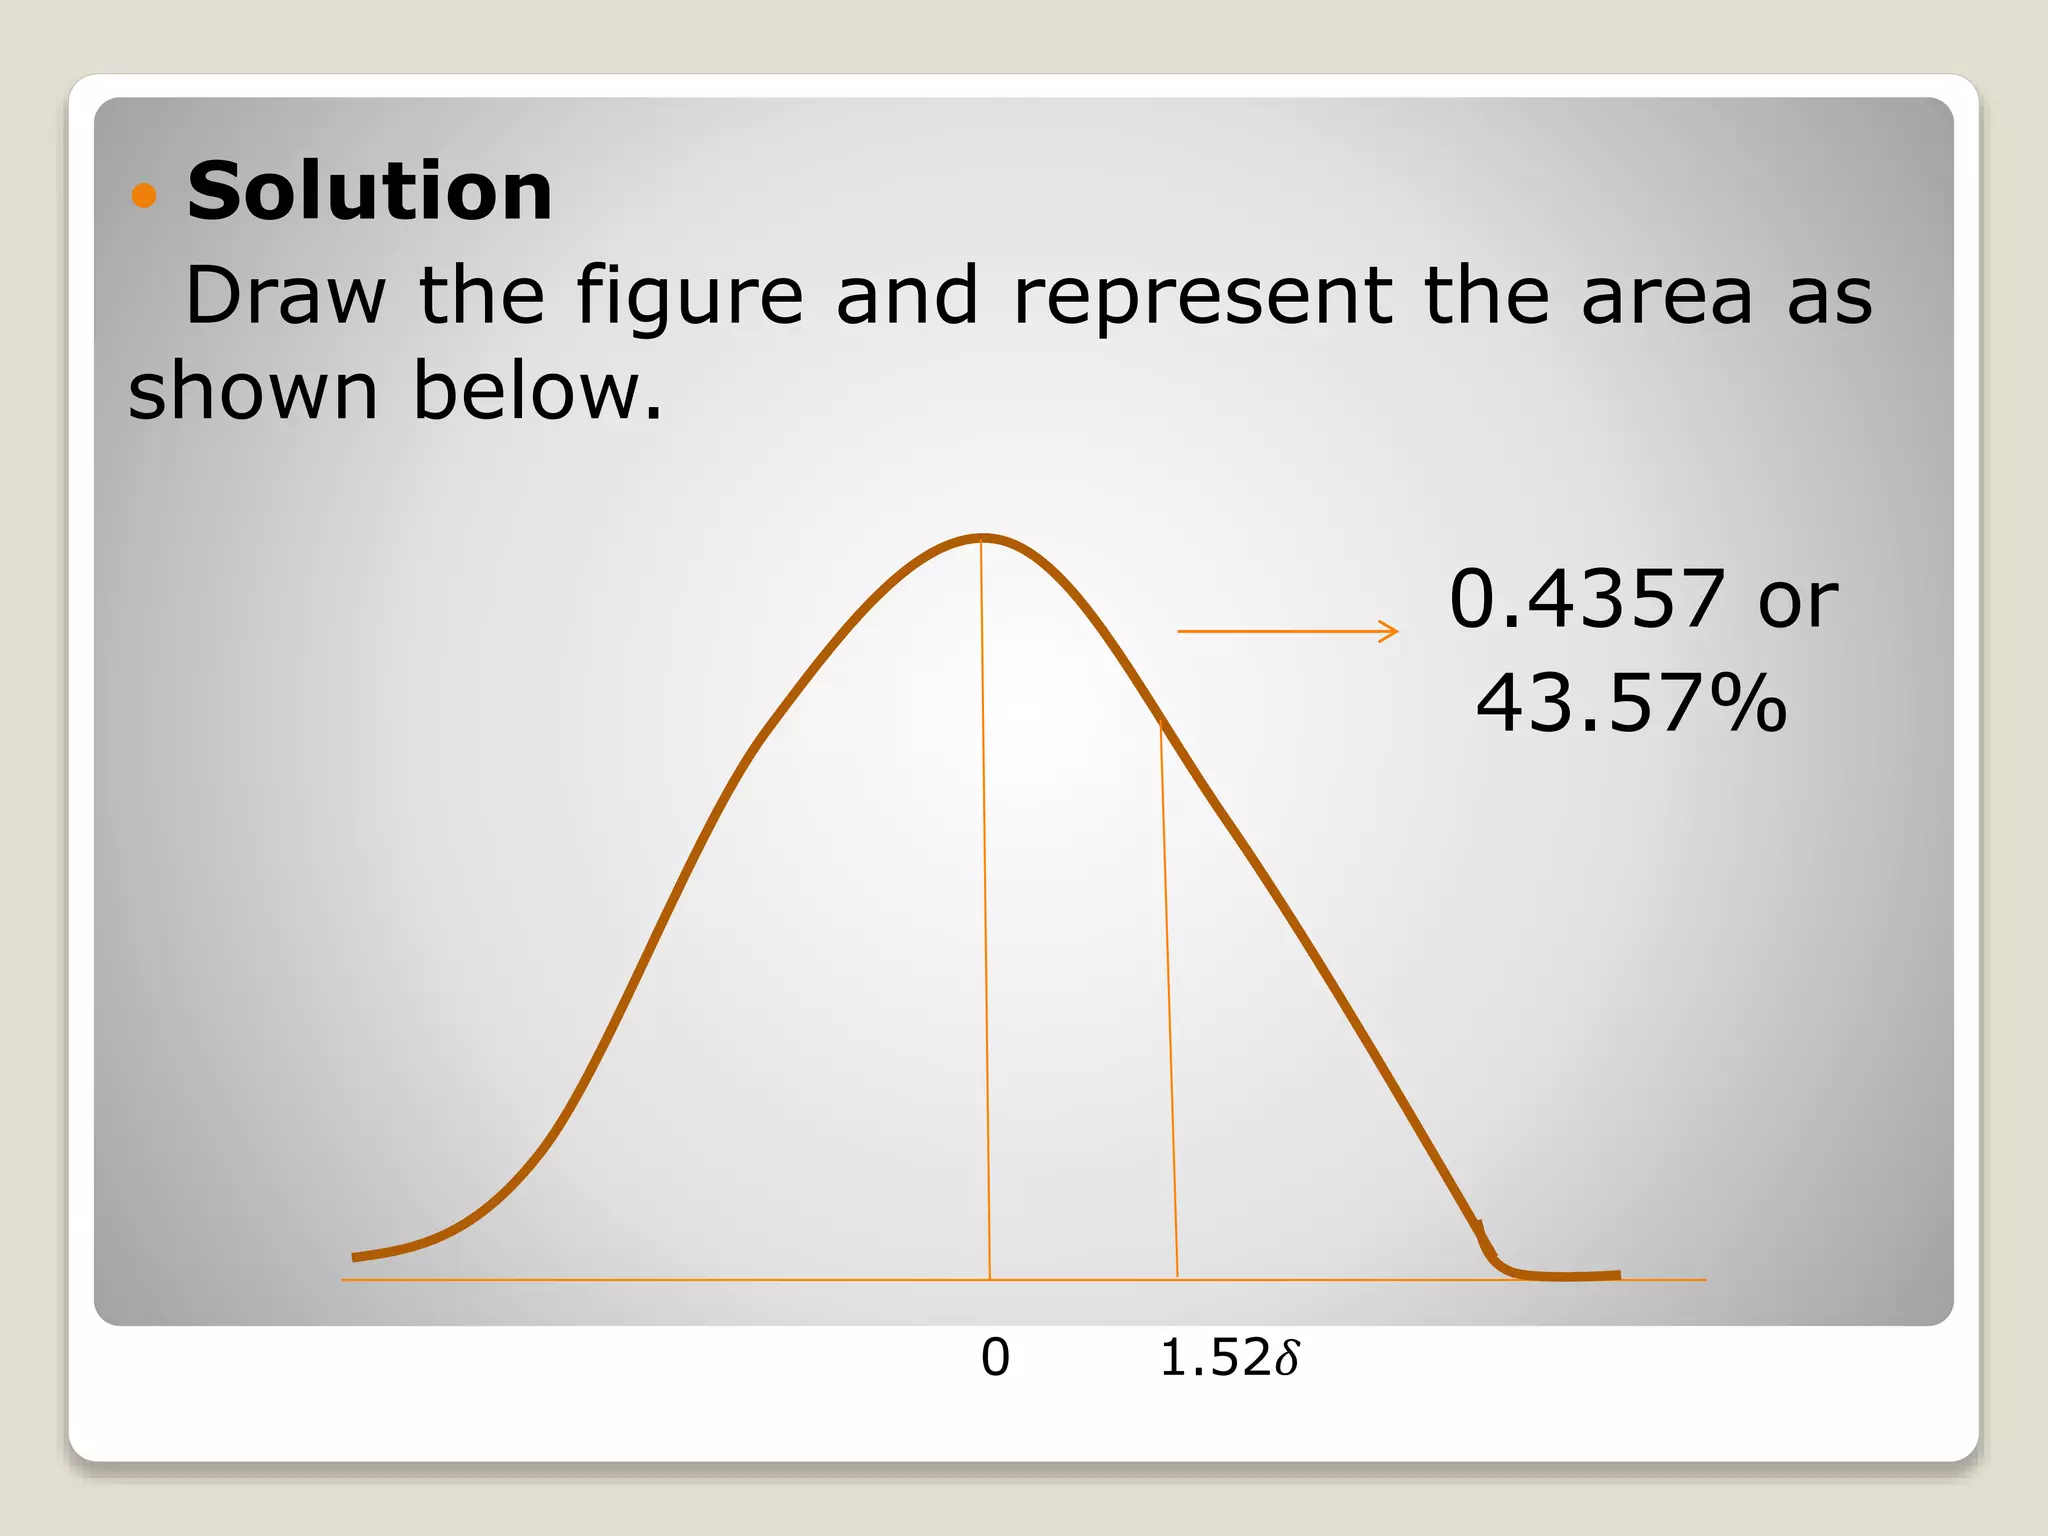
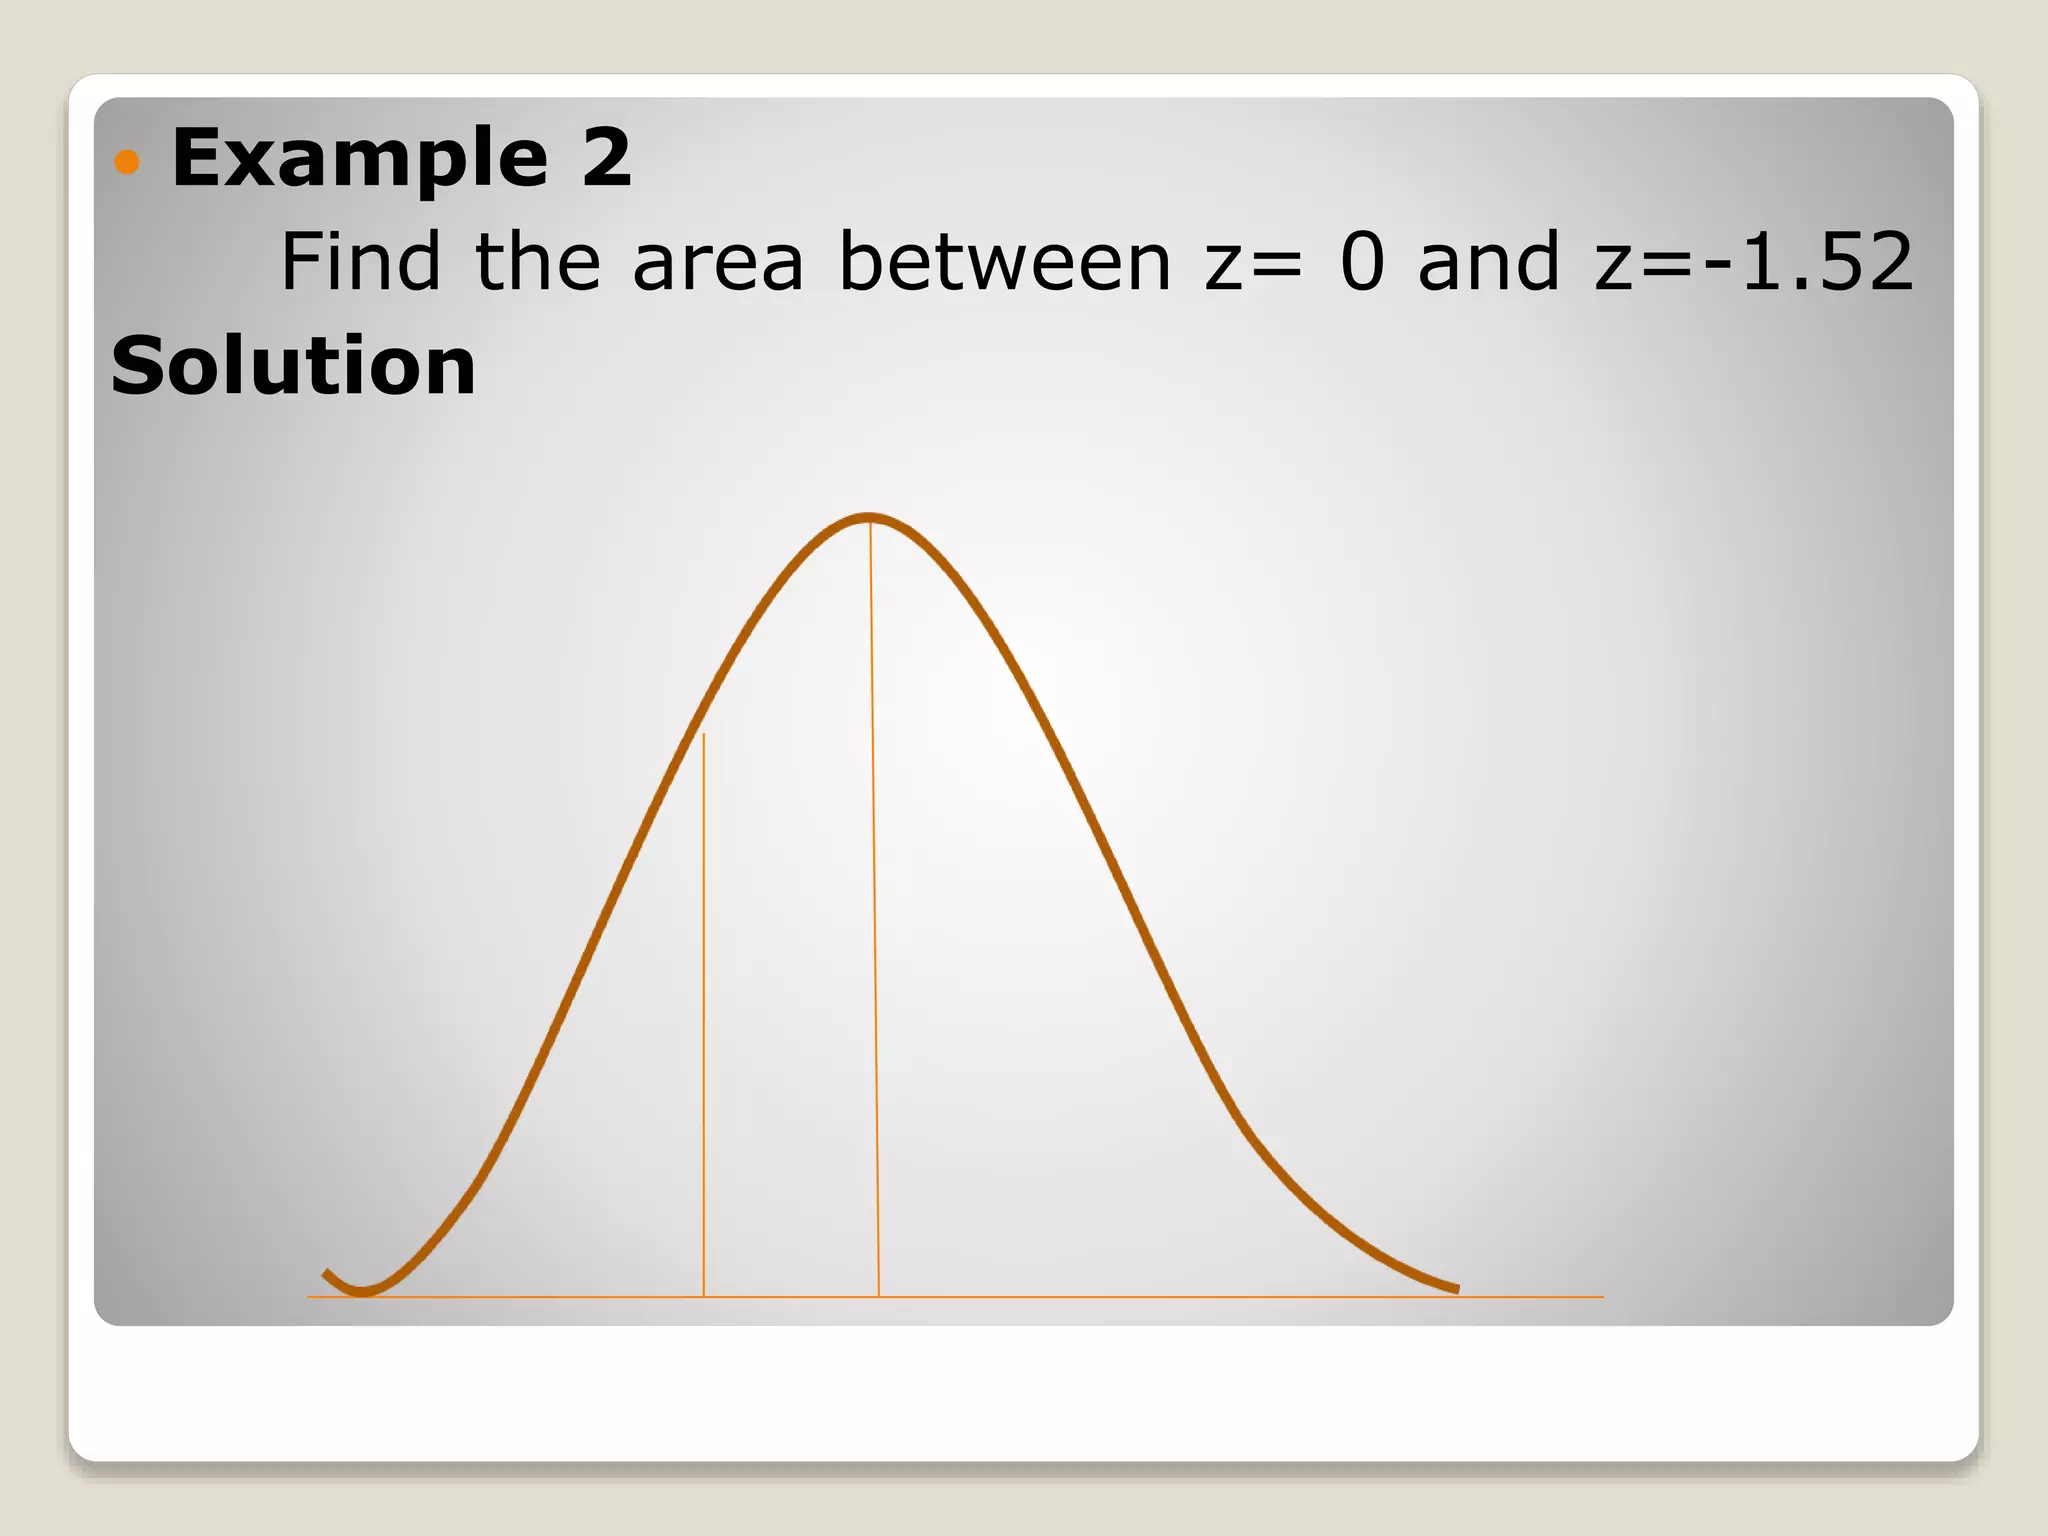
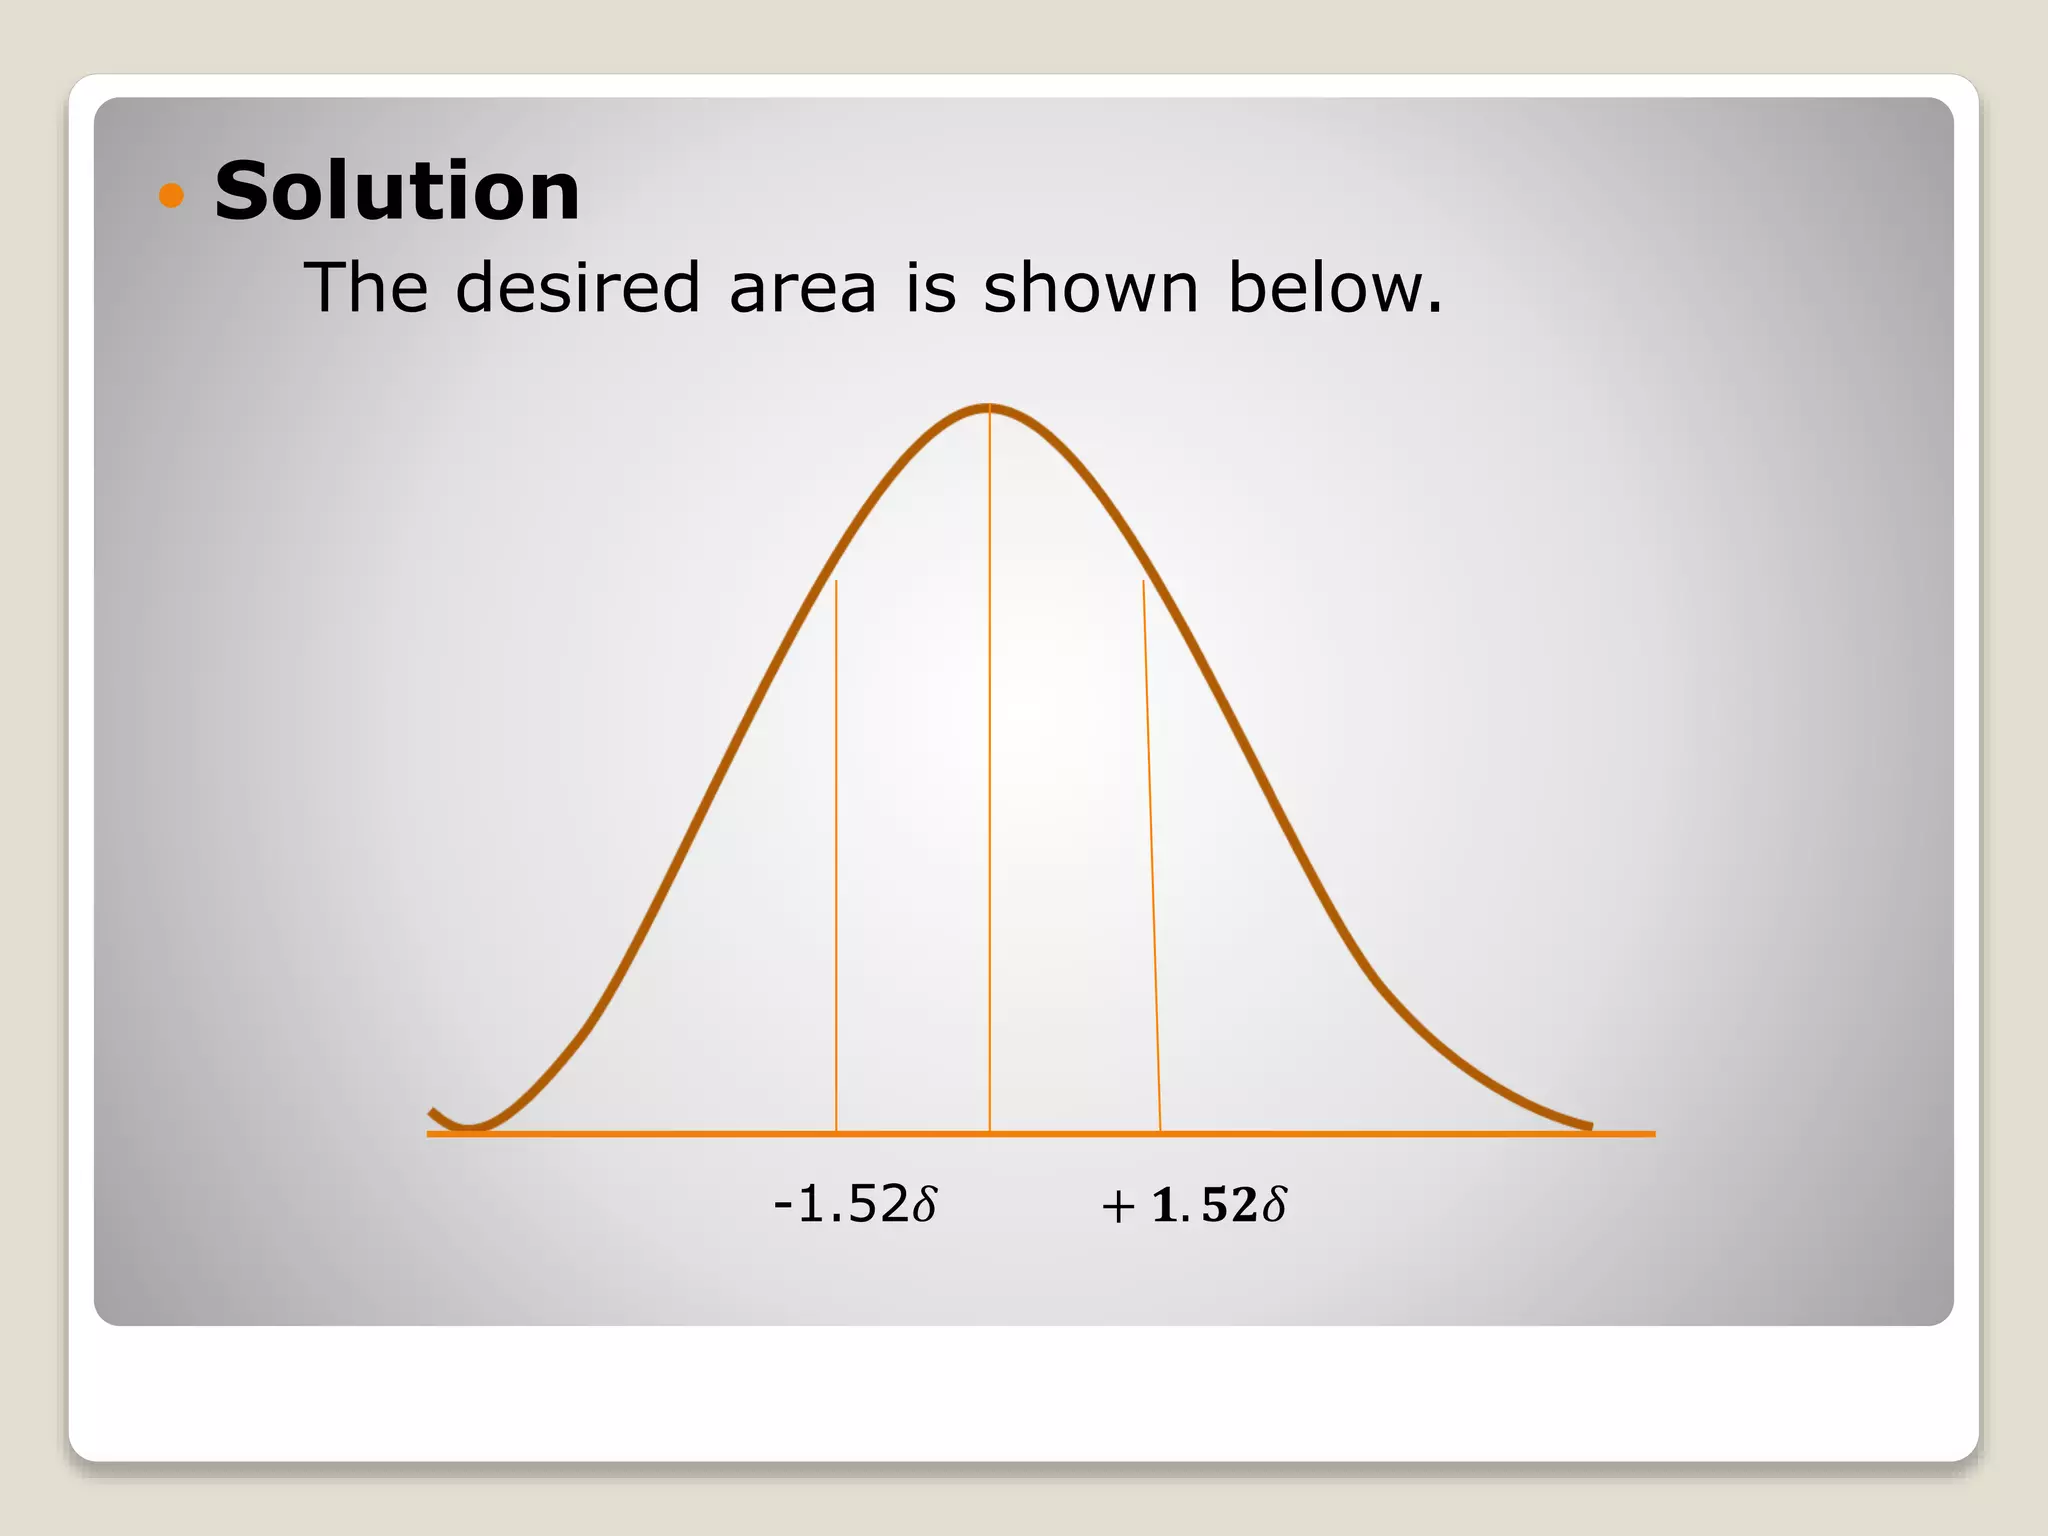
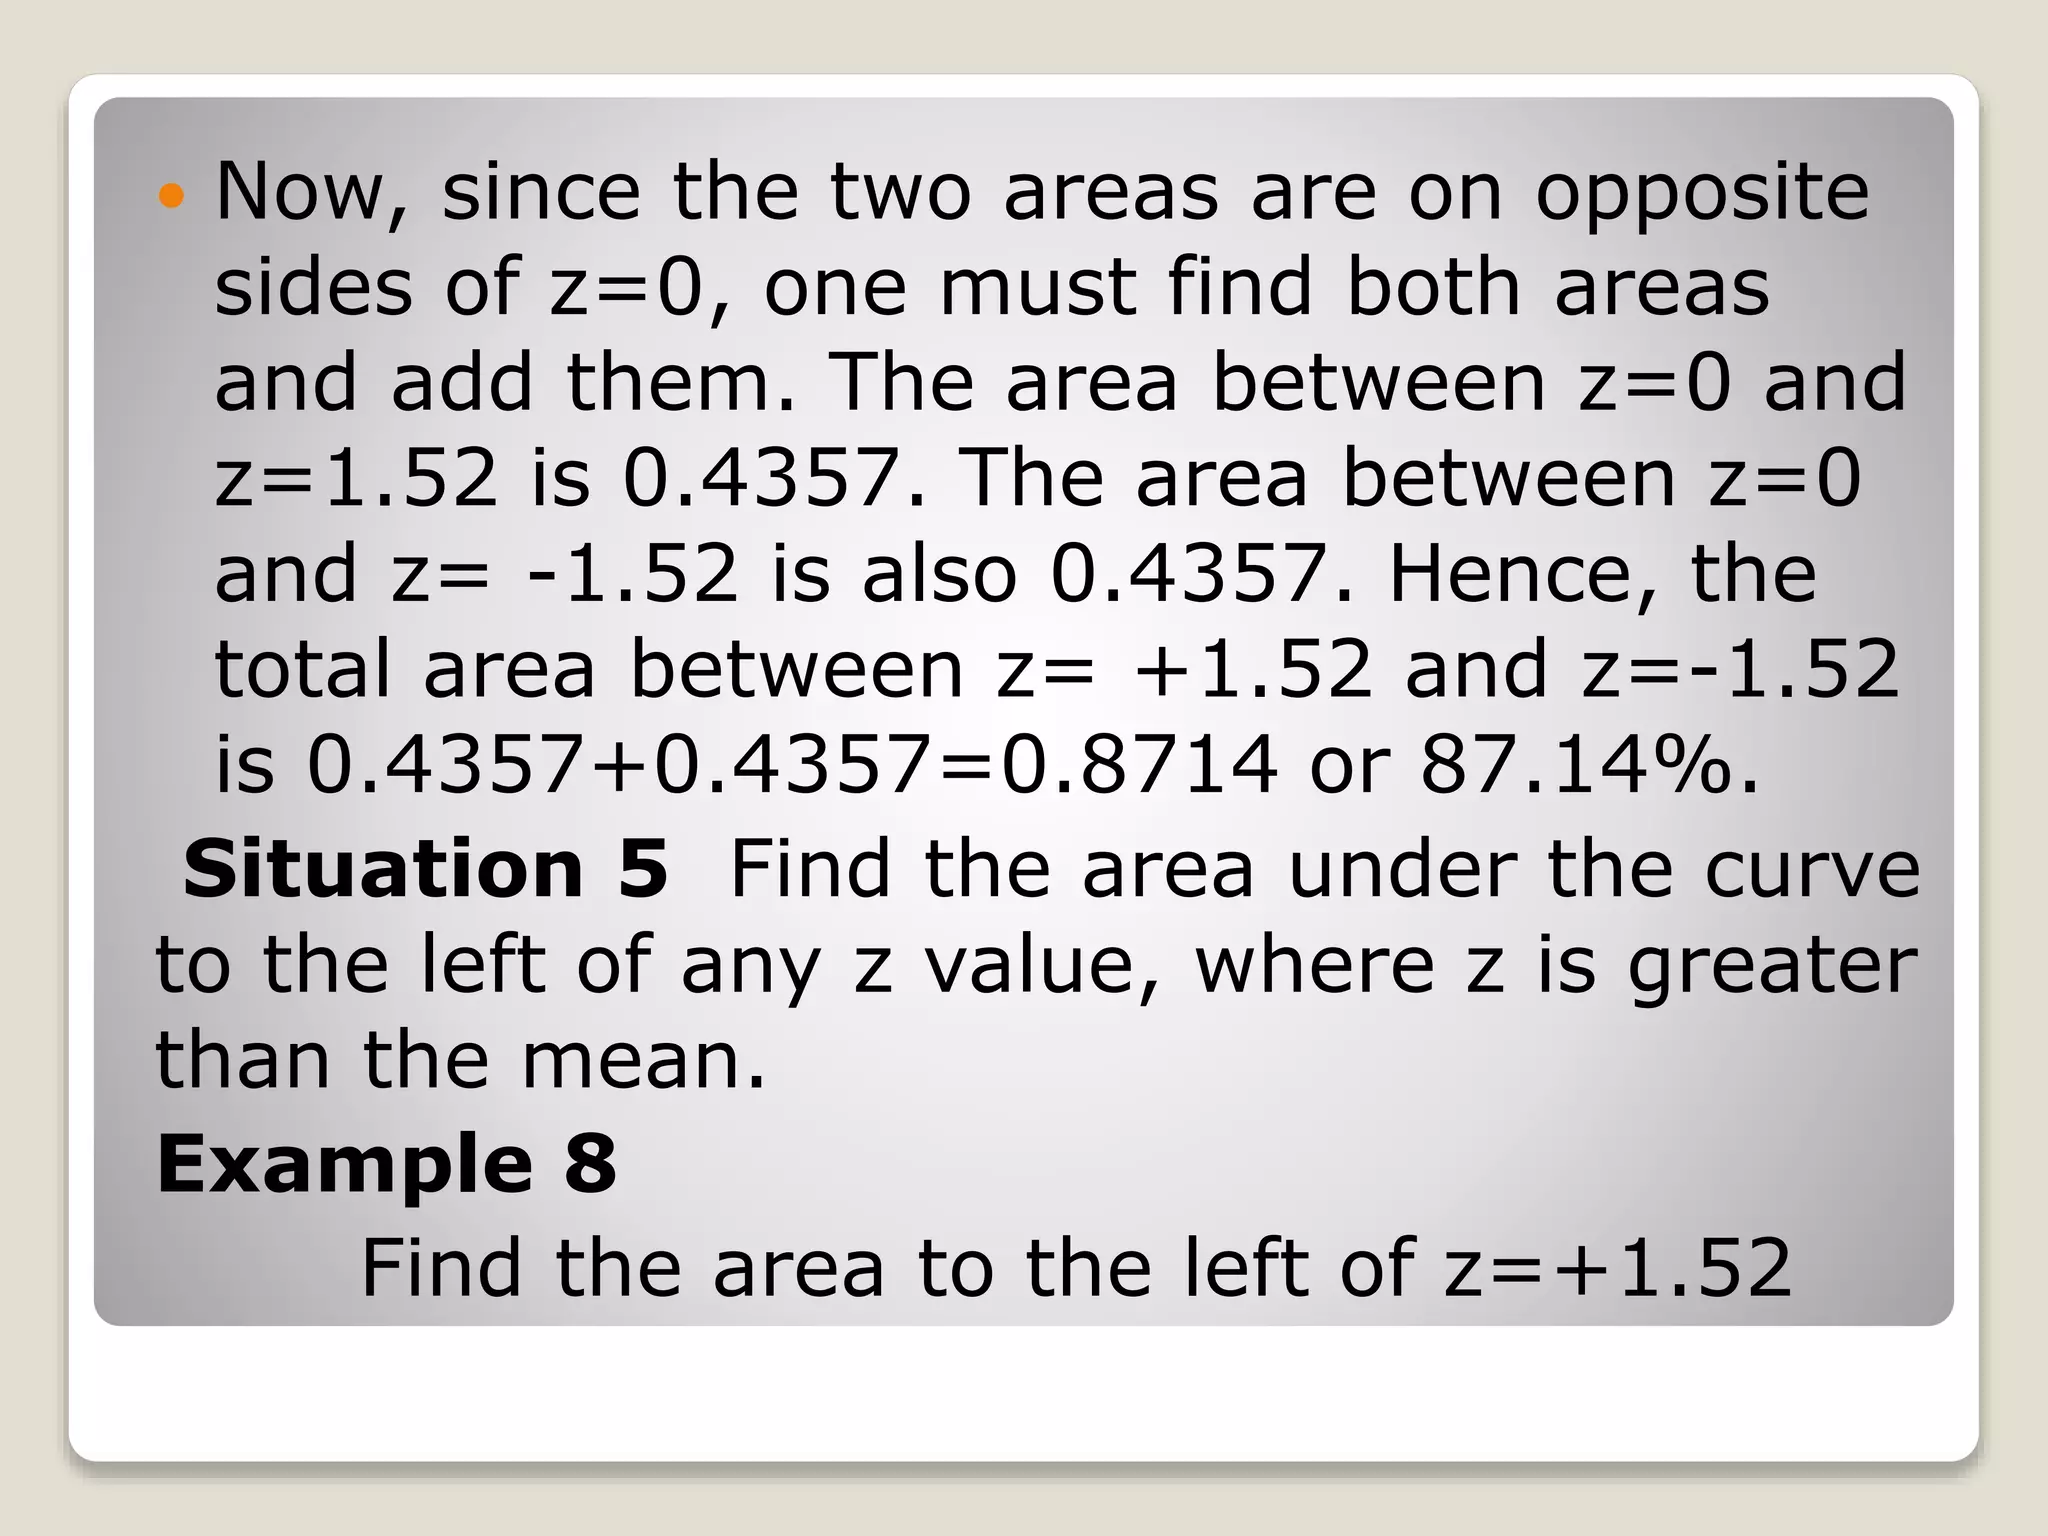
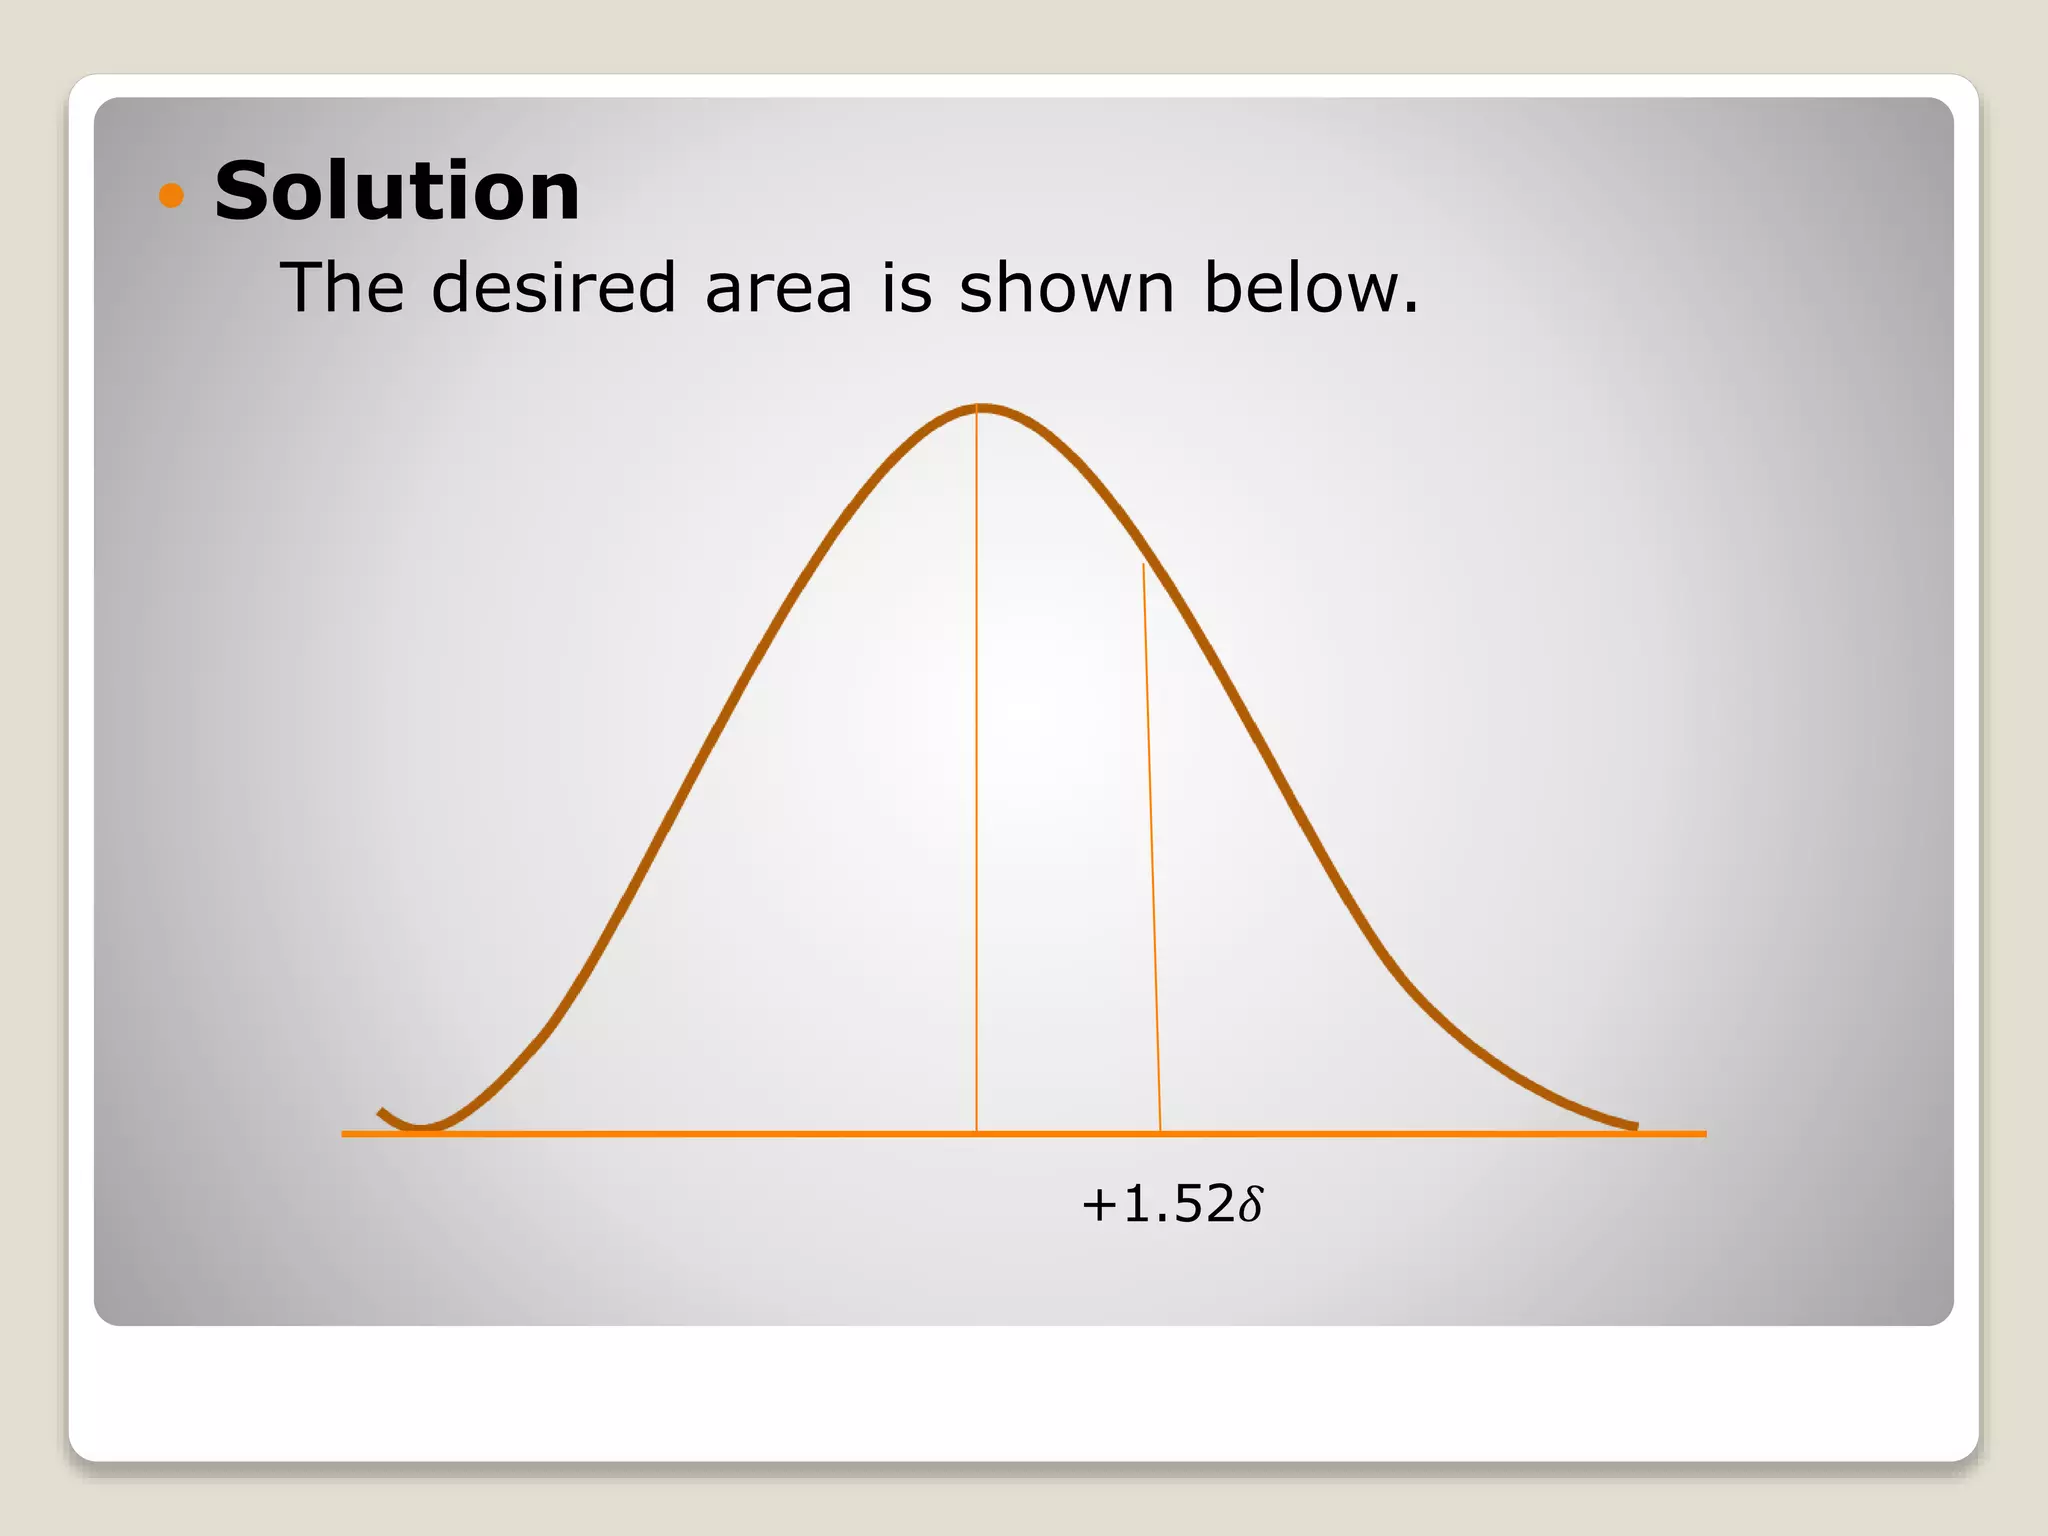
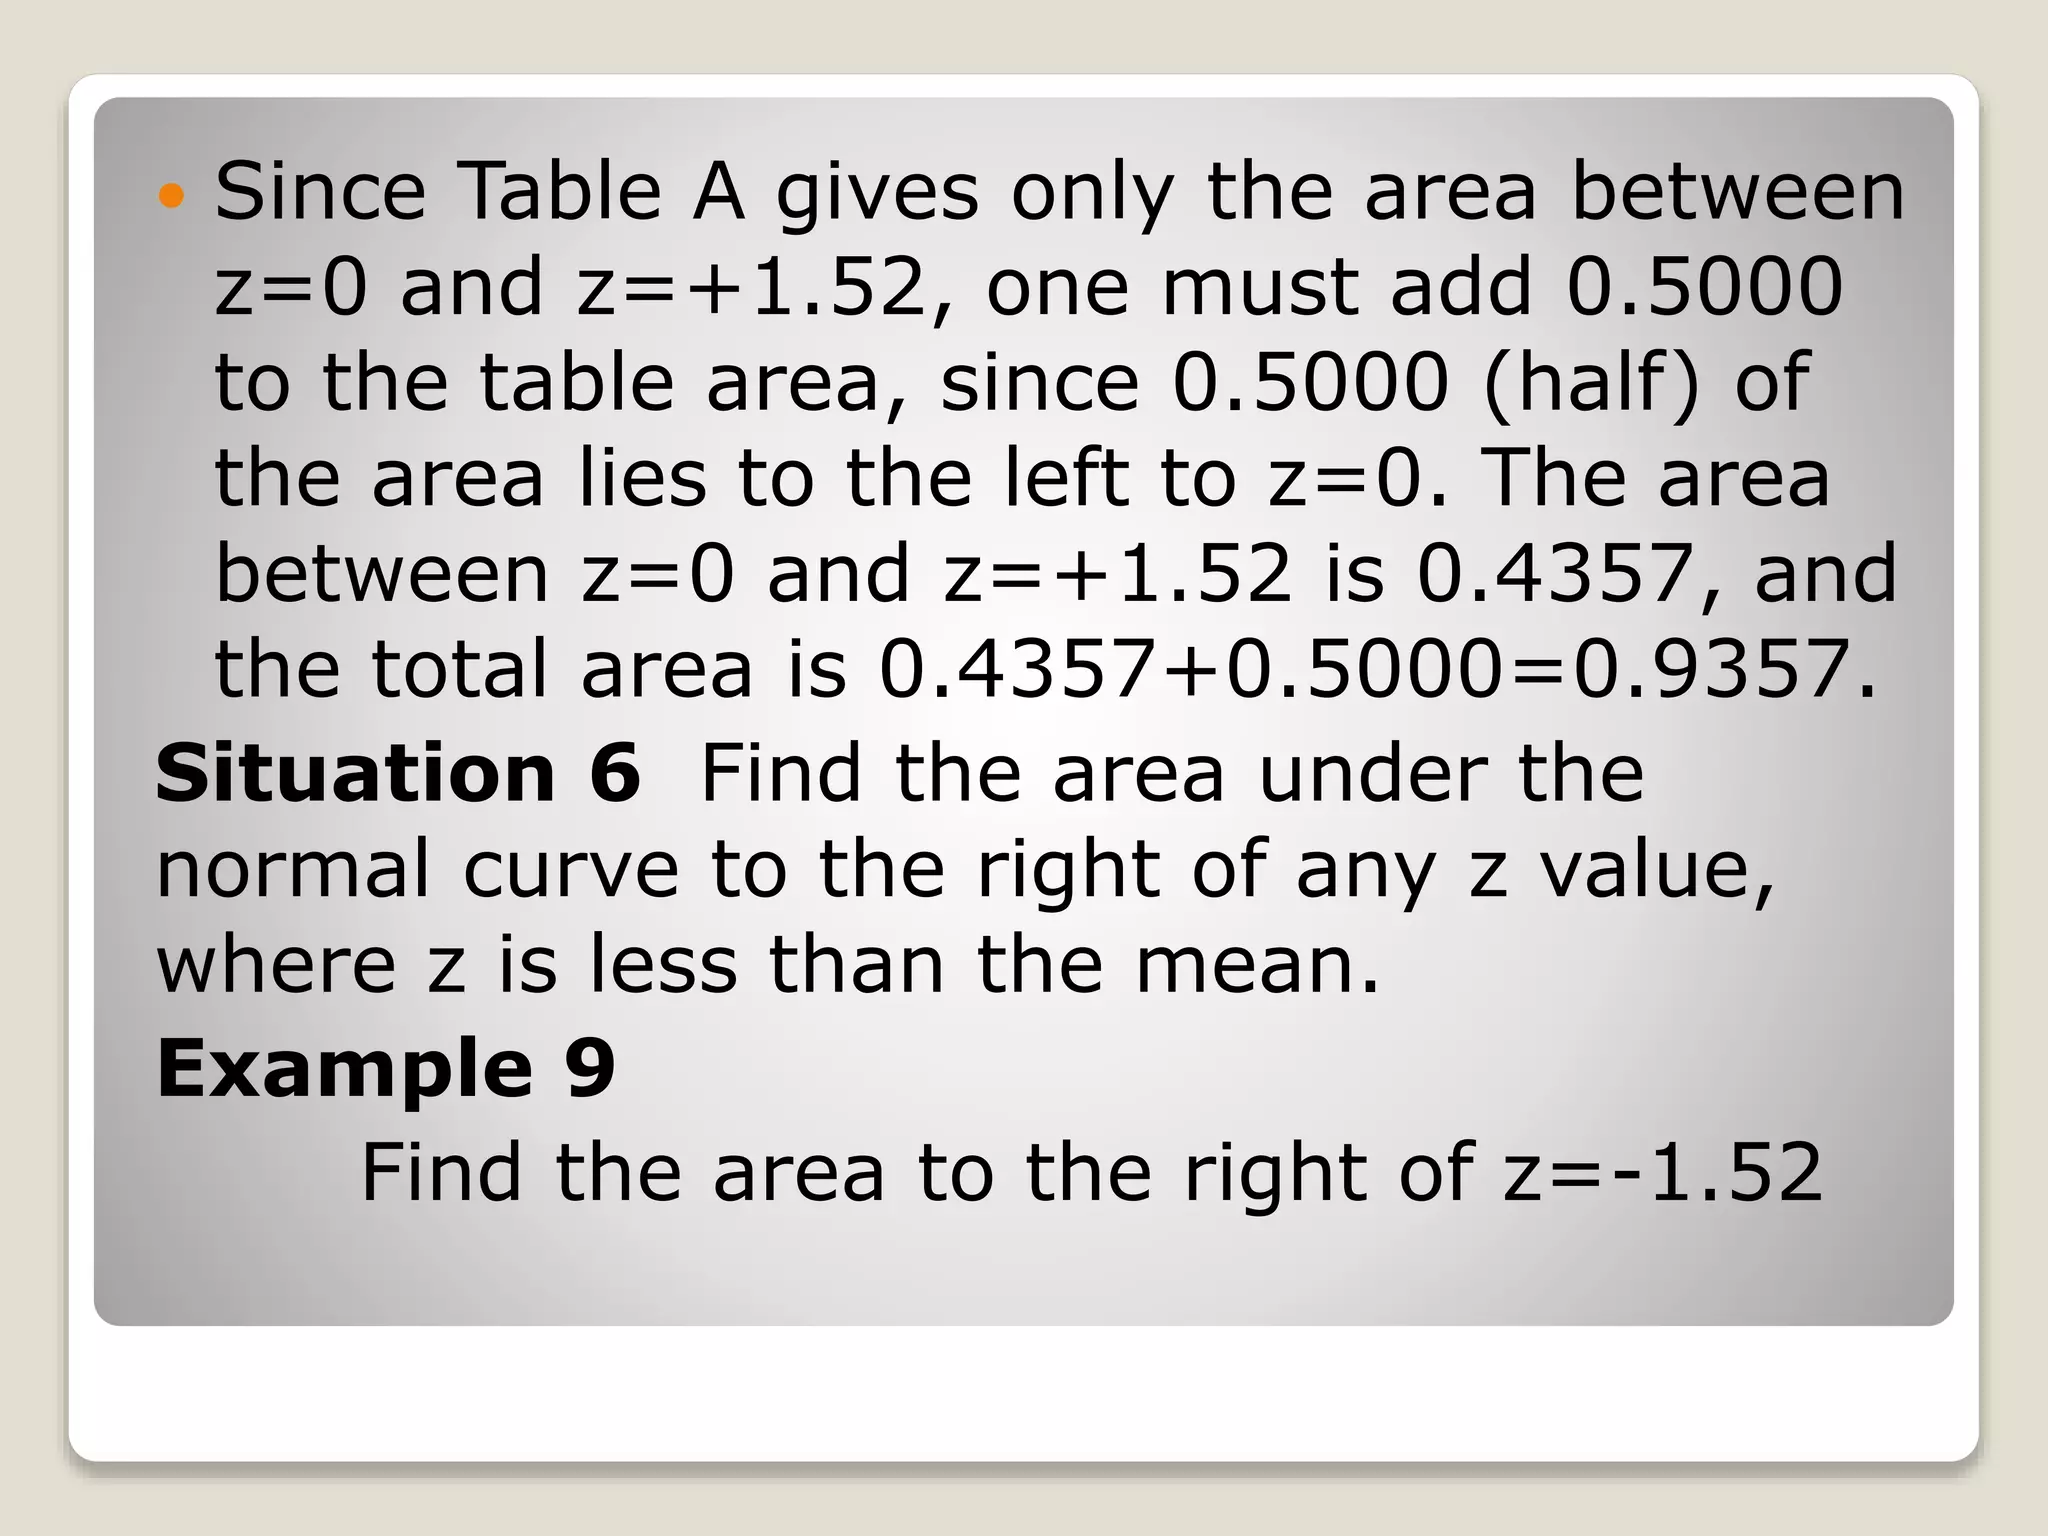
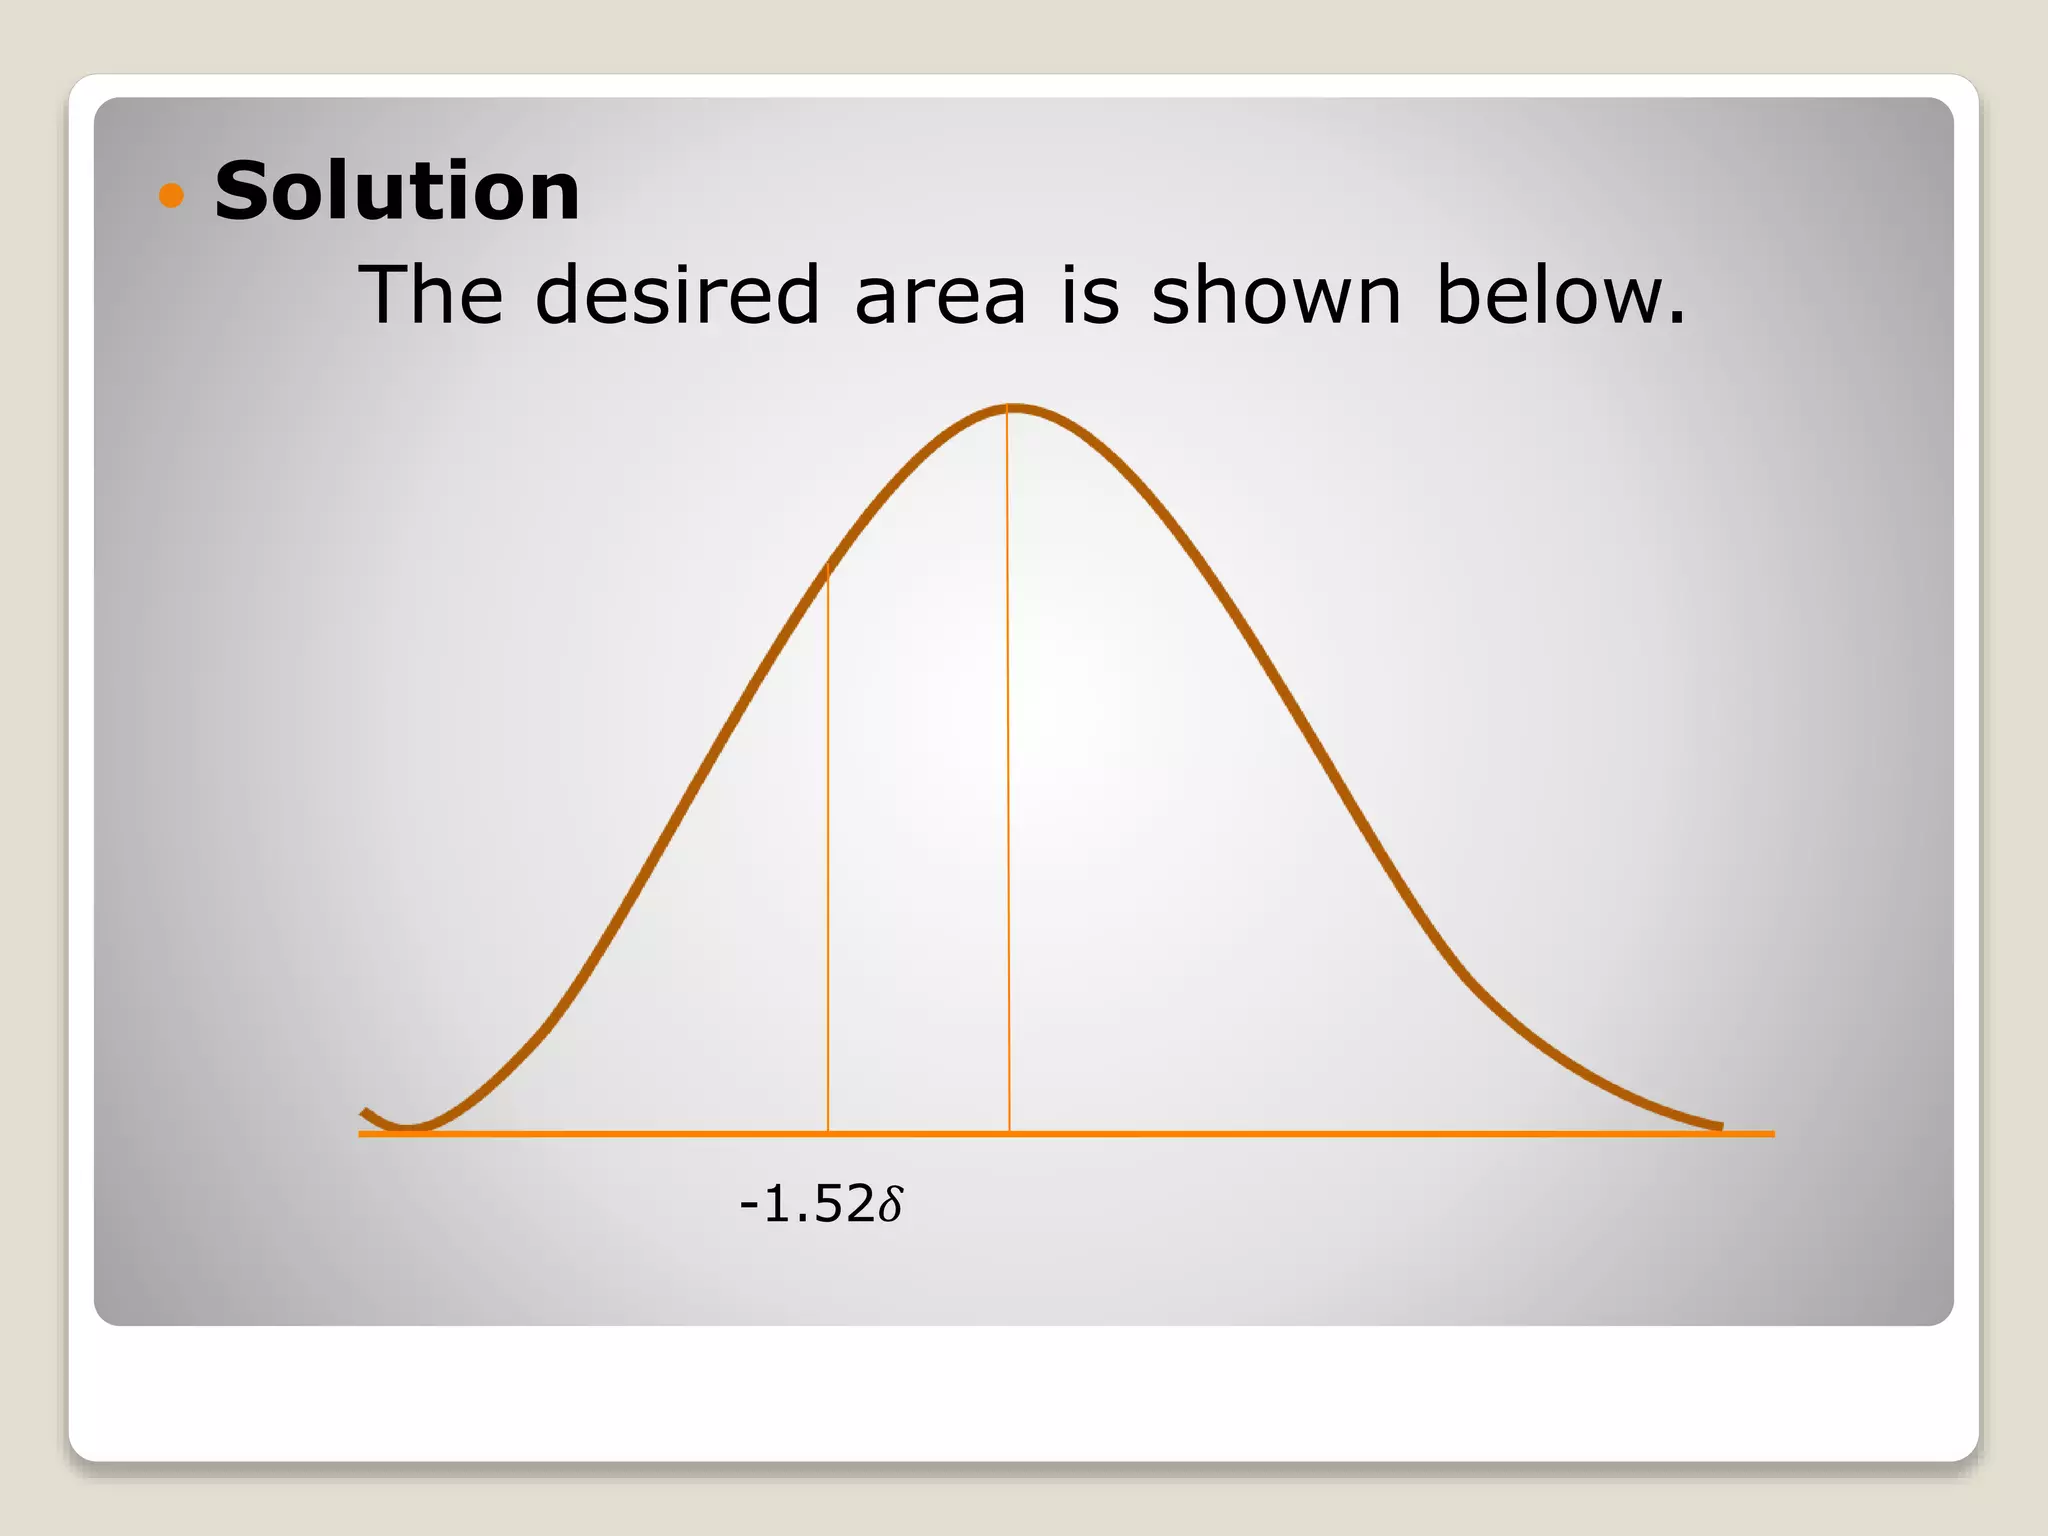
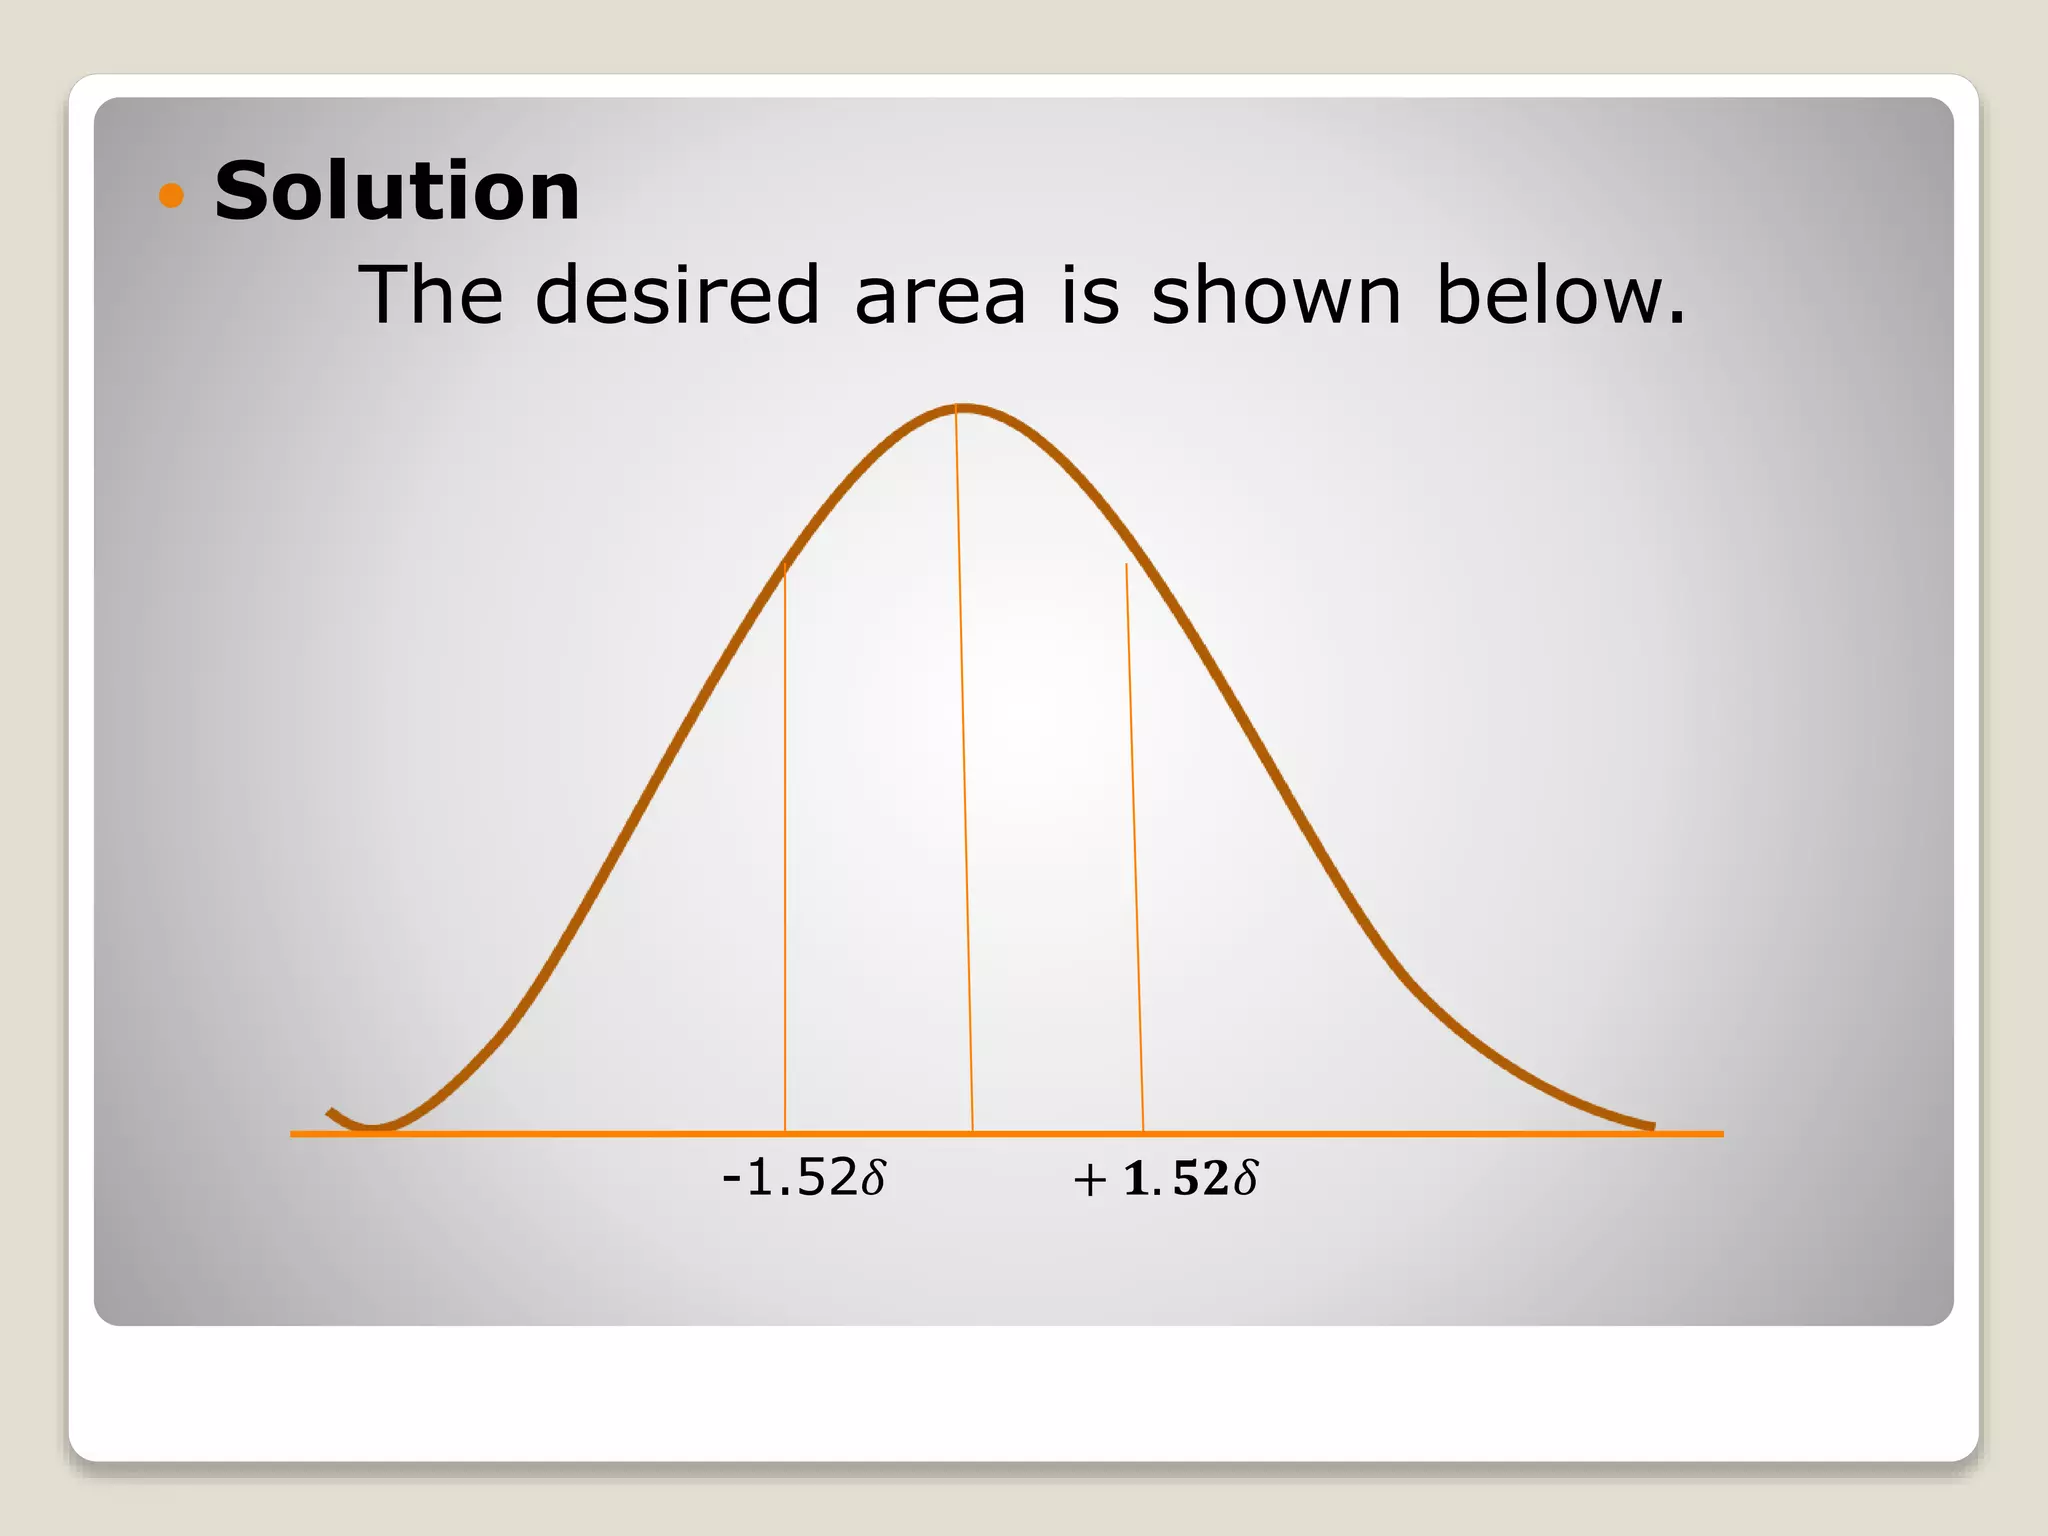
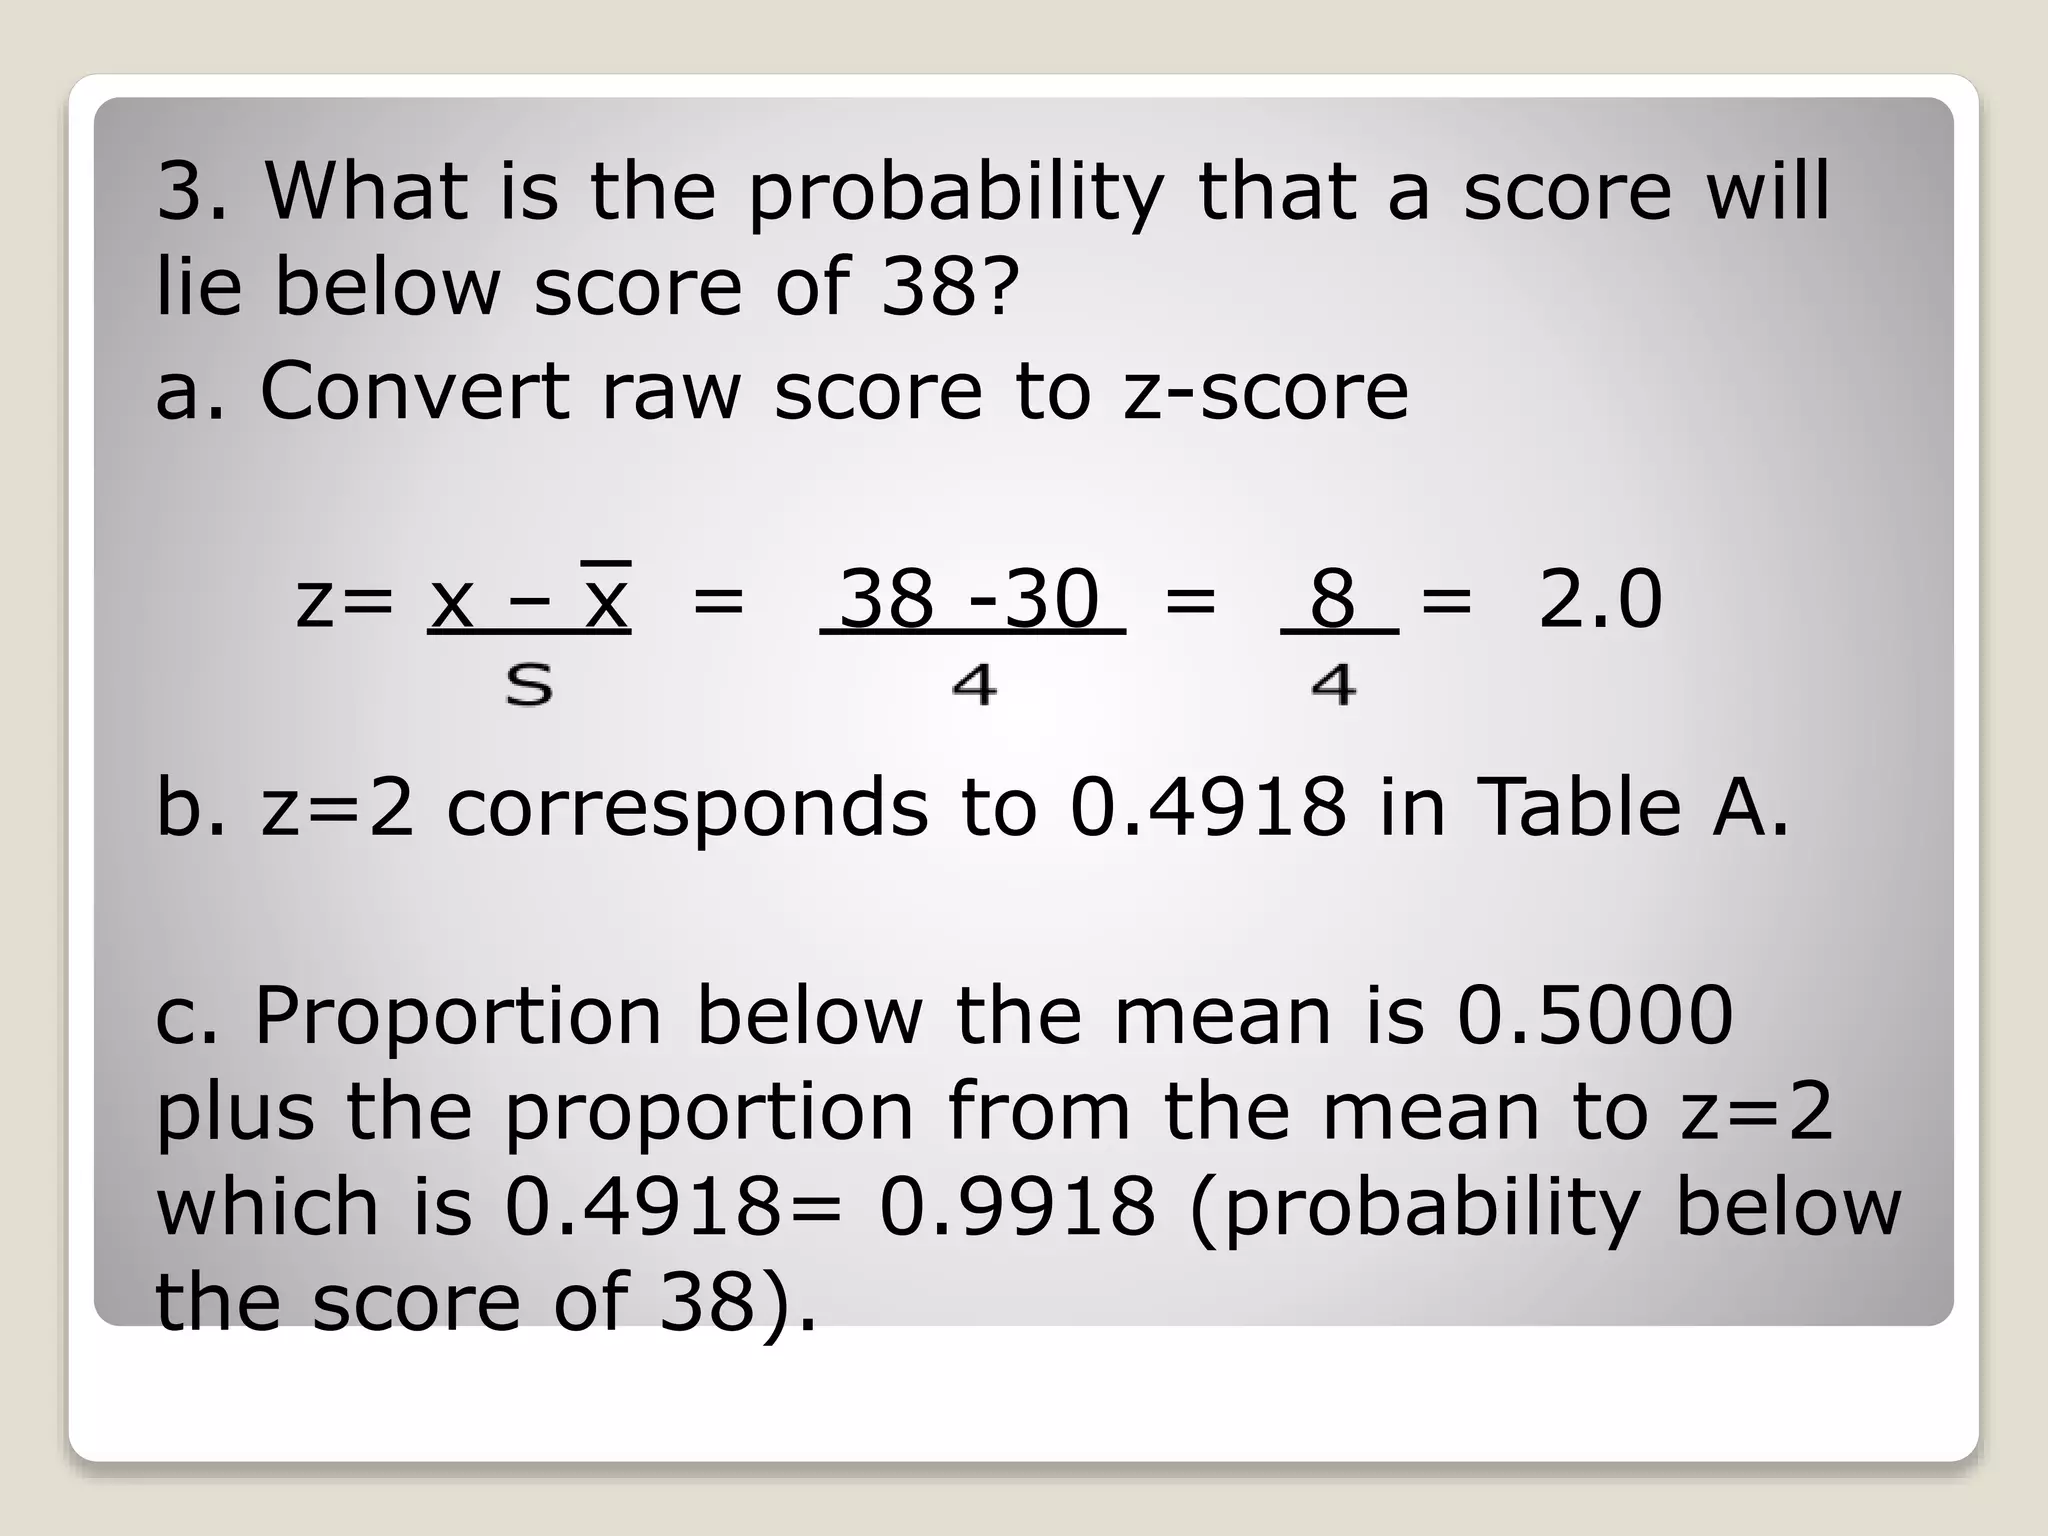
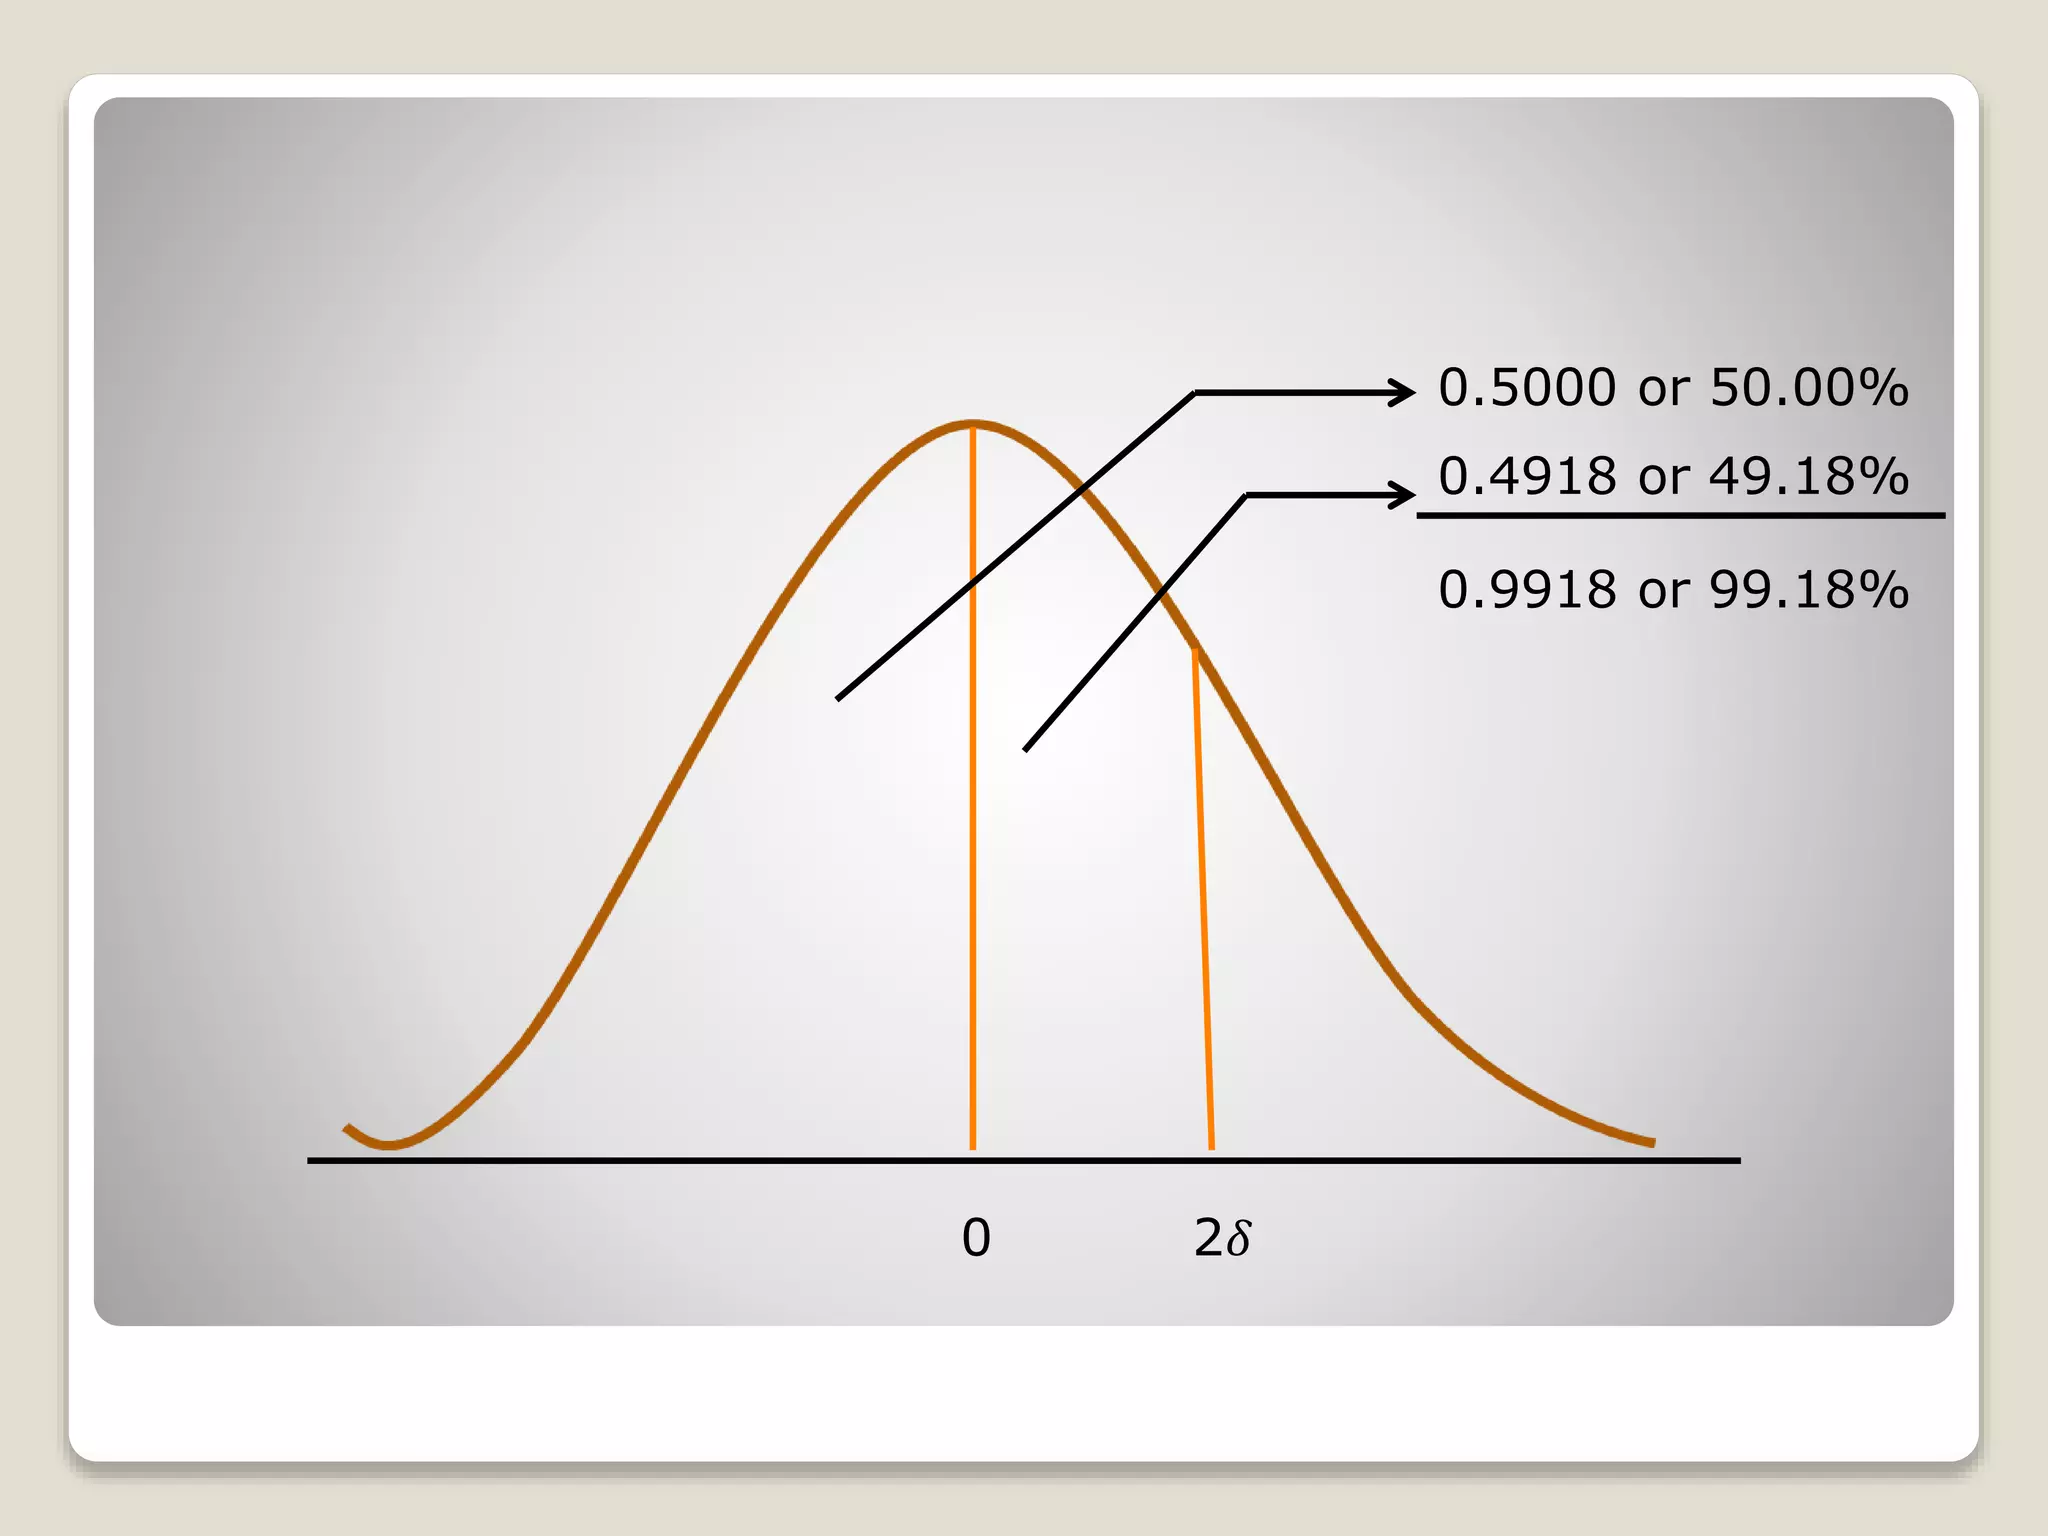
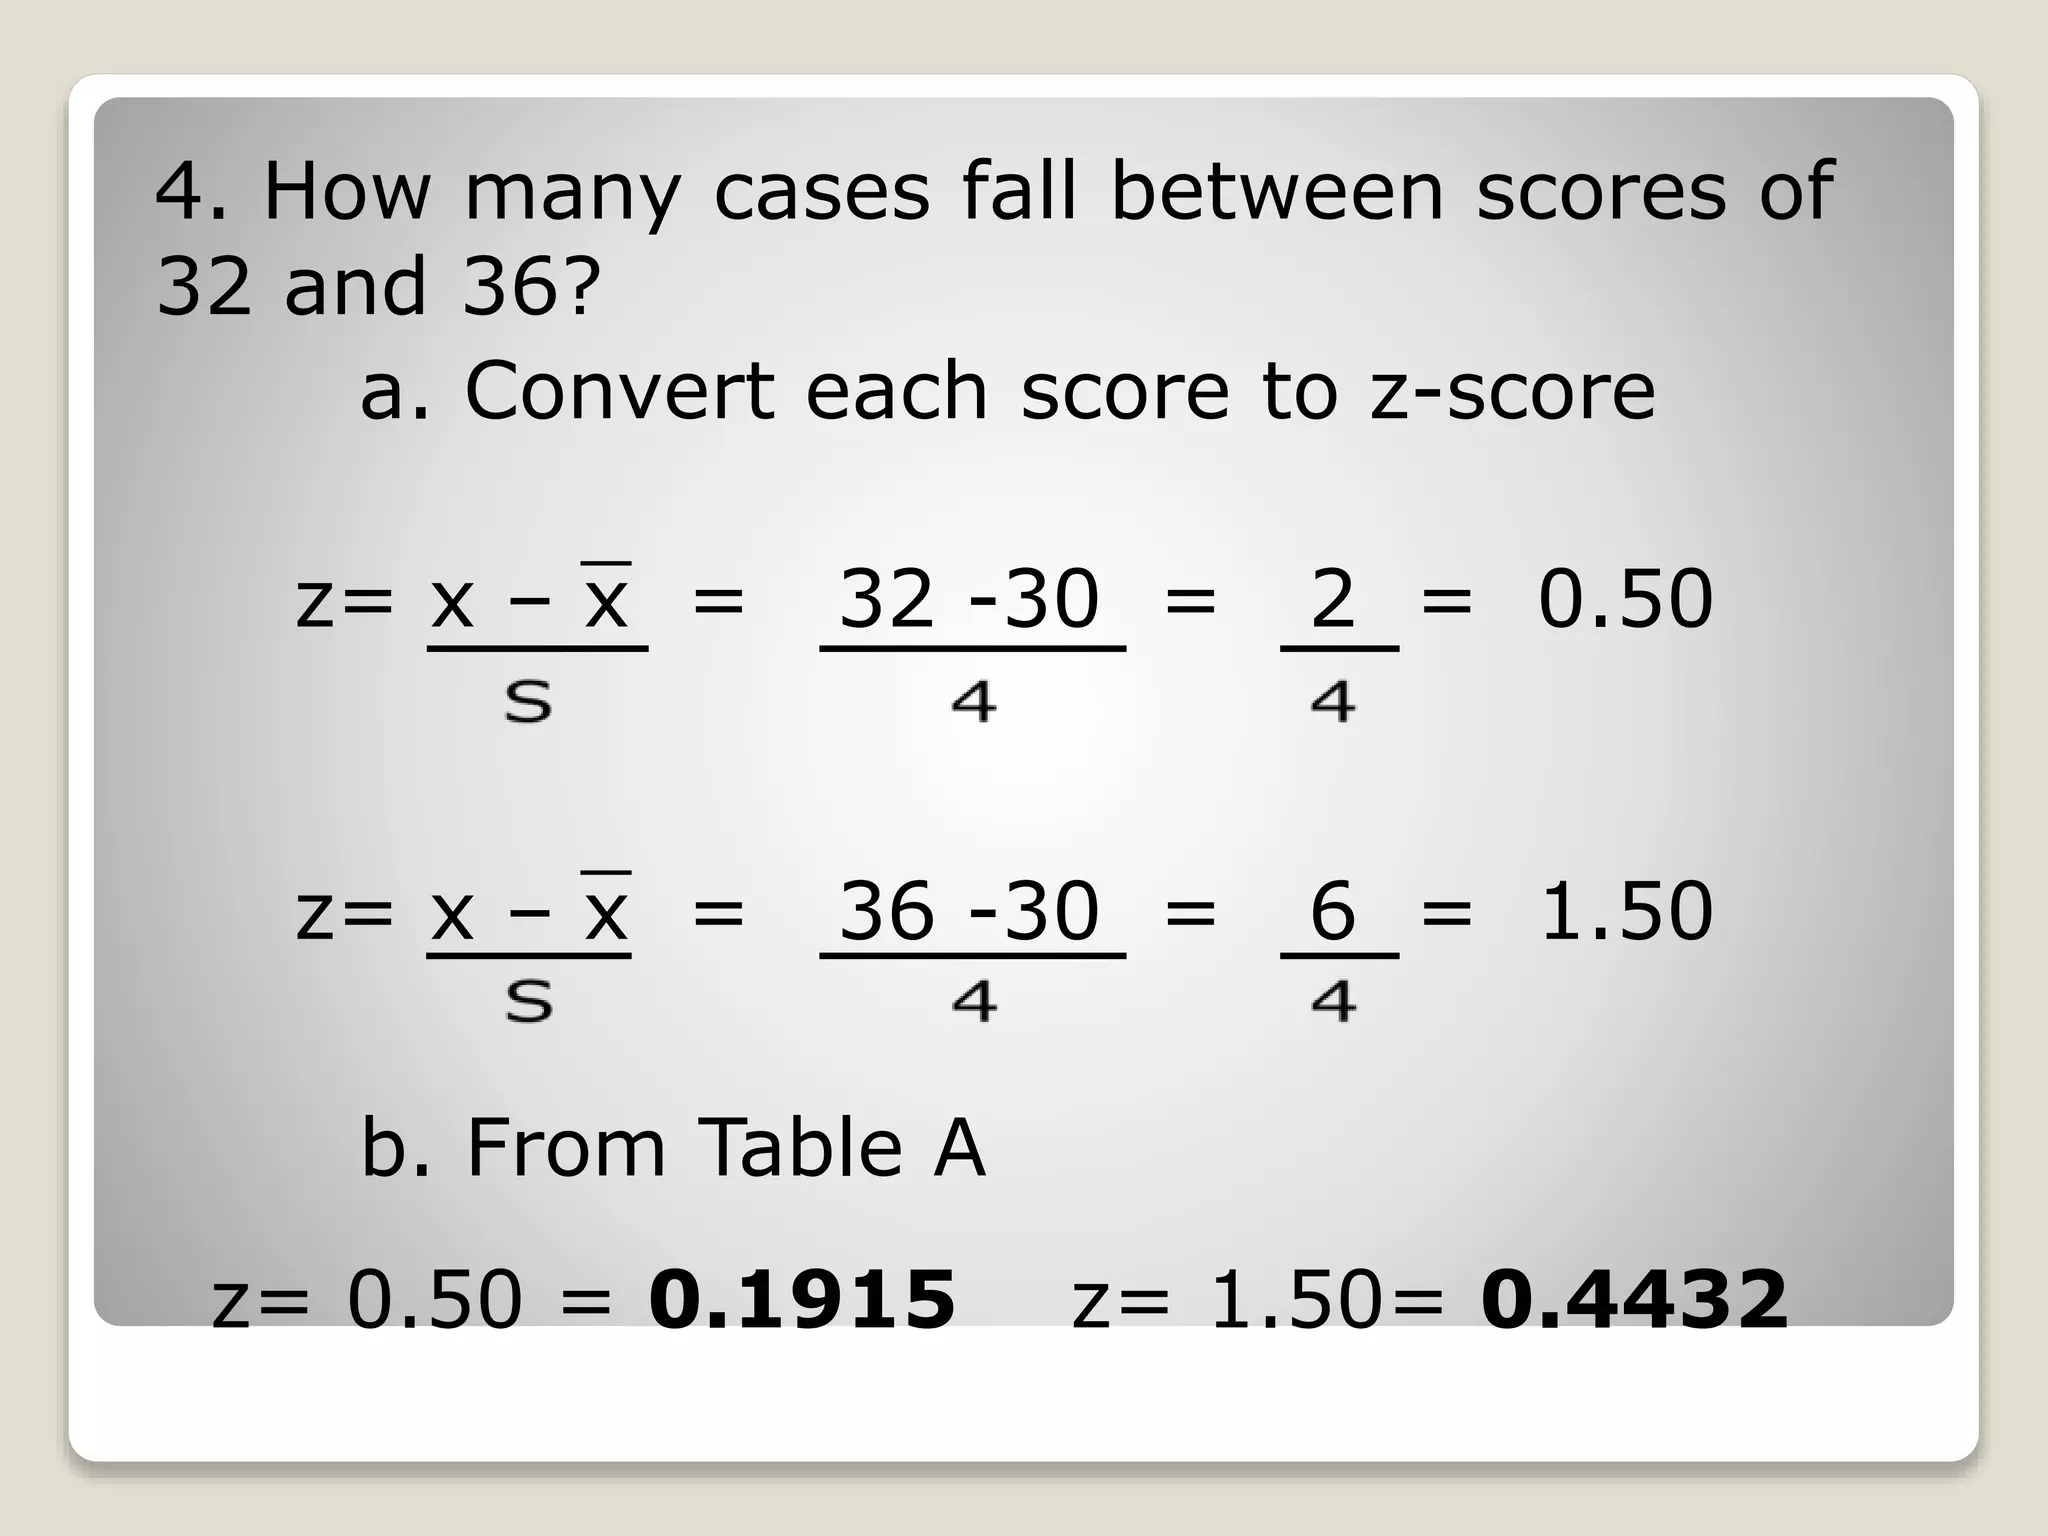
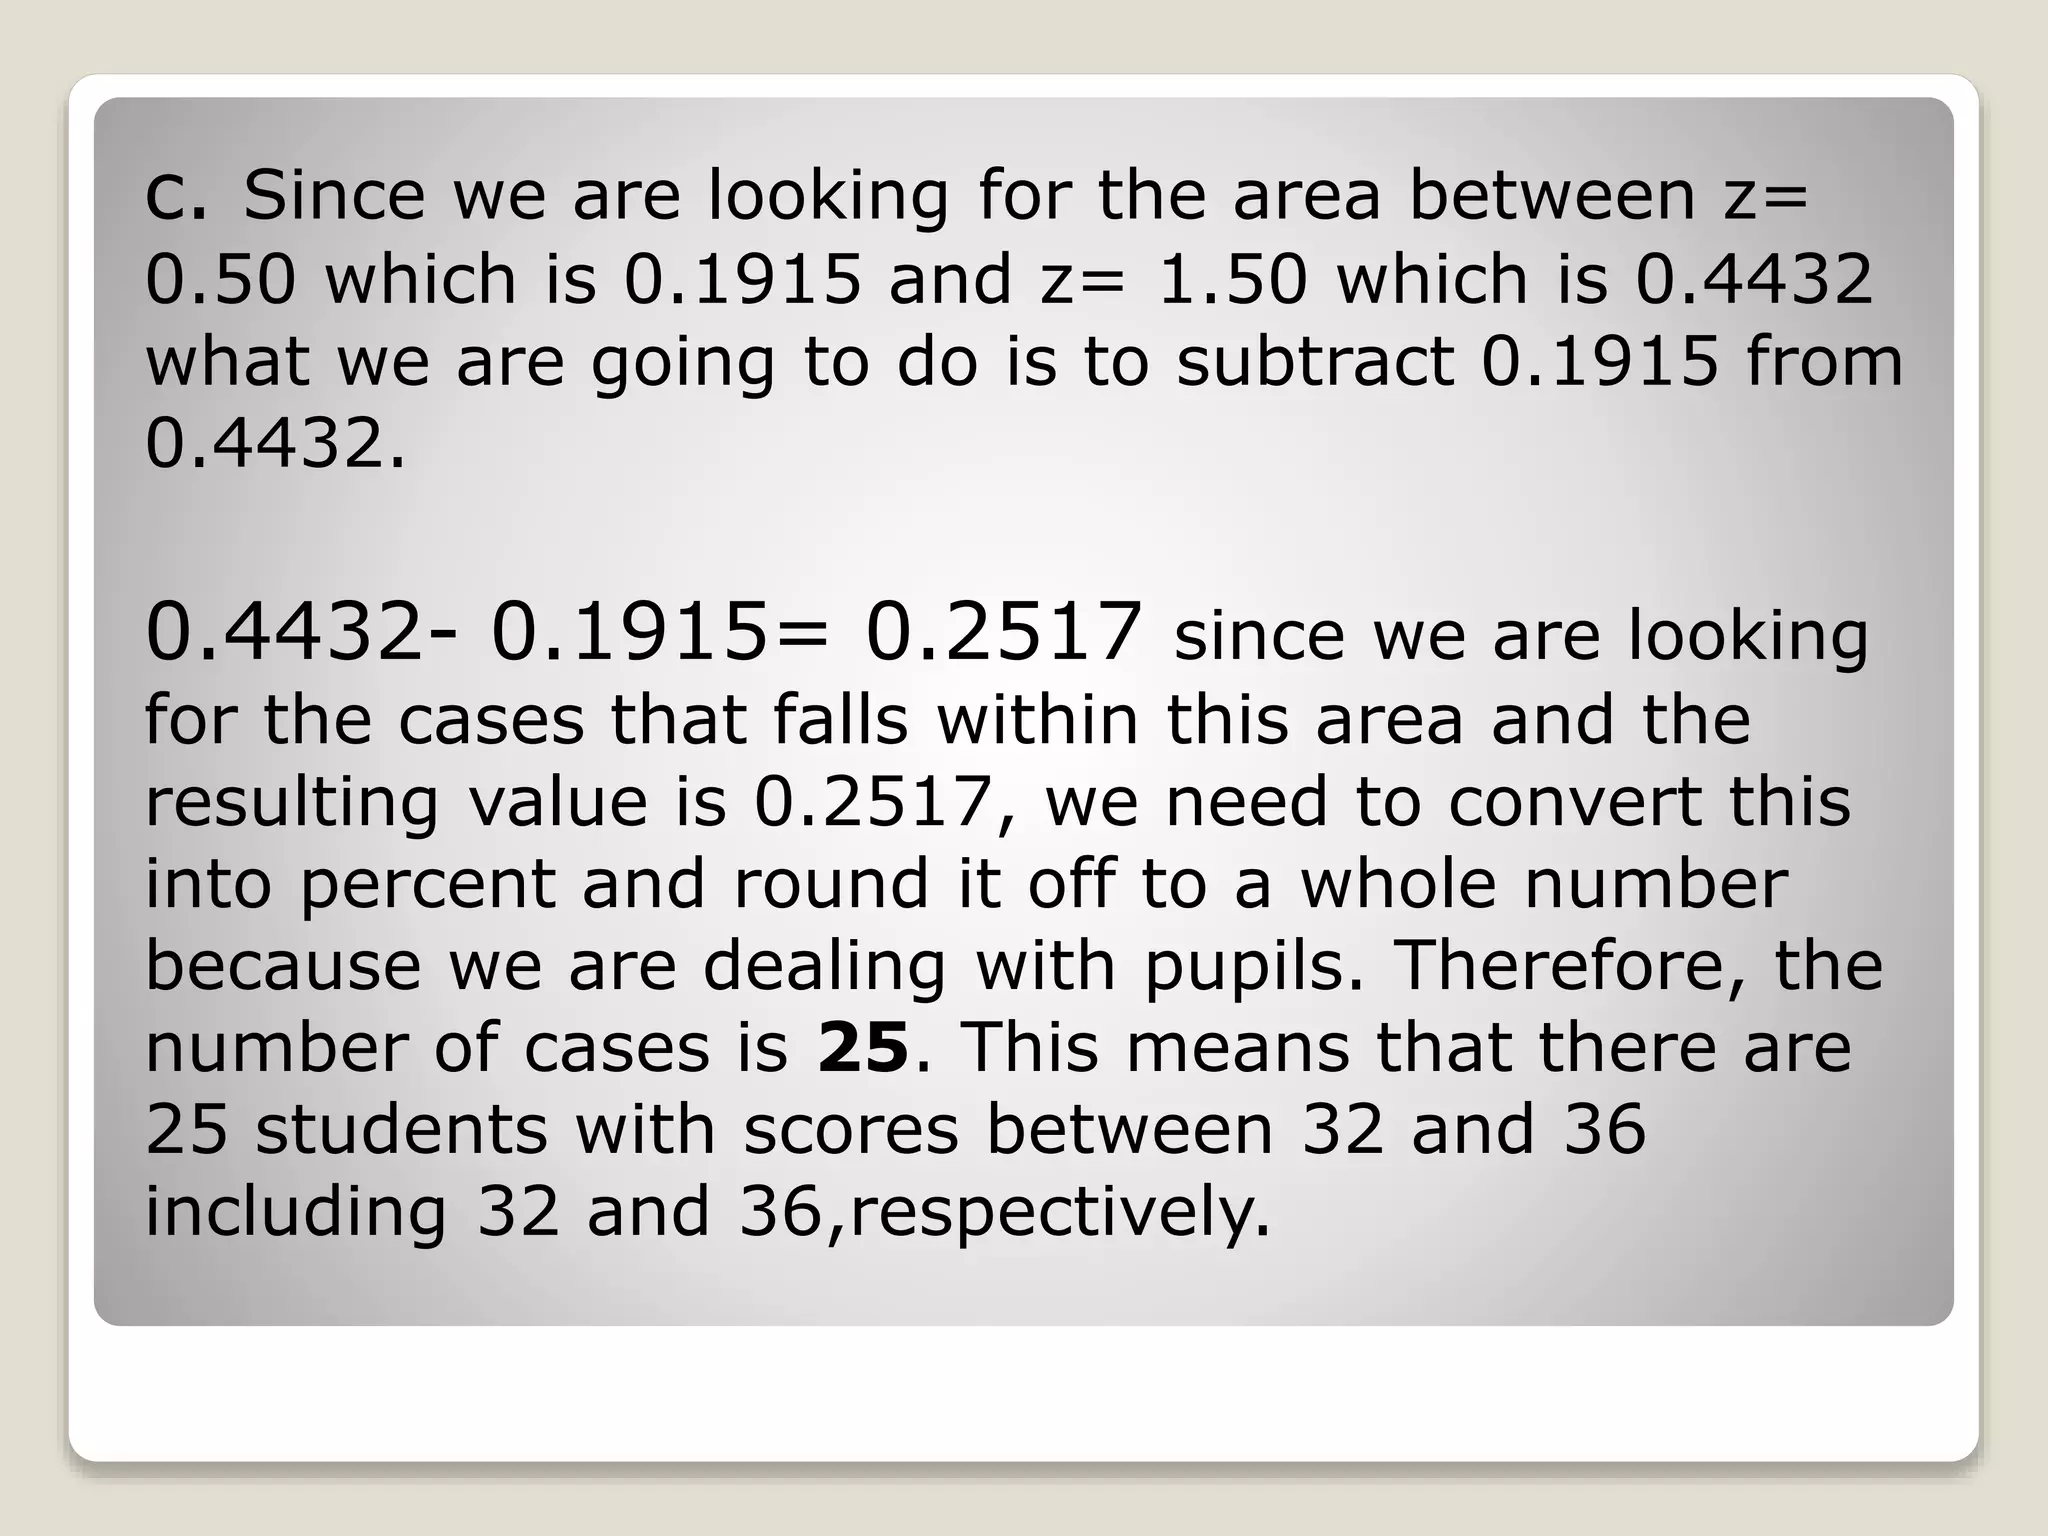
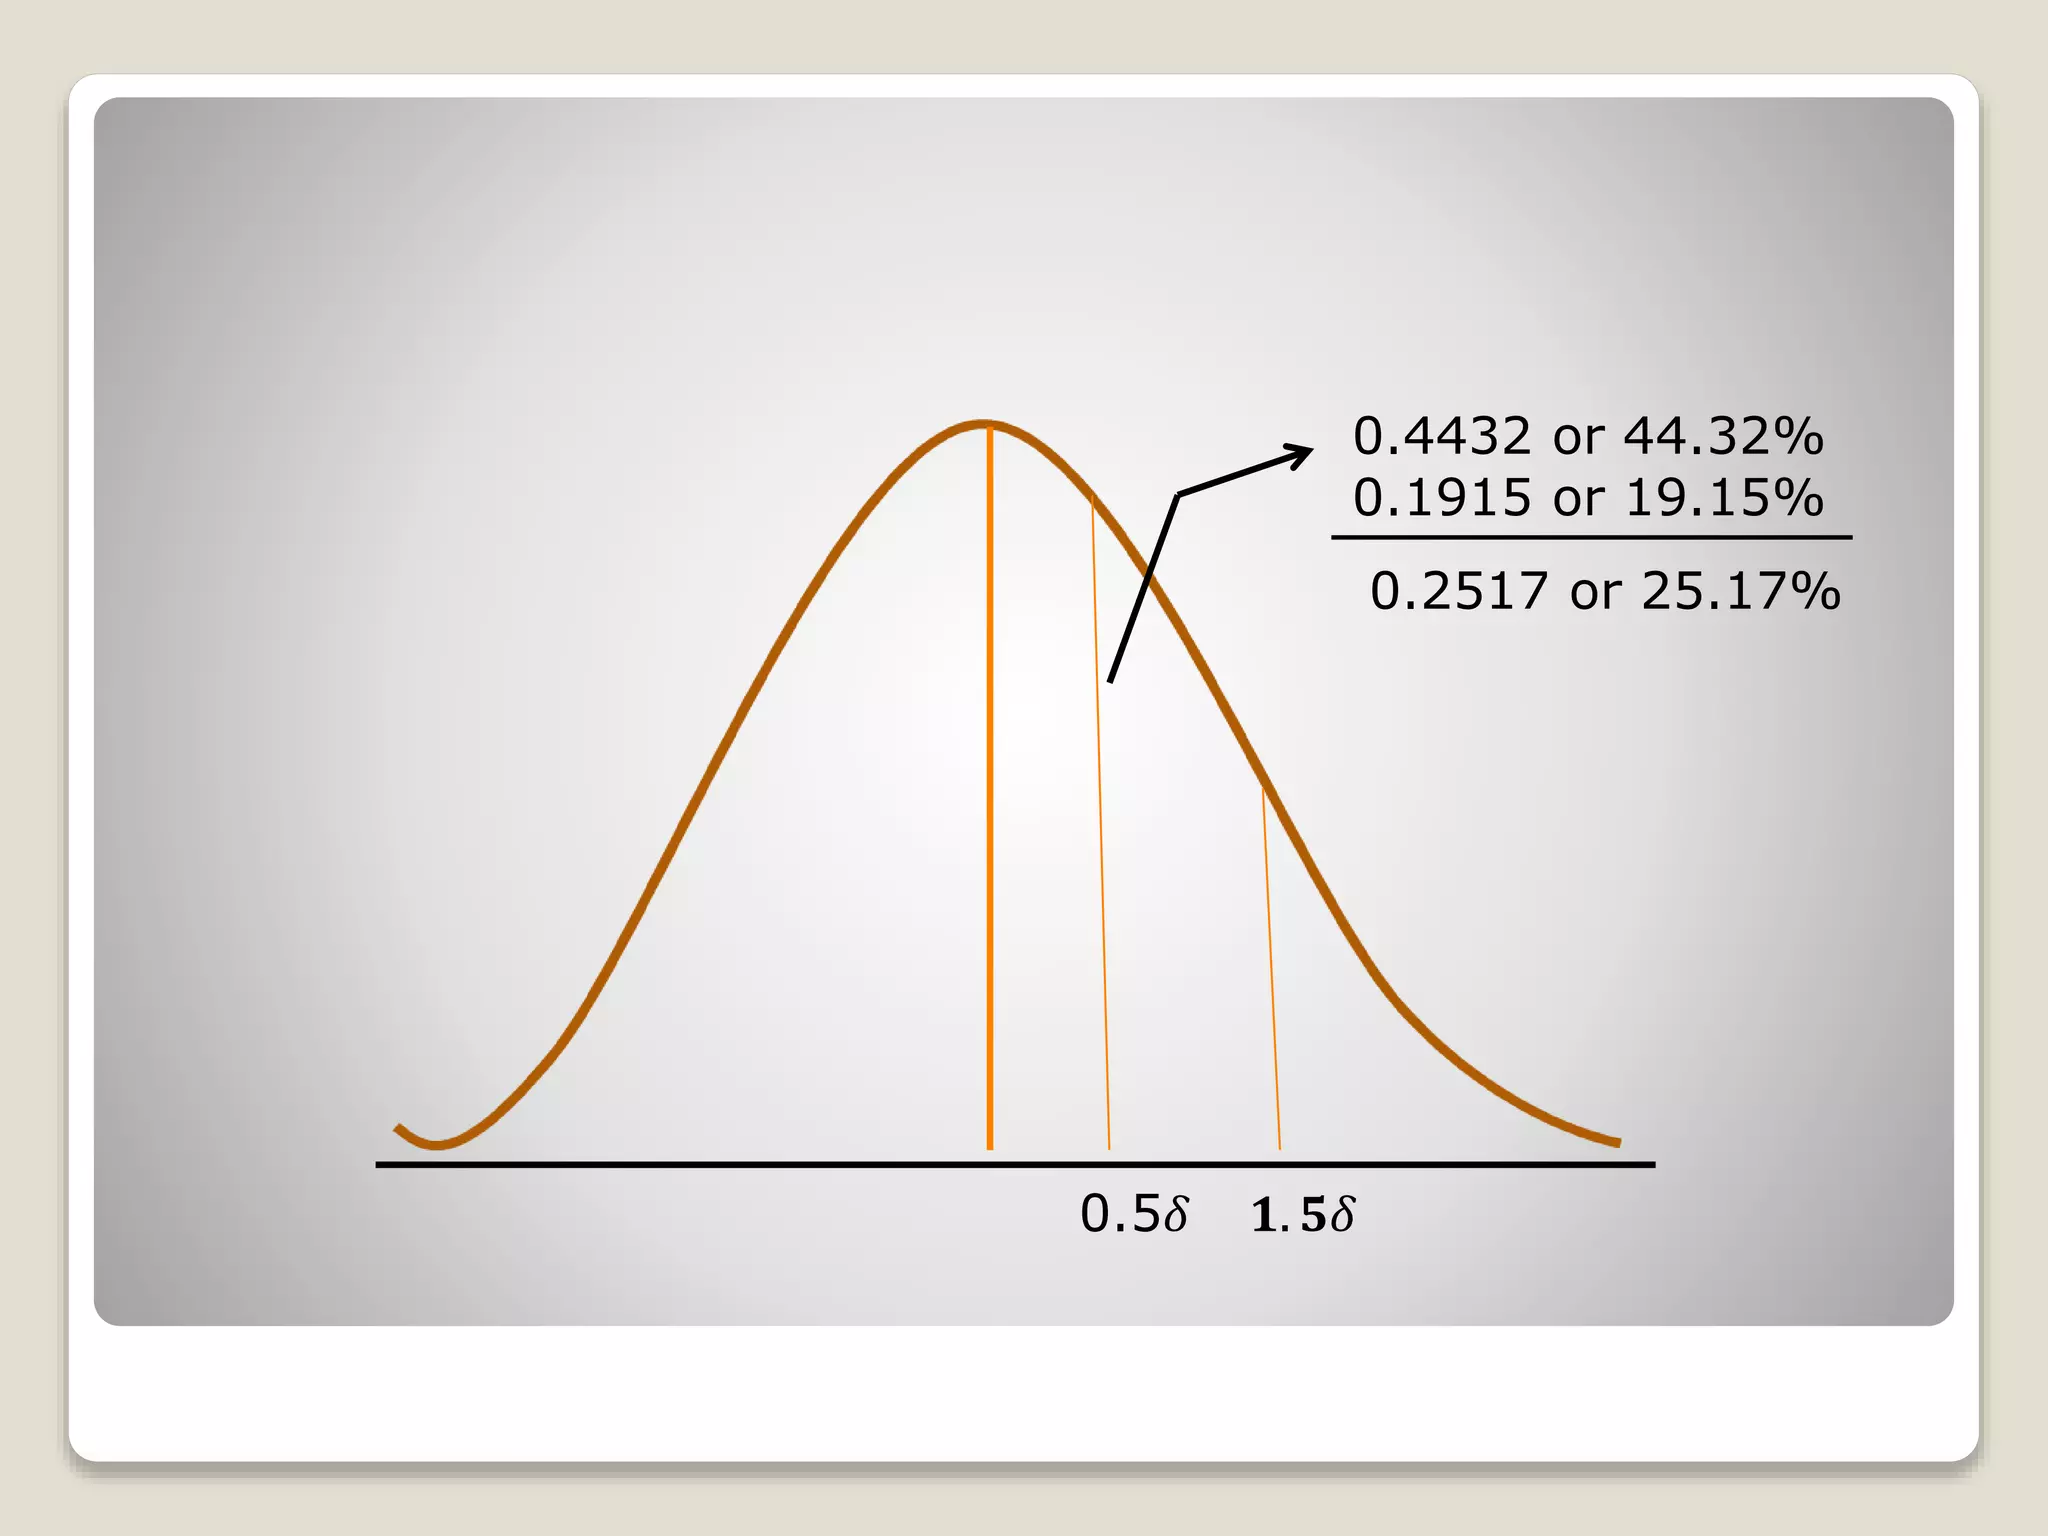
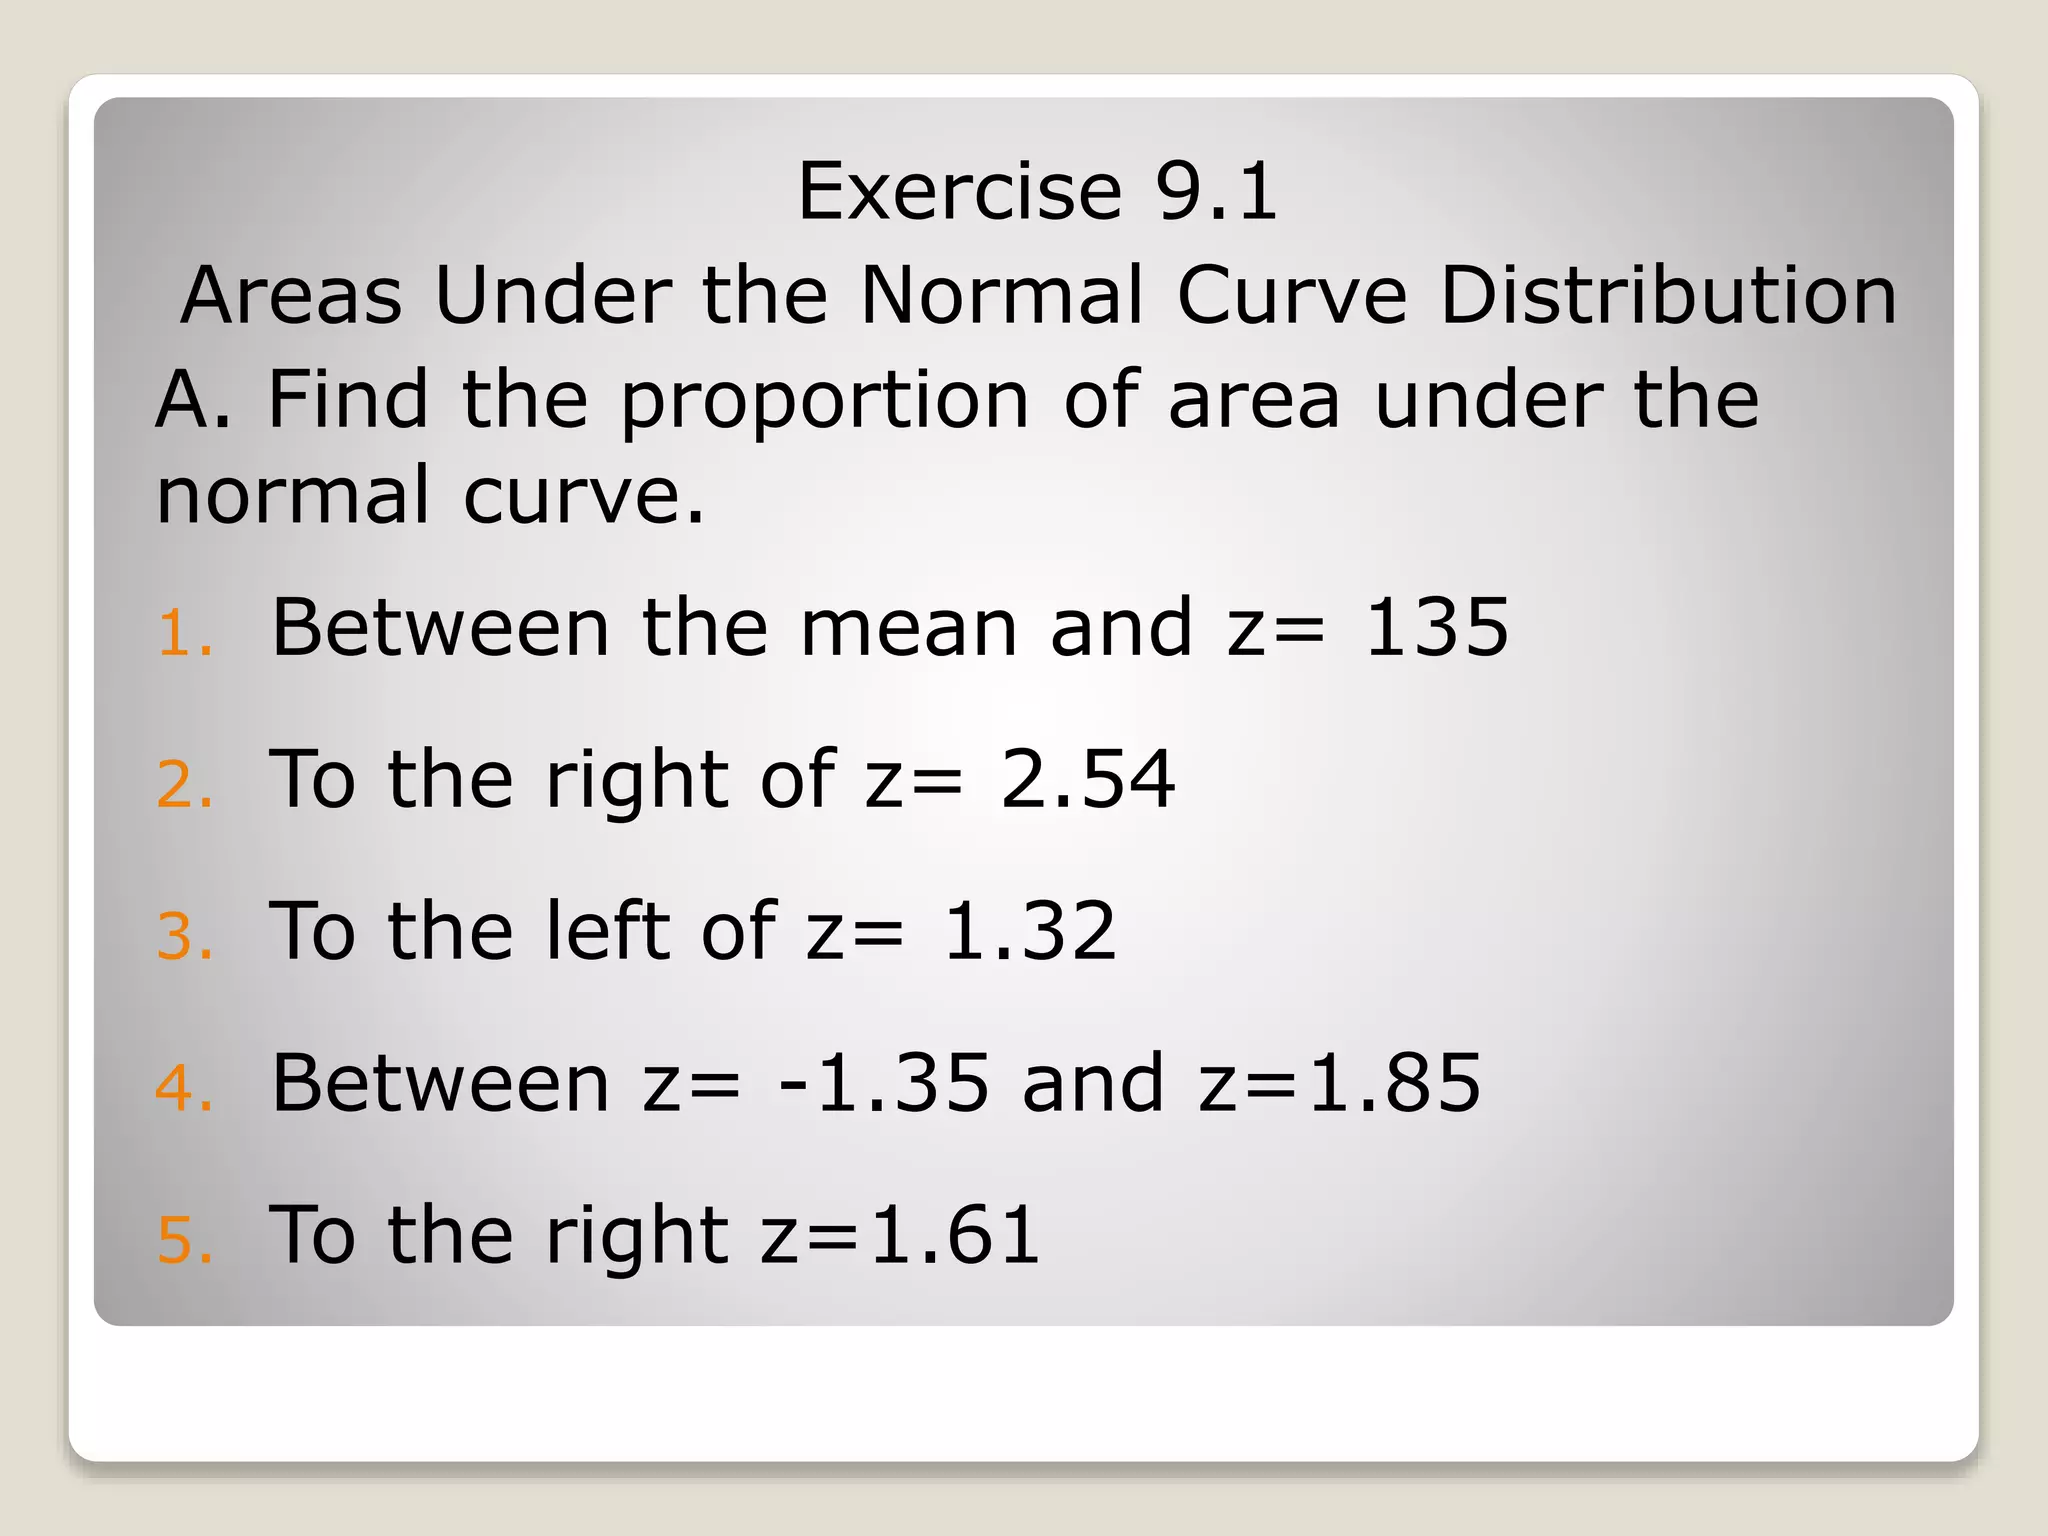

The document discusses the normal distribution curve and how to calculate probabilities and areas under the normal curve. It defines the normal curve, its key properties like symmetry and bell shape, and how it can be used to describe distributions. It then provides examples of how to calculate areas under the normal curve in different situations, such as between two z-scores, in the tails, or between z-scores on opposite sides of the mean. The examples demonstrate how to convert scores to z-scores and look up areas in tables to calculate probabilities.