CLASS RULES
Attendance ismandatory.
You are responsible for whatever is taught in the lecture. If you miss a class, it is your responsibility to
find out about assignment, quizzes and exam.
Punctuality is compulsory.
You are encouraged to collaborate (not copy) on assignment problems with your "study buddies.”
Respect and listen during period
Take notes in lectures
Ask questions
3.
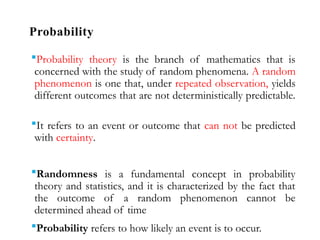
Probability
Probability theory isthe branch of mathematics that is
concerned with the study of random phenomena. A random
phenomenon is one that, under repeated observation, yields
different outcomes that are not deterministically predictable.
It refers to an event or outcome that can not be predicted
with certainty.
Randomness is a fundamental concept in probability
theory and statistics, and it is characterized by the fact that
the outcome of a random phenomenon cannot be
determined ahead of time
Probability refers to how likely an event is to occur.
4.
Continue..
Probability means possibility.It deals with the occurrence of a random
event.
The value is expressed from zero to one.
Probability has been introduced in Mathematics to predict how likely
events are to happen.
The meaning of probability is basically the extent to which something is
likely to happen.
This is the basic probability theory, which is also used in the probability
distribution, where you will learn the possibility of outcomes for a
random experiment.
To find the probability of a single event to occur, first, we should know
the total number of possible outcomes.
5.
Motivations Of study
Anelectrical engineer is likely to deal with "probability" in each of several
areas as follows:
In the analysis of communications systems, one is frequently concerned with
lower signal-to-noise ratios resulting in "bit-errors", false alarms, etc. There is
then a need for careful positioning of thresholds, use of error-correcting
codes, et-cetera to insure that the probability of error is kept within acceptable
bounds.
In the design of circuits and systems, it is often important that the
characteristic of some circuit element like its resistance or inductance has to be
kept within a certain range in order for the circuit to operate properly, so the
probability distribution of this kind of parameter becomes important.
In product development and manufacturing planning, uncertainty as to
product demand and component availability are frequently of concern, and
again, intelligent judgments as to probability are required
In summary, probability and random processes are essential tools for electrical
engineering students to understand the behavior of complex systems and
design them to meet specific performance criteria.
6.
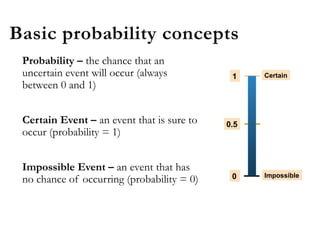
Basic probability concepts
Probability– the chance that an
uncertain event will occur (always
between 0 and 1)
Certain Event – an event that is sure to
occur (probability = 1)
Impossible Event – an event that has
no chance of occurring (probability = 0)
Certain
Impossible
0.5
1
0
7.
probability of occurrence
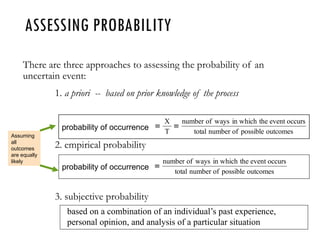
ASSESSINGPROBABILITY
There are three approaches to assessing the probability of an
uncertain event:
1. a priori -- based on prior knowledge of the process
2. empirical probability
3. subjective probability
outcomes
possible
of
number
total
occurs
event
the
in which
ways
of
number
T
X
based on a combination of an individual’s past experience,
personal opinion, and analysis of a particular situation
outcomes
possible
of
number
total
occurs
event
the
in which
ways
of
number
Assuming
all
outcomes
are equally
likely
probability of occurrence
8.
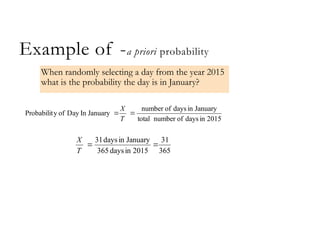
Example of -apriori probability
365
31
2015
in
days
365
January
in
days
31
T
X
When randomly selecting a day from the year 2015
what is the probability the day is in January?
2015
in
days
of
number
total
January
in
days
of
number
January
In
Day
of
y
Probabilit
T
X
9.
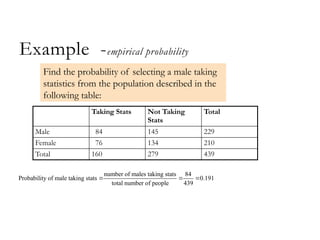
Example -empirical probability
numberof males taking stats 84
0.191
total num
Proba
ber o
bility of mal
f peopl
e taking
e 439
stats
Taking Stats Not Taking
Stats
Total
Male 84 145 229
Female 76 134 210
Total 160 279 439
Find the probability of selecting a male taking
statistics from the population described in the
following table:
10.
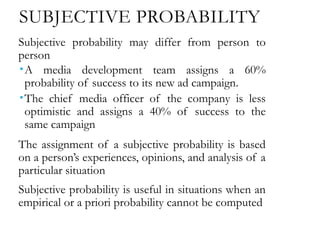
SUBJECTIVE PROBABILITY
Subjective probabilitymay differ from person to
person
A media development team assigns a 60%
probability of success to its new ad campaign.
The chief media officer of the company is less
optimistic and assigns a 40% of success to the
same campaign
The assignment of a subjective probability is based
on a person’s experiences, opinions, and analysis of a
particular situation
Subjective probability is useful in situations when an
empirical or a priori probability cannot be computed
11.
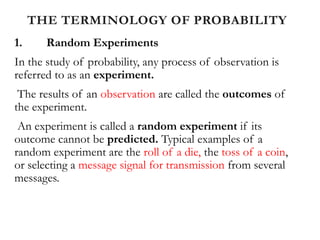
THE TERMINOLOGY OFPROBABILITY
1. Random Experiments
In the study of probability, any process of observation is
referred to as an experiment.
The results of an observation are called the outcomes of
the experiment.
An experiment is called a random experiment if its
outcome cannot be predicted. Typical examples of a
random experiment are the roll of a die, the toss of a coin,
or selecting a message signal for transmission from several
messages.
12.
Examples of theserandom phenomena include the
number of electronic mail (e-mail) messages received by
all employees of a company in one day, the number of
phone calls arriving at the university’s switchboard over
a given period, the number of components of a system
that fail within a given interval, and the number of A’s
that a student can receive in one academic year.
13.
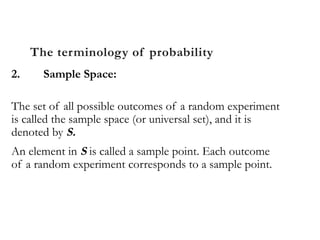
The terminology ofprobability
2. Sample Space:
The set of all possible outcomes of a random experiment
is called the sample space (or universal set), and it is
denoted by S.
An element in S is called a sample point. Each outcome
of a random experiment corresponds to a sample point.
14.
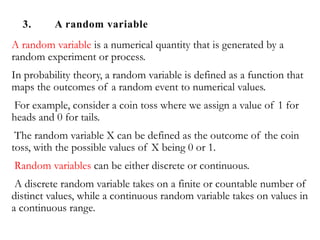
3. A randomvariable
A random variable is a numerical quantity that is generated by a
random experiment or process.
In probability theory, a random variable is defined as a function that
maps the outcomes of a random event to numerical values.
For example, consider a coin toss where we assign a value of 1 for
heads and 0 for tails.
The random variable X can be defined as the outcome of the coin
toss, with the possible values of X being 0 or 1.
Random variables can be either discrete or continuous.
A discrete random variable takes on a finite or countable number of
distinct values, while a continuous random variable takes on values in
a continuous range.
15.
Example 1.1
Find thesample space for the experiment of tossing a
coin
(a) once
(b) twice.
SOLUTION
(a) There are two possible outcomes, heads or tails.
Thus
S = {H, T)
where H and T represent head and tail, respectively.
(b) There are four possible outcomes. They are pairs
of heads and tails. Thus
S = (HH, HT, TH, TT)
16.
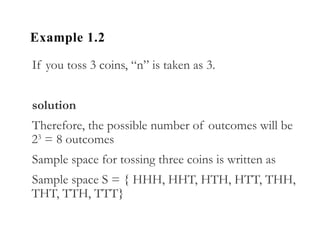
Example 1.2
If youtoss 3 coins, “n” is taken as 3.
solution
Therefore, the possible number of outcomes will be
23
= 8 outcomes
Sample space for tossing three coins is written as
Sample space S = { HHH, HHT, HTH, HTT, THH,
THT, TTH, TTT}
17.
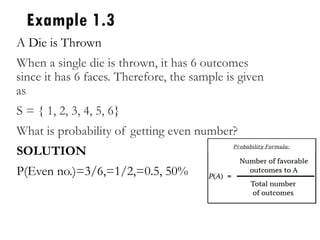
Example 1.3
A Dieis Thrown
When a single die is thrown, it has 6 outcomes
since it has 6 faces. Therefore, the sample is given
as
S = { 1, 2, 3, 4, 5, 6}
What is probability of getting even number?
SOLUTION
P(Even no.)=3/6,=1/2,=0.5, 50%
18.
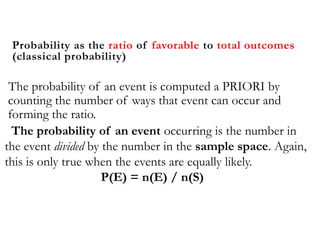
Probability as theratio of favorable to total outcomes
(classical probability)
The probability of an event is computed a PRIORI by
counting the number of ways that event can occur and
forming the ratio.
The probability of an event occurring is the number in
the event divided by the number in the sample space. Again,
this is only true when the events are equally likely.
P(E) = n(E) / n(S)
19.
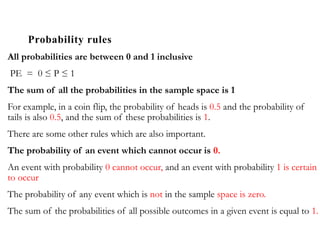
Probability rules
All probabilitiesare between 0 and 1 inclusive
PE = 0 ≤ P ≤ 1
The sum of all the probabilities in the sample space is 1
For example, in a coin flip, the probability of heads is 0.5 and the probability of
tails is also 0.5, and the sum of these probabilities is 1.
There are some other rules which are also important.
The probability of an event which cannot occur is 0.
An event with probability 0 cannot occur, and an event with probability 1 is certain
to occur
The probability of any event which is not in the sample space is zero.
The sum of the probabilities of all possible outcomes in a given event is equal to 1.
20.
Probability rules
The probabilityof an event which must occur is
1.
The probability of an event not occurring is one
minus the probability of it occurring.
P(E') = 1 - P(E)
21.
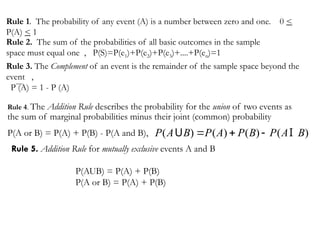
Rule 1. Theprobability of any event (A) is a number between zero and one. 0 <
P(A) < 1
Rule 2. The sum of the probabilities of all basic outcomes in the sample
space must equal one , P(S)=P(e1)+P(e2)+P(e3)+....+P(en)=1
Rule 3. The Complement of an event is the remainder of the sample space beyond the
event ,
P (A) = 1 - P (A)
Rule 4. The Addition Rule describes the probability for the union of two events as
the sum of marginal probabilities minus their joint (common) probability
P(A or B) = P(A) + P(B) - P(A and B),
P(AUB) P(A) P(B) P(AI B)
Rule 5. Addition Rule for mutually exclusive events A and B
P(AUB) = P(A) + P(B)
P(A or B) = P(A) + P(B)
22.
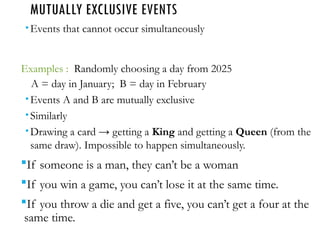
MUTUALLY EXCLUSIVE EVENTS
Eventsthat cannot occur simultaneously
Examples : Randomly choosing a day from 2025
A = day in January; B = day in February
Events A and B are mutually exclusive
Similarly
Drawing a card → getting a King and getting a Queen (from the
same draw). Impossible to happen simultaneously.
If someone is a man, they can’t be a woman
If you win a game, you can’t lose it at the same time.
If you throw a die and get a five, you can’t get a four at the
same time.
23.
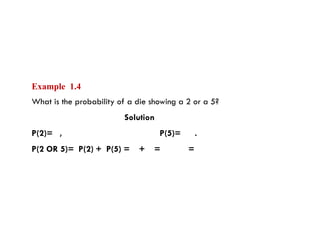
Example 1.4
What isthe probability of a die showing a 2 or a 5?
Solution
P(2)= , P(5)= .
P(2 OR 5)= P(2) + P(5) = + = =
24.
MUTUALLY INCLUSIVE EVENTS
Definition:
Twoevents are said to be mutually inclusive if it is possible for both
events to occur at the same time. In probability terms,
25.
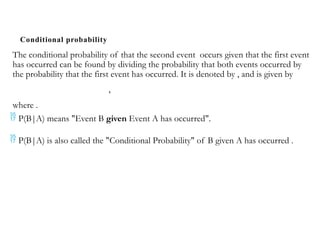
Conditional probability
The conditionalprobability of that the second event occurs given that the first event
has occurred can be found by dividing the probability that both events occurred by
the probability that the first event has occurred. It is denoted by , and is given by
,
where .
P(B|A) means "Event B given Event A has occurred".
P(B|A) is also called the "Conditional Probability" of B given A has occurred .
26.
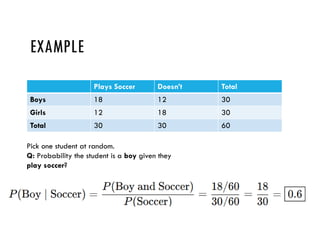
EXAMPLE
Plays Soccer Doesn’tTotal
Boys 18 12 30
Girls 12 18 30
Total 30 30 60
Pick one student at random.
Q: Probability the student is a boy given they
play soccer?
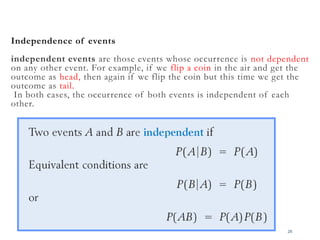
Independence of events
independentevents are those events whose occurrence is not dependent
on any other event. For example, if we flip a coin in the air and get the
outcome as head, then again if we flip the coin but this time we get the
outcome as tail.
In both cases, the occurrence of both events is independent of each
other.
28
29.
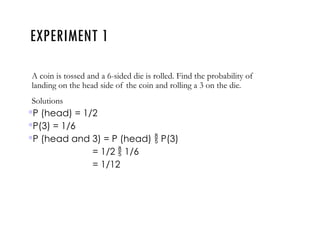
EXPERIMENT 1
A coinis tossed and a 6-sided die is rolled. Find the probability of
landing on the head side of the coin and rolling a 3 on the die.
Solutions
P (head) = 1/2
P(3) = 1/6
P (head and 3) = P (head) P(3)
= 1/2 1/6
= 1/12
30.
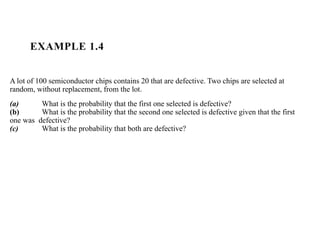
EXAMPLE 1.4
A lotof 100 semiconductor chips contains 20 that are defective. Two chips are selected at
random, without replacement, from the lot.
(a) What is the probability that the first one selected is defective?
(b) What is the probability that the second one selected is defective given that the first
one was defective?
(c) What is the probability that both are defective?
31.
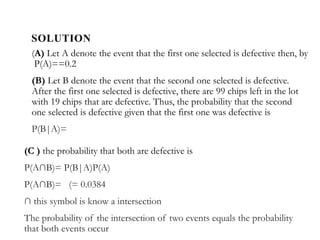
SOLUTION
(A) Let Adenote the event that the first one selected is defective then, by
P(A)==0.2
(B) Let B denote the event that the second one selected is defective.
After the first one selected is defective, there are 99 chips left in the lot
with 19 chips that are defective. Thus, the probability that the second
one selected is defective given that the first one was defective is
P(B|A)=
(C ) the probability that both are defective is
P(A∩B)= P(B|A)P(A)
P(A∩B)= (= 0.0384
∩ this symbol is know a intersection
The probability of the intersection of two events equals the probability
that both events occur
32.
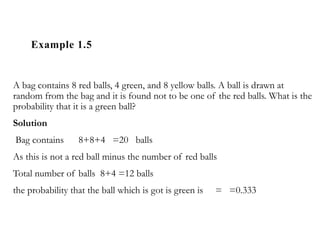
Example 1.5
A bagcontains 8 red balls, 4 green, and 8 yellow balls. A ball is drawn at
random from the bag and it is found not to be one of the red balls. What is the
probability that it is a green ball?
Solution
Bag contains 8+8+4 =20 balls
As this is not a red ball minus the number of red balls
Total number of balls 8+4 =12 balls
the probability that the ball which is got is green is = =0.333
33.
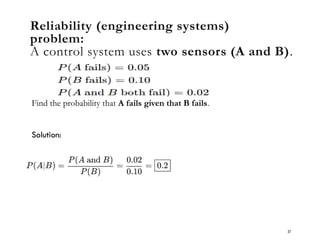
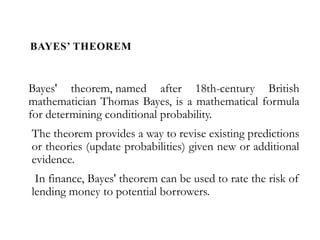
BAYES’ THEOREM
Bayes' theorem,named after 18th-century British
mathematician Thomas Bayes, is a mathematical formula
for determining conditional probability.
The theorem provides a way to revise existing predictions
or theories (update probabilities) given new or additional
evidence.
In finance, Bayes' theorem can be used to rate the risk of
lending money to potential borrowers.
34.
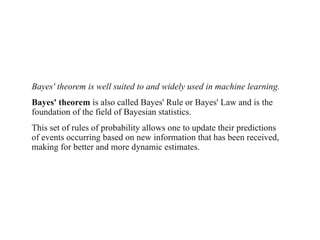
Bayes' theorem iswell suited to and widely used in machine learning.
Bayes' theorem is also called Bayes' Rule or Bayes' Law and is the
foundation of the field of Bayesian statistics.
This set of rules of probability allows one to update their predictions
of events occurring based on new information that has been received,
making for better and more dynamic estimates.
35.
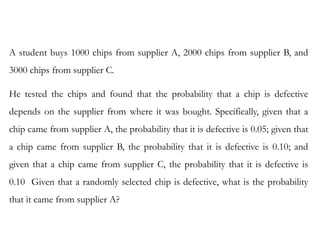
E X AM P L E 1 . 6
A student buys 1000 chips from supplier A, 2000 chips from supplier B, and
3000 chips from supplier C.
He tested the chips and found that the probability that a chip is defective
depends on the supplier from where it was bought. Specifically, given that a
chip came from supplier A, the probability that it is defective is 0.05; given that
a chip came from supplier B, the probability that it is defective is 0.10; and
given that a chip came from supplier C, the probability that it is defective is
0.10 Given that a randomly selected chip is defective, what is the probability
that it came from supplier A?
36.
EXAMPLE 1.6
SOLUTION
the probabilitythat the randomly selected chip came
from supplier A, given that it is defective, is given by
P(D/A)=0.05, P(A)==
P(D/B) =0.10 , P(B)= =
P(D/C) = 0.10, P(C)= =
P[A|D]= =
P[A|D]= =0.0909 , =9.09%
37.
ACTIVITY
In example 1.6given that a randomly selected chip is defective, what is the probability
that it came from supplier C?
38.
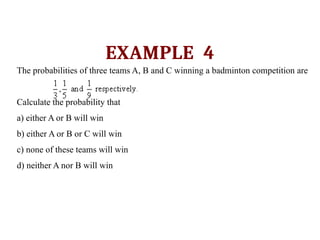
EXAMPLE 4
The probabilitiesof three teams A, B and C winning a badminton competition are
Calculate the probability that
a) either A or B will win
b) either A or B or C will win
c) none of these teams will win
d) neither A nor B will win
39.
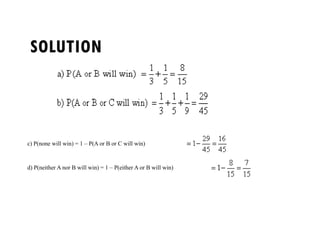
SOLUTION
c) P(none willwin) = 1 – P(A or B or C will win)
d) P(neither A nor B will win) = 1 – P(either A or B will win)
40.
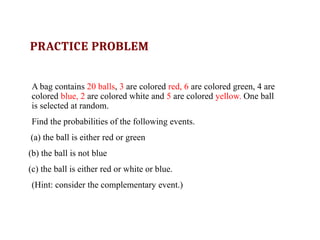
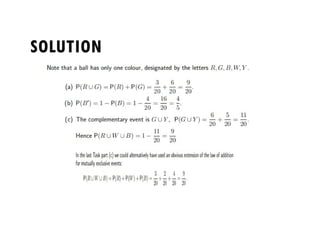
PRACTICE PROBLEM
A bagcontains 20 balls, 3 are colored red, 6 are colored green, 4 are
colored blue, 2 are colored white and 5 are colored yellow. One ball
is selected at random.
Find the probabilities of the following events.
(a) the ball is either red or green
(b) the ball is not blue
(c) the ball is either red or white or blue.
(Hint: consider the complementary event.)
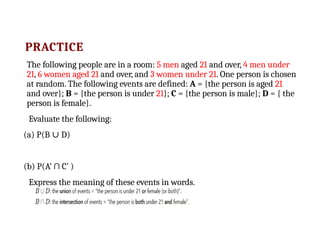
PRACTICE
The following peopleare in a room: 5 men aged 21 and over, 4 men under
21, 6 women aged 21 and over, and 3 women under 21. One person is chosen
at random. The following events are defined: A = {the person is aged 21
and over}; B = {the person is under 21}; C = {the person is male}; D = { the
person is female}.
Evaluate the following:
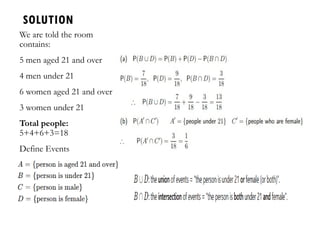
(a) P(B D)
∪
(b) P(A’ ∩ C’ )
Express the meaning of these events in words.
43.
SOLUTION
We are toldthe room
contains:
5 men aged 21 and over
4 men under 21
6 women aged 21 and over
3 women under 21
Total people:
5+4+6+3=18
Define Events
44.
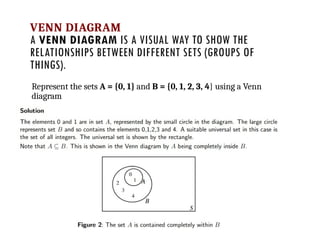
VENN DIAGRAM
A VENNDIAGRAM IS A VISUAL WAY TO SHOW THE
RELATIONSHIPS BETWEEN DIFFERENT SETS (GROUPS OF
THINGS).
Represent the sets A = {0, 1} and B = {0, 1, 2, 3, 4} using a Venn
diagram
45.
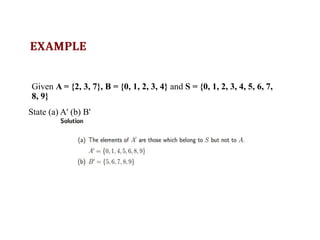
EXAMPLE
Given A ={2, 3, 7}, B = {0, 1, 2, 3, 4} and S = {0, 1, 2, 3, 4, 5, 6, 7,
8, 9}
State (a) A' (b) B'
46.
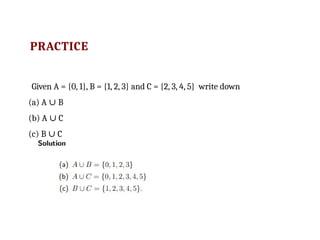
PRACTICE
Given A ={0, 1}, B = {1, 2, 3} and C = {2, 3, 4, 5} write down
(a) A B
∪
(b) A C
∪
(c) B C
∪
47.
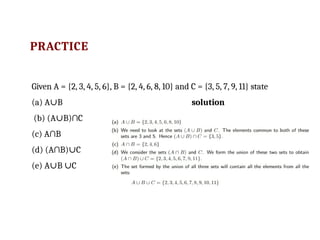
PRACTICE
Given A ={2, 3, 4, 5, 6}, B = {2, 4, 6, 8, 10} and C = {3, 5, 7, 9, 11} state
(a) A B
∪ solution
(b) (A B)∩C
∪
(c) A∩B
(d) (A∩B) C
∪
(e) A B C
∪ ∪
48.
THREE DIAGRAM
A treediagram represents the hierarchy of the events that need to be completed when
solving a problem. The tree diagram starts with one node, and each node has its branches
that further extend into more branches, and a tree-like structure is formed.
In mathematics, tree diagrams make it easy to visualize and solve probability problems.
They are a significant tool in breaking the problem down in a schematic way. While tree
diagrams can convert many complicated problems into simple ones, they are not very
useful when the sample space becomes too large.
Tree diagram definition:
A probability tree diagram represents all the possible outcomes of an event in an
organized manner. It starts with a dot and extends into branches. The probability of each
outcome is written on its branch.
How to make a tree diagram
49.
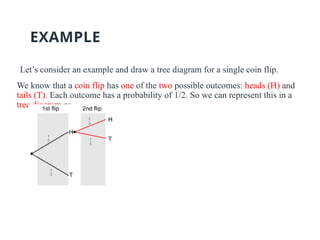
EXAMPLE
Let’s consider anexample and draw a tree diagram for a single coin flip.
We know that a coin flip has one of the two possible outcomes: heads (H) and
tails (T). Each outcome has a probability of 1/2. So we can represent this in a
tree diagram as
50.
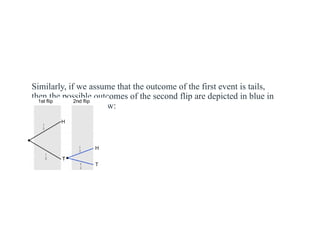
Similarly, if weassume that the outcome of the first event is tails,
then the possible outcomes of the second flip are depicted in blue in
the tree diagram below:
51.
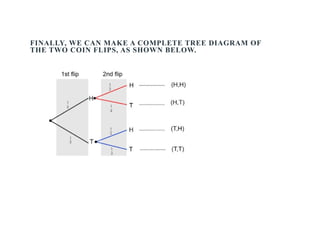
FINALLY, WE CANMAKE A COMPLETE TREE DIAGRAM OF
THE TWO COIN FLIPS, AS SHOWN BELOW.
52.
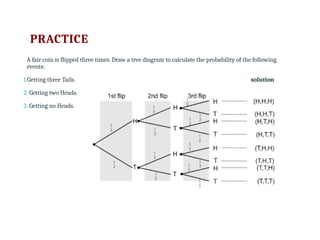
PRACTICE
A fair coinis flipped three times. Draw a tree diagram to calculate the probability of the following
events:
1.Getting three Tails. solution
2. Getting two Heads.
3. Getting no Heads.
53.
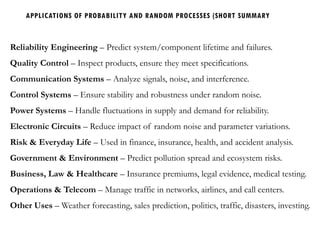
APPLICATIONS OF PROBABILITYAND RANDOM PROCESSES (SHORT SUMMARY
Reliability Engineering – Predict system/component lifetime and failures.
Quality Control – Inspect products, ensure they meet specifications.
Communication Systems – Analyze signals, noise, and interference.
Control Systems – Ensure stability and robustness under random noise.
Power Systems – Handle fluctuations in supply and demand for reliability.
Electronic Circuits – Reduce impact of random noise and parameter variations.
Risk & Everyday Life – Used in finance, insurance, health, and accident analysis.
Government & Environment – Predict pollution spread and ecosystem risks.
Business, Law & Healthcare – Insurance premiums, legal evidence, medical testing.
Operations & Telecom – Manage traffic in networks, airlines, and call centers.
Other Uses – Weather forecasting, sales prediction, politics, traffic, disasters, investing.


![EXAMPLE 1.6
SOLUTION
the probability that the randomly selected chip came
from supplier A, given that it is defective, is given by
P(D/A)=0.05, P(A)==
P(D/B) =0.10 , P(B)= =
P(D/C) = 0.10, P(C)= =
P[A|D]= =
P[A|D]= =0.0909 , =9.09%](https://image.slidesharecdn.com/chapter1-251207085045-9ddf1c71/85/chapter-1-36-320.jpg)