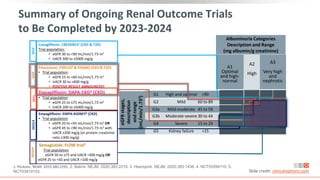
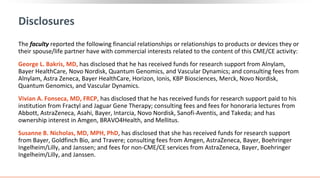
This virtual webinar discusses chronic kidney disease in type 2 diabetes and contemporary approaches to renoprotection. It features three expert nephrologists and endocrinologists who will provide an overview of diabetic kidney disease, discuss its pathogenesis, and review current treatment approaches. The webinar is supported by an educational grant from Bayer HealthCare Pharmaceuticals and is intended for physicians to earn continuing medical education credits.


![Prevalence of CKD in the US Population by eGFR and
Albuminuria Stages
Percentage of US population by eGFR and albuminuria
category (KDIGO 2009 and NHANES III [1988-1994])
Combined stages G3-G5 and A2-A3 account for 13.9% of
the population
Stages G3-G5 and A2-A3 account for 6.7% and 9.1% of
the population, respectively
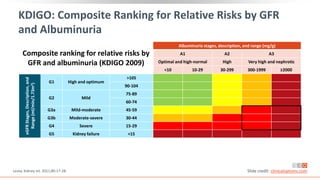
Albuminuria Stages, Description, and Range (mg/g) [by UACR]
A1 A2 A3
All
Optimal and high-optimal High Very high
<10 10-29 30-299 >300
eGFR
Stages,
Description,
and
Range
(mL/min/1.73
m
2
)
G1 High and optimum
>105 23.6 5.7 1.9 0.1 31.4
90-104 20 4.7 1.7 0.3 26.7
G2 Mild
75-89 17.3 4.1 1.6 0.2 23
60-74 8.2 2.7 1.3 0.1 12.2
G3a Mild to moderate 45-59 2.5 1.1 0.8 0.2 4.7
G3b Moderate to severe 30-44 0.6 0.4 0.4 0.2 1.5
G4 Severe 15-29 0.1 0.1 0.1 0.1 0.4
G5 ESRD <15 0 0 0 0.1 0.1
All 72.2 18.8 7.8 1.3 100
Levey. Lancet. 2012;379:165. Slide credit: clinicaloptions.com](https://image.slidesharecdn.com/ccocldint2ddownloadable1-230716124508-d5dbd794/85/CCO_CLD_in_T2D_Downloadable_1-pptx-11-320.jpg)