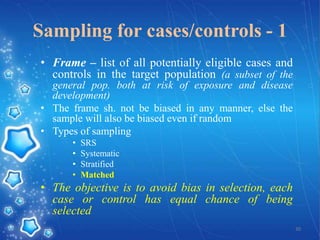
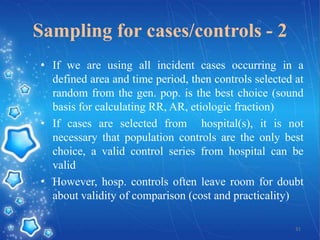
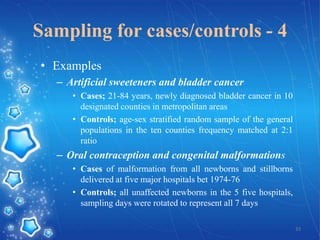
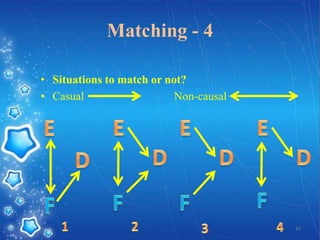
Downloaded 155 times


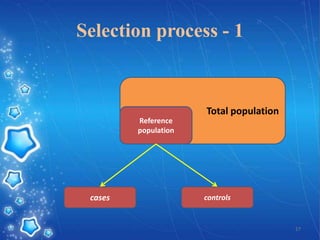

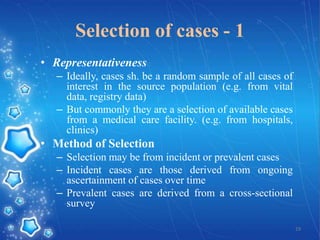
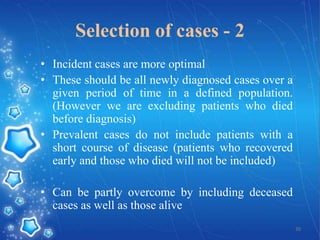


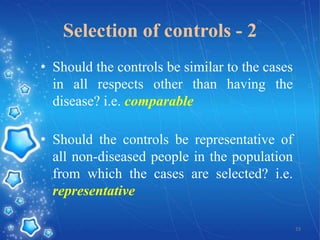
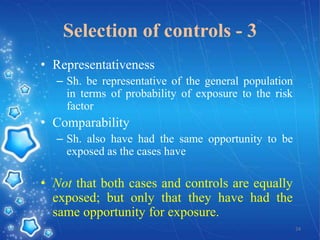

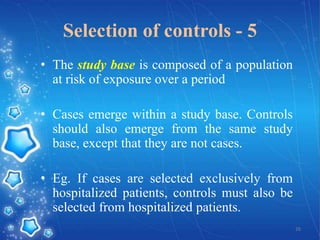

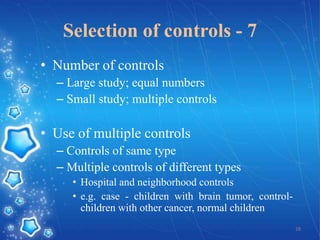
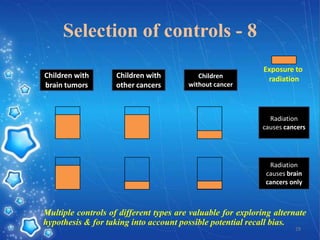


- The document provides an overview of planning and conducting a case control study to investigate the potential association between DPT vaccination and neurological illness. - It discusses defining cases and controls, selecting cases and controls, matching cases and controls, sources of bias, and applications of case control studies. Key points covered include selecting incident cases, defining eligibility criteria for both cases and controls, choosing appropriate control groups, sampling methods, and when and how to perform matching to reduce bias. - The goal of the study would be to test whether neurological illness occurs more frequently in children who received the DPT vaccine compared to children who did not, in order to help inform vaccination practices and alleviate parents' and doctors' concerns following isolated reports


