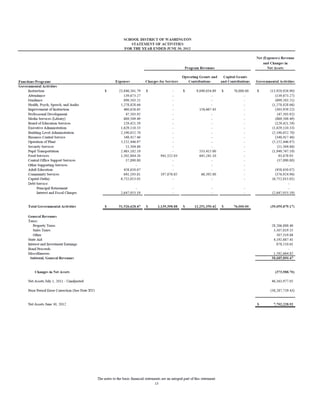
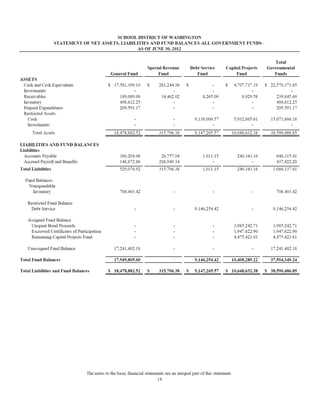
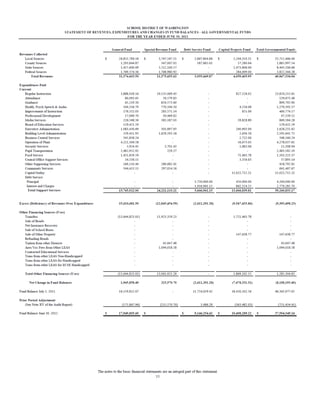
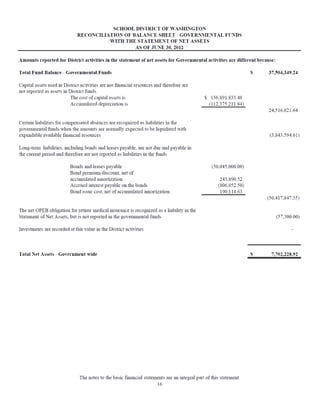
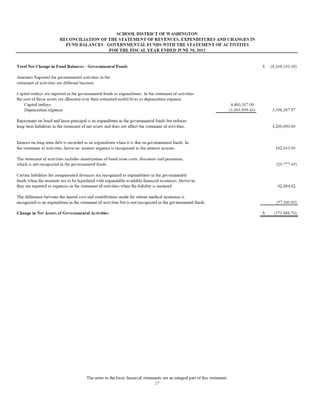
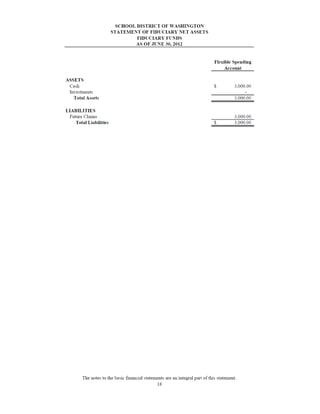
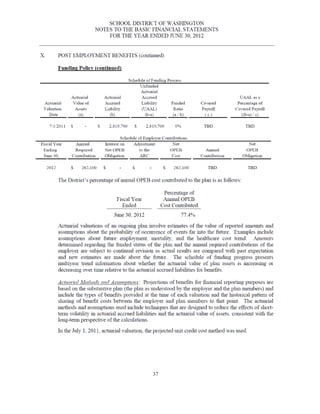
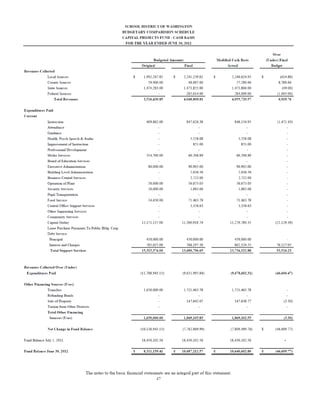
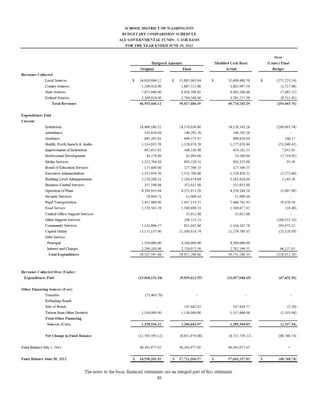
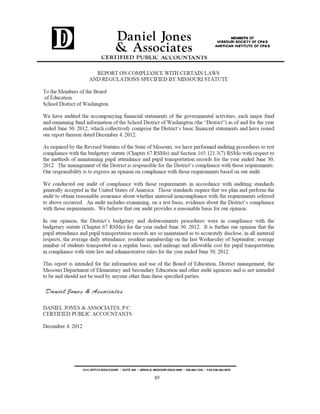
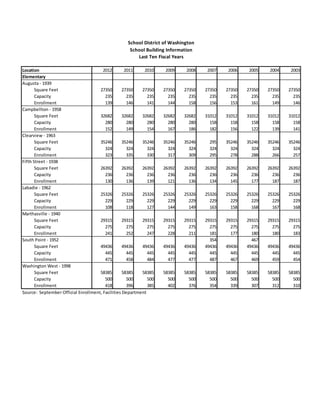
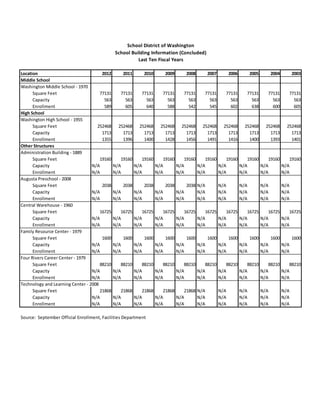
The School District of Washington
Washington, Missouri
www.washington.k12.mo.us
2012
For fiscal year ending June 30, 2012
COMMITTED TO QUALITY EDUCATION WITH WORLD-CLASS RESULTS!
THE SCHOOL DISTRICT OF WASHINGTON
Washington, Missouri
Comprehensive Annual Financial Report
For the year ended June 30, 2012
Ms. Shelley Kinder, Chief Financial Officer
http://www.washington.k12.mo.us
Comprehensive
Annual
Financial
Report
2012
IntroductorySeciton
Introductory section
School District of Washington
220 Locust Street
Washington, MO 63090
636-231-2000 ~ 636-239-3315 FAX
Dr. Judy Straatmann, Assistant Superintendent ~ Dr. Brendan Mahon, Assistant Superintendent ~ Shelley Kinder, CFO
December 31, 2012
Members of the Board of Education and
Residents of the School District of Washington
We are pleased to submit to you the Comprehensive Annual Financial Report (CAFR) of the School District of Washington (District)
for the fiscal year ended, June 30, 2012. This report provides full disclosure of the District’s financial operation. This CAFR, which
includes an opinion from the Independent Auditors who conducted the District’s audit, conforms to the Generally Accepted
Accounting Principles in the United States of America (GAAP) as applicable to governmental entities. The District maintains full
responsibility for the accuracy of the data and the completeness and fairness of the presentation, including all disclosures.
We believe that all data, as presented, is accurate in all material respects and that it is presented in a manner to fairly set forth the
financial position and results of the District’s operations as measured by the financial activity of its various funds. We further
believe that all disclosures necessary to enable the reader to gain the maximum understanding of the District’s financial activities
have been included.
The Comprehensive Annual Financial Report is presented in three sections as follows:
1. The Introductory Section, which includes a Table of Contents, Letter of Transmittal, listing of elected Board of Educa-
tion members, listing of administrative officials and an organizational chart of the District.
2. The Financial Section, which begins with the Independent Auditor’s Report and includes the Management’s Discus-
sion and Analysis, the Basic Financial Statements and Notes to Financial Statements.
3. The Statistical Section, which includes selected comparative financial, non-financial, demographic and
economic data for the District.
Profile of the District
The School District of Washington has provided education services to the students in the Franklin County area since its
incorporation as a public entity in 1889. Through mergers, it has become one of the largest geographical school districts in
Missouri with the reorganization and addition of area in both Warren and St. Charles counties. Population growth in the District
has remained constant with increases from year to year. Enrollment projections indicate the student population during the next
five years will continue at a steady increase of approximately 1% each year. The District currently provides education to
approximately 4,100 students Kindergarten through grade 12, with an additional 150 students in its early childhood education
programs.
The District encompasses approximately 257 square miles in Franklin County, southern St. Charles County and eastern Warren
County. The cities within the District’s boundaries are Augusta, Labadie, Marthasville, New Haven, Union, and Washington. The
District operates as fiscally independent of the State of Missouri or any other jurisdiction in the county or local township in which it
resides.
The District’s educational facilities include eight elementaries, one middle school and one high school. The District also provides a
Dr. Lori VanLeer,
Superintendent
Scott Byrne,
Board President
Vocational Career Center that supports high school students from the Washington School District and seven other surrounding
school districts. The District has one operational support building, an administration building, a Family Resource Center for special
education services, and a Technology and Learning Center which houses the Technology Department and Parents As Teachers
Program.
The District employs approximately 620 staff members to assist in the student learning process. Personnel costs, including salaries
and benefits, account for 73.45% of the District’s total operating expenditures. The student to teacher ratio is 19:1 for the District
as a whole, 17:4 for elementary schools, 19:1 for middle school and 23:1 for high school.
The District contracts with First Student, Inc. to provide transportation to and from school to eligible students and on school
sponsored activity trips. Approximately 2,300 students are transported on a daily basis. Forty two school buses are used in the
transportation program with most buses serving multiple routes.
Washington’s Investment in Great Schools Foundation (WINGS) provides annual program grants to the District teachers from funds
raised through its own fundraising efforts. The Foundation is a legally separate entity.
The District is governed by the Board of Education, whose membership is elected for staggered three-year terms of office. The
Board is a policy-making body whose primary function is to establish policies for the District, provide for the general operation and
personnel of the District and to safeguard the assets of the District. It is the responsibility of the District to make public education
available to residents of the School District of Washington. The District is an independent entity and receives its funding from local,
state, and federal government sources and must comply with the requirements of these funding agencies.
The District provides a wide range of public educational services at all grade levels ranging from kindergarten through grade
twelve. In addition to a great regular academic curriculum, the District offers a broad range of other programs for students
including gifted/talented, English as a second language, fine arts, advanced college placement, interscholastic and intramural
athletics, assistance for at-risk students and others. In addition, the District provides services beyond the broad K-12. The District
provides Early Childhood services, including regular preschool, which serves children before they attend Kindergarten. The District
also provides a Career Center which serves seven surrounding districts and provides adult continuing education. Some of the
services provided to our students include instructional staff, instructional materials, instructional facilities, administrative and
business service support, food service, bus transportation services and facility maintenance.
The District is committed to developing, maintaining, and improving effective management systems and controls. The District
makes conscientious efforts to employ high qualified employees through active recruitment and thorough evaluations. Further,
operations are continually evaluated to assure they function effectively and provide appropriate levels of supervision and
segregation of duties.
Local Economy
Washington is situated along the Missouri River and is located 55 miles west of St. Louis. Highway 100 and Highway 47 are the two
state highways leading into Washington. Construction converting Missouri State Highway 100 to four lanes from I-44 to
Washington began in 2008 and was completed in 2010. Amtrak and Union Pacific Railroads also serve the town. The Washington
Memorial Airport is located in Warren County. The airport is home base for 36 airplanes.
With more than 300 retail stores, it is the largest shopping community between St. Louis and Jefferson City. Phoenix Center II
Community Improvement District was established in 2006. Anchor stores for the District are Target and Kohls.
Over 60 industries are located in Washington, employing an estimated 7,000 people. Washington has a growing visitor industry,
attracted by the boat access to the Missouri River, historical buildings, and wineries located in the general area.
There are four radio stations, two local television stations and a twice-weekly newspaper. In addition, the cable television
company carries a local channel broadcast from East Central College. Additional radio and television services are available from
the St. Louis area.
There are currently seven banks with combined assets of approximately $1.4 billion.
Mercy Hospital has been serving the area since 1926. Part of the Sisters of Mercy Health System, the 187 bed non-profit facility is a
Level III Trauma Center that has received numerous state and national honors over the years.
Long-Term Financial Planning
The Board of Education adopted a series of policies that provide direction regarding the District’s budget and financial affairs that
reflect the educational philosophy of the District, and provide a framework in which the District’s administration can effectively
operate. The purpose of the District’s budget and finance policies is to provide direction for a systematic process that maintains
continuity from year to year and inform the public regarding the education and financial operations of the District.
In 2010, the District formed two focus groups. Focus Group 1 centered on literacy, 21st
century learning environments, appropriate
interventions for all learners, and professional learning for our teachers and leaders who serve our students. Focus Group 2
focused on the strategic short and long term goals for facilities. New for the FY 2012-13 school year is Focus Group 3, with a focus
on improving student achievement in the age of advanced technology. These committees either directly or indirectly impact the
future financial planning and growth of the District.
The District adopted a Fund Balance policy in accordance with GASB 54. The primary objective of the Fund Balance policy is to
protect against revenue shortfalls or unexpected expenditures. The policy states the District will maintain a reserve of 22-27% in
the Operating Fund. If the fund balance falls below the minimum of 22%, the board will put a plan in place to replenish the fund
balance within two years. As of June 30, 2012, the fund balance in the Operating Fund was 44%, well above the board’s target.
In addition, the District has continued to maintain and update facilities and equipment by going to the voters for authorization to
issue general obligation bonds or by issuing lease purchase agreements for financing as needed. The District currently has a
five-year capital improvement plan built within its 2012-2013 budget.
Accounting System and Budgetary Control
The District’s accounting system for governmental funds reflects the modified accrual basis of accounting. At the end of the year,
the governmental funds are converted from modified accrual basis to the accrual basis for presentation in district-wide financial
statements. The District utilizes a fully automated accounting system as well as an automated system of control for fixed assets
and payroll. This system provides a complete set of self-balancing accounts for each District fund. The chart of accounts used in
this accounting system was developed in accordance with the Missouri Financial Accounting Manual prepared by the Department
of Elementary and Secondary Education, School Finance Section, State of Missouri.
In developing the District’s accounting system, much consideration was given to the adequacy of internal accounting controls.
Internal accounting controls are designed to provide reasonable but not absolute assurance regarding the safeguarding of assets
against loss from unauthorized use of disposition and the reliability of financial records for preparing financial statements and
maintaining accountability for assets. The concept of reasonable assurance recognizes that the cost of these controls should not
exceed the benefit and the evaluation of costs and benefits requires estimate and judgments by management.
The District believes the internal accounting controls adequately safeguard assets and provide reasonable assurance of proper
recording of financial transactions.
The District’s accounting system is organized on the basis of funds, each of which is considered its own entity. The District
considers four funds (General, Special Revenue-Teachers’, Debt Service and Capital Projects) as major.
The school budget is an instrument which provides a definite financial policy for the direction of business operations of the District
as per policy DB. It provides an outline of the probable expenditures and the anticipated receipts during a specified period of time.
The budget is one of the most important legal documents of a school district. It is not a static document but rather a working
document that changes. The fiscal year for the budget is defined as beginning annually on the first day of July and ending on the
thirtieth day of June as set by board policy DBB.
In accordance with Chapter 67 RSMo, each year, the Superintendent of Schools is required to submit to the Board of Education for
its consideration a detailed annual budget showing estimates of income and expenditures for the ensuing fiscal year. The Board
may accept, reject, modify, or request revisions of the budget, but will adopt a budget by June 30, according to statutory
provisions.
By law the approved estimated expenditures for each fund cannot exceed the estimated revenues to be received plus the
unencumbered beginning cash balance for the fund. After the beginning of the fiscal year, the Superintendent reviews with the
Board the adopted budget in relationship to the beginning cash balances for each fund. Monthly financial statements are prepared
and distributed to the Board for their approval.
Risk Management
The objective of the Risk Management program is to safeguard the assets of the District, minimize the financial effect of potential
losses, and to provide a reasonable level of employee benefits at an affordable funding level. Through these processes, Risk
Management will strive to provide a safe and orderly learning environment for students, employees and patrons. The District
obtains its insurance coverage through the Missouri United School Insurance Council (MUSIC) which is a protected self-insurance
program made up of 400 Missouri public schools. The District pays an annual assessment to be a member of the risk-sharing
group.
Various types of insurance coverage are made available to the employees. The employee portion of medical, vision, long term
disability and life are paid by the District. Other coverage is available to the employees at a cost to the employee, such as family
medical, voluntary life, dental, family vision, short term disability, Section 125 flexible spending accounts for qualified medical and
dependent care expenses.
Independent Audit
The revised statutes of the State of Missouri require that an independent audit be conducted on a biennial basis. The District
policy, however, requires that an independent certified public accounting firm conduct an audit annually. This requirement has
been satisfied and the opinion of Daniel Jones, CPA, is included in this report.
The School Board is also required to undergo an annual single audit in conformity with the provisions of Single Audit Act
Amendments of 1996 and US Office of Management and Budget (OMB) Circular A-133, Audits of State, Local Governments, and
Non-Profit Organizations. Information related to this single audit, including the schedule of expenditures of federal awards, law
and regulations is included in a separate single audit report and is available at the School District’s Administrative Office for
inspection.
Management’s Discussion and Analysis
As part of this reporting model, management is responsible for providing a narrative introduction and analysis to accompany the
basic financial statements. This can be found in the Management Discussion and Analysis (MD&A) section of this report. The
MD&A can be found immediately following the report of the independent auditors in the Financial Section.
Awards and Acknowledgements
For the past three years, the District has received the Association of School Business Officials (ASBO) International Meritorious
Budget Award (MBA), the prestigious award for excellence in budgeting. This will be the District’s first time applying for the Asso-
ciation of School Business Officials International Certificate of Excellence in Financial Reporting for the year ended June 30, 2012.
It is our intention this Comprehensive Annual Financial Report will provide the District’s management, outside investors, and inter-
ested local citizens with the most meaningful financial presentation possible. We are hopeful that all readers of the report will
obtain a clear and concise picture of the District’s financial condition as of June 30, 2012.
We want to express our appreciation to all staff members, in particular those in Business Services, who assisted and contributed to
the preparation of this report. We would also like to thank the members of the Board of Education and the Board Finance Commit-
tee for their interest and support in planning and conducting the financial operations of the District in a responsible and progres-
sive manner.
Respectfully submitted,
Dr. Lori Van Leer Shelley Kinder
Superintendent Chief Financial Officer
The School District of Washington
Board of Education 2012-2013
Mr. Scott Byrne Mr. Dan Contarini Mrs. Jennifer Triplett
Mr. Rick Rehmeier Dr. Brian Sumner
Mr. Todd Geisert Mr. Kevin Blackburn
Dr. Lori VanLeer
Dr. Judy Straatmann
Assistant Superintendent
Dr. Brendan Mahon
Assistant Superintendent
Shelley Kinder
Chief Financial Officer
Superintendent’s Cabinet
Dr, Rachael Franssen
Director of Student Services
Comprehensive
Annual
Financial
Report
2012
FinancialSection
Financial section
INDEPENDENT AuDITor’s rEPorT
Basic financial statements
Required supplemental
information
Supplementary information
Comprehensive
Annual
Financial
Report
2012
StateComplianceSection
State compliance section
Comprehensive
Annual
Financial
Report
2012
FederalComplianceSection
Federal compliance section
Comprehensive
Annual
Financial
Report
2012
StatisticalSection
Statistical section
SCHOOL DISTRICT OF WASHINGTON
SUMMARY OF STATISTICAL INFORMATION
JUNE 30, 2012
This part of the District’s comprehensive annual financial report presents detailed information as a
context for understanding what the information in the financial statements, notes disclosures and
required supplementary information says about the District’s overall financial positions.
Contents Page
 Continuing Disclosure Information
These schedules are required as part of the District’s
ongoing general obligation bonded debt disclosures
and give additional information to investors about the
financial position of the District
 Financial Trends
These schedules contain trend information to help the
reader understand how the District’s financial performance
and position have changed over time.
 Revenue Capacity
These schedules contain information to help the reader
assess the District’s most significant local revenue source –
the property tax.
 Debt Capacity
These schedules present information to help the reader
assess the affordability of the District’s current levels of
outstanding debt and the District’s ability to issue additional
debt in the future.
 Demographic and Economic Information
These schedules offer demographic and economic indicators
to help the reader understand the environment within which
the District’s financial activities take place.
 Operating Information
These schedules contain service and infrastructure date to help
the reader understand how the information in the District’s
financial report relates to the services the District provides
and the activities it performs.
20122011201020092008
InvestedinCapitalAssets,netofrelateddebt(25,528,378.36)$4,829,665.00$4,246,816.00$4,430,983.00$
Restricted19,554,543.64$28,349,060.00$9,533,910.00$8,694,429.00$8,873,977.00$
Unrestricted13,676,063.64$18,014,917.00$13,938,074.00$12,209,776.00$11,176,881.00$
7,702,228.92$46,363,977.00$28,301,649.00$25,151,021.00$24,481,841.00$
20072006200520042003
InvestedinCapitalAssets,netofrelateddebt1,199,481.00$2,253,408.00$4,473,650.00$10,066,552.00$
Restricted10,823,649.00$3,279,905.00$2,247,158.00$2,221,426.00$2,057,914.00$
Unrestricted9,766,321.00$7,838,434.00$7,679,619.00$5,804,989.00$7,924,945.00$
21,789,451.00$13,371,747.00$14,400,427.00$18,092,967.00$9,982,859.00$
Source:SchoolDistrictofWashingtonrecords
Note:2011-2012isthefirstofaccrual,thusthefirstyearCapitalAssetsrequiredtobereported
NetAssets
TotalNetAssets
SchoolDistrictofWashington
NETASSETSBYCOMPONENT
LASTTENFISCALYEARS
NetAssets
TotalNetAssets
2012201120102009200820072006200520042003
Expenses
GovernmentalActivities:
TotalInstruction23,846,562$23,374,795$22,653,732$23,177,851$22,060,930$19,754,381$19,805,177$16,454,469$16,726,979$16,062,999$
SupportServices
Attendance139,673$104,208$139,905$179,360$100,094$81,967$63,201$76,335$70,488$80,061$
Guidance899,504$793,033$786,806$782,800$648,541$620,278$658,315$512,978$544,296$512,664$
Health,Psych,SpeechandAudio1,278,829$1,153,972$1,180,038$663,088$623,929$562,642$521,740$586,598$537,959$501,016$
ImprovementofInstruction460,627$506,006$491,341$411,678$176,552$232,352$237,773$294,326$286,363$349,543$
ProfessionalDevelopment47,504$71,197$54,121$67,592$110,060$40,324$55,341$27,960$40,253$40,667$
MediaServices(Library)869,509$1,890,394$1,640,700$1,553,461$1,808,511$894,536$859,095$805,576$757,371$730,109$
BoardofEducationServices129,421$163,894$112,108$129,701$124,636$135,446$99,345$113,508$123,747$90,278$
ExecutiveAdministration1,629,110$780,742$827,954$1,324,942$1,363,979$1,468,181$1,422,031$1,004,532$994,595$959,473$
BuildingLevelAdministration2,190,853$2,032,067$2,041,801$2,101,055$1,960,258$1,832,381$1,734,950$1,454,035$1,344,894$1,396,270$
BusinessServices348,417$371,301$328,972$-$-$-$-$-$-$-$
SecurityServices11,305$15,388$-$-$-$-$-$-$-$-$
OperationofPlant5,152,447$4,261,152$4,122,899$4,449,441$4,409,375$3,854,851$3,695,844$3,074,501$2,798,966$2,680,611$
PupilTransportation2,483,182$2,344,042$2,328,762$2,298,371$2,233,479$2,156,817$2,142,866$1,959,931$1,728,136$1,505,327$
FoodServices1,502,884$1,455,752$1,463,522$1,522,679$1,421,720$1,385,581$1,339,379$1,364,664$1,269,913$1,124,797$
CentralOfficeSupportServices37,891$710$11,790$-$60$-$-$-$-$
AdultEducationandCommunityServices1,099,844$1,084,813$1,149,061$1,225,323$1,244,293$1,104,348$917,018$867,970$969,249$978,702$
CapitalOutlay6,752,013$638,596$460,659$927,601$9,027,558$2,092,824$5,628,476$7,416,971$3,720,428$1,170,066$
DebtService:
InterestandFiscalCharges2,647,053$7,265,113$4,363,114$4,328,355$6,104,399$3,275,209$3,072,105$2,911,973$2,563,554$3,565,283$
TotalPrimaryGovernmentExpenses51,526,628$48,307,175$44,145,495$45,155,088$53,418,314$39,492,178$42,252,656$38,926,327$34,477,191$31,747,866$
ProgramRevenues
GovernmentActivities
Chargesforservices
TotalInstruction-$1,941,900$2,156,034$1,369,101$1,270,108$1,313,641$1,082,885$1,043,309$1,418,222$
SupportServices:
Attendance-$-$-$-$-$-$-$-$-$
Guidance-$-$-$-$-$-$-$-$-$
Health,Pscyh,Speech,andAudio-$-$-$-$-$-$-$-$-$
ImprovementofInstruction-$-$-$-$-$-$-$-$-$
ProfessionalDevelopment-$-$-$-$-$-$-$-$-$
MediaServices(Library)-$-$-$-$-$-$-$-$-$
BoardofEducationServices-$-$-$-$-$-$-$-$-$
ExecutiveAdministration-$-$-$-$-$-$-$-$-$
BuildingLevelAdministration-$-$-$-$-$-$-$-$13,750$
BusinessServices-$-$-$-$-$-$-$-$-$
SecurityServices-$-$-$-$-$-$-$-$-$
OperationofPlant-$80,449$79,804$75,830$76,215$9,703$19,601$7,708$-$
PupilTransportation-$-$-$-$-$322,577$-$913,547$-$
FoodServices941,522$916,604$1,014,344$1,089,885$1,002,740$1,033,038$-$1,002,611$-$849,490$
CentralOfficeSupportServices-$-$-$-$-$-$-$-$-$
AdultEducationandCommunityServices197,877$197,449$145,733$120,425$169,773$158,775$105,471$167,207$142,960$134,976$
CapitalOutlay-$-$-$-$-$-$-$-$
DebtService:
InterestandFiscalCharges-$-$-$-$-$-$-$-$
OperatingGrantsandContributions11,251,350$10,563,098$6,566,271$5,291,038$17,251,266$11,399,880$6,443,211$5,522,661$5,008,459$4,607,642$
CapitalGrantsandContributions76,000$58,957$199,578$137,734$302,392$244,908$258,987$255,863$122,483$321,020$
TotalPrimaryGovernmentProgramRevenue12,466,749$11,736,108$9,948,275$8,874,920$20,171,102$14,182,924$8,453,590$8,050,828$7,238,466$7,345,100$
Net(Expense)/Revenue
TotalPrimaryGovernmentNetExpense(39,059,878)$(36,571,067)$(34,197,220)$(36,280,168)$(33,247,212)$(25,309,254)$(33,799,066)$(30,875,499)$(27,238,725)$(24,402,766)$
Source:SchoolDistrictofWashingtonrecords
SchoolDistrictofWashington
Expenses,ProgramRevenuesandNet(Expense)/Revenue
LastTenFiscalYears
2012201120102009200820072006200520042003
Net(Expense)/Revenue
TotalPrimaryGovernmentNetExpense(39,059,879)$(36,571,068)$(34,197,220)$(36,280,168)$(33,247,212)$(25,309,254)$(33,799,066)$(30,875,499)$(27,238,725)$(24,402,766)$
GeneralRevenues:
Taxes:
PropertyTax28,206,888$27,859,003$25,209,345$24,438,798$23,449,365$22,930,820$21,900,131$19,125,820$19,652,847$18,290,652$
SalesTax3,307,819$3,136,813$3,089,298$3,201,282$3,405,963$3,389,551$3,231,810$3,044,259$2,869,447$2,858,370$
Other507,320$668,713$3,707,434$3,450,602$2,995,522$1,863,415$1,736,508$1,737,660$246,368$-$
StateAid4,192,687$3,349,480$4,859,142$5,166,440$4,770,081$4,408,198$2,873,851$2,722,795$2,598,780$2,627,179$
InterestandInvestmentEarnings878,511$624,435$473,574$636,235$1,243,448$1,134,975$682,201$552,425$245,981$264,922$
BondProceeds17,650,000$-$-$-$-$-$-$9,735,410$-$
Miscellaneous1,592,665$1,403,908$9,055$55,991$75,763$-$-$-$-$-$
TotalGeneralRevenues38,685,890$54,692,353$37,347,848$36,949,348$35,940,142$33,726,959$30,424,501$27,182,959$35,348,833$24,041,123$
ChangeinNetAssets
TotalPrimaryGovernment(373,989)$18,121,285$3,150,628$669,180$2,692,930$8,417,705$(3,374,565)$(3,692,540)$8,110,108$(361,643)$
Source:SchoolDistrictofWashingtonrecords
SCHOOLDISTRICTOFWASHINGTON
GENERALREVENUESANDTOTALCHANGEINNETASSETS
LASTTENFISCALYEARS
20102009200820072006200520042003
Reserved-$-$-$-$-$353,384$362,866$296,376$
Unreserved14,000,110$12,184,913$11,427,035$9,967,095$8,398,173$7,326,235$5,442,123$5,237,034$
TotalGeneralFund14,000,110$12,184,913$11,427,035$9,967,095$8,398,173$7,679,619$5,804,989$5,533,410$
AllOtherGovernmentalFunds
Reserved-DebtService9,533,910$8,753,386$8,873,977$10,823,649$3,279,905$2,247,158$2,221,426$2,057,914$
Unreservedreportedin:
SpecialRevenueFund226,785$423,815$1,388,712$1,211,967$819,273$-$-$-$
CapitalProjectsFund4,829,665$4,246,816$4,430,983$1,199,481$2,253,408$4,473,650$10,066,552$2,391,535$
TotalAllOtherGovernmentalFunds14,590,360$13,424,017$14,693,672$13,235,097$6,352,586$6,720,808$12,287,978$4,449,449$
TotalFundBalance28,590,470$25,608,930$26,120,707$23,202,192$14,750,759$14,400,427$18,092,967$9,982,859$
20122011
FundBalances
Nonspendable
Inventory708,403$
Restricted
DebtService9,146,254$11,754,059$
AssignedFundBalance
UnspentBondProceeds3,985,243$14,571,378$
EscrowedCertificatesofParticpation1,947,623$2,023,623$
RemainingCapitalProjectsFund4,475,424$1,855,101$
UnassignedFundBalance17,241,402$16,159,815$
TotalFundBalance37,504,349$46,363,977$
Source:SchoolDistrictofWashingtonrecords
GeneralFund
SCHOOLDISTRICTOFWASHINGTON
FUNDBALANCES-GOVERNMENTALFUNDS
LASTTENFISCALYEARS
2012201120102009200820072006200520042003
Revenues
LocalSources35,715,466$34,614,132$31,316,300$31,108,277$30,766,935$29,858,099$28,048,236$24,965,923$23,449,711$22,164,285$
CoutySources1,885,998$1,211,492$3,025,721$2,761,578$2,504,931$1,414,589$1,367,378$1,314,538$1,185,306$1,166,979$
StateSources8,443,507$7,264,413$7,330,172$7,879,007$7,472,978$6,919,392$6,600,042$6,300,303$5,703,030$5,587,902$
FederalSources3,822,364$4,491,385$4,300,696$2,706,243$2,503,610$2,527,473$2,235,122$2,261,881$2,097,197$2,032,950$
OtherSources-$-$1,323,234$1,365,225$589,641$755,883$627,313$391,142$416,645$434,107$
TotalRevenues49,867,335$47,581,422$47,296,123$45,820,330$43,838,095$41,475,436$38,878,091$35,233,787$32,851,889$31,386,223$
Source:SchoolDistrictofWashingtonrecords
SCHOOLDISTRICTOFWASHINGTON
GOVERNMENTALFUNDREVENUES
LASTTENFISCALYEARS
2012201120102009200820072006200520042003
EXPENDITURES
TotalInstruction23,850,214$23,374,795.00$22,653,732.00$23,177,851.00$22,060,930.00$19,754,381.00$19,805,177.00$16,454,469.00$16,726,979.00$16,062,999.00$
SupportServices
Attendance139,673$104,208.00$139,905.00$179,360.00$100,094.00$81,967.00$63,201.00$76,335.00$70,488.00$80,061.00$
Guidance899,793$793,033.00$786,806.00$782,800.00$648,541.00$620,278.00$658,315.00$512,978.00$544,296.00$512,664.00$
Health,Psych,Speech,andAudio1,279,393$1,153,972.00$1,180,038.00$663,088.00$623,929.00$562,642.00$521,740.00$586,598.00$537,959.00$501,016.00$
ImprovementofInstruction460,774$506,006.00$491,341.00$411,678.00$176,552.00$232,352.00$237,773.00$294,326.00$286,363.00$349,543.00$
ProfessionalDevelopment47,540$71,197.00$54,121.00$67,592.00$110,060.00$40,324.00$55,341.00$27,960.00$40,253.00$40,667.00$
MediaServices(Library)869,584$1,890,394.00$1,640,700.00$1,553,461.00$1,808,511.00$894,536.00$859,095.00$805,576.00$757,371.00$730,109.00$
BoardofEducationServices129,422$163,894.00$112,108.00$129,701.00$124,636.00$135,446.00$99,345.00$113,508.00$123,747.00$90,278.00$
ExecutiveAdministration1,628,232$780,741.00$827,954.00$1,324,942.00$1,363,979.00$1,468,181.00$1,422,031.00$1,004,532.00$994,595.00$959,473.00$
BuildingLevelAdministration2,191,642$2,032,067.00$2,041,801.00$2,101,055.00$1,960,258.00$1,832,381.00$1,734,950.00$1,454,035.00$1,344,894.00$1,396,270.00$
BusinessServices348,560$371,301.00$328,972.00$11,790.00$-$-$-$-$-$-$
OperationofPlant4,278,038$4,261,152.00$4,122,899.00$4,449,441.00$4,409,375.00$3,854,851.00$3,695,844.00$3,074,501.00$2,798,966.00$2,680,611.00$
SecurityServices11,309$15,388.00$-$-$-$-$-$-$-$-$
PupilTransportation2,483,182$2,344,042.00$2,328,762.00$2,298,371.00$2,233,479.00$2,156,817.00$2,142,866.00$1,959,931.00$1,728,136.00$1,505,327.00$
FoodServices1,503,323$1,455,752.00$1,463,522.00$1,522,679.00$1,421,720.00$1,385,581.00$1,339,379.00$1,364,664.00$1,269,913.00$1,124,797.00$
CentralOfficeSupportServices37,893$710.00$-$-$-$60.00$-$-$-$-$
AdultEducation458,793$514,514.00$522,072.00$561,323.00$605,943.00$526,715.00$447,725.00$867,970.00$969,249.00$978,702.00$
CommunityServices641,468$570,299.00$626,989.00$664,000.00$638,350.00$577,633.00$469,293.00$-$-$-$
CapitalOutlay11,022,715$638,596.00$460,659.00$927,601.00$9,027,558.00$2,092,824.00$5,628,476.00$7,416,971.00$3,720,428.00$1,170,066.00$
DebtService
PrincipalRetirement4,200,000$5,295,000.00$2,370,000.00$2,215,000.00$4,025,000.00$1,610,000.00$1,535,000.00$1,450,000.00$1,390,000.00$1,115,563.00$
InterestandFiscalCharges2,779,286$1,970,113.00$1,993,114.00$2,113,355.00$2,079,399.00$1,665,209.00$1,537,105.00$1,461,973.00$1,173,554.00$2,449,720.00$
TotalSupportServices35,410,619$24,932,379.00$21,491,763.00$21,977,237.00$31,357,384.00$19,737,797.00$22,447,479.00$22,471,858.00$17,750,212.00$15,684,867.00$
TOTALEXPENDITURES59,260,833$48,307,174.00$44,145,495.00$45,155,088.00$53,418,314.00$39,492,178.00$42,252,656.00$38,926,327.00$34,477,191.00$31,747,866.00$
DebtServiceasa%ofnon-capitalexpenditures14.47%15.24%9.99%9.79%13.75%8.76%8.39%9.24%8.33%11.66%
Source:SchoolDistrictofWashingtonrecords
SCHOOLDISTRICTOFWASHINGTON
GOVERNMENTALFUNDSEXPENDITURESANDDEBTSERVICERATIO
LASTTENFISCALYEARS
2012201120102009200820072006200520042003
Excess(deficiency)ofrevenuesoverexpenditures(9,393,498)$(725,754)$3,150,628$665,242$(9,580,219)$1,983,258$(3,374,565)$(3,692,540)$(1,625,302)$435,484$
OtherFinancingSources(Uses):
Transfers-$-$-$-$-$-$-$-$-$
CapitalLeaseObligation-$-$-$12,109,609$-$-$-$-$-$
BondIssuance15,000,000$-$-$-$-$-$-$9,735,410$-$
Refundingbondissued2,650,000$-$-$-$6,445,000$-$-$-$-$
Paymenttoberefundedbondescrowagent42,607$-$-$-$(10,553)$-$-$-$-$
Premiumonissuanceofbonds-$-$-$-$-$-$-$-$-$
OtherNoncurrent/SaleofProperty147,639$-$-$3,938$163,000$-$-$-$-$-$
AreaVoc.&ContractEdServices1,137,666$1,154,432$-$-$-$-$-$-$-$-$
Netchangeinfundbalances(8,108,193)$18,121,285$3,150,628$669,180$2,692,390$8,417,705$(3,374,565)$(3,692,540)$8,110,108$435,484$
Source:SchoolDistrictofWashingtonrecords
SCHOOLDISTRICTOFWASHINGTON
OTHERFINANCINGSOURCESANDNETCHANGEINFUNDBALANCES-GOVERNMENTALFUNDS
LASTTENFISCALYEARS
Fiscal Year
Ending 6/30
Real Property
Assessed Value
19%
Real Property Est.
Actual Value
Personal
Property
Assessed Value
33%
Personal
Property Est.
Actual Value
Total Property
Assessed Value
Total Property
Est. Actual Value
Total Tax
Rate per
$100 A/V
2012 114,745,828.66$ 603,925,414.00$ 51,005,021.10$ 154,560,670.00$ 165,750,849.76$ 758,486,084.00$ 3.8060$
2011 115,835,106.83$ 609,658,457.00$ 44,198,847.99$ 133,935,903.00$ 160,033,954.82$ 743,594,360.00$ 3.7860$
2010 113,249,324.06$ 596,049,074.00$ 41,685,046.59$ 126,318,323.00$ 154,934,370.65$ 722,367,397.00$ 3.7923$
2009 111,560,985.96$ 587,163,084.00$ 43,393,553.61$ 131,495,617.00$ 154,954,539.57$ 718,658,701.00$ 3.6600$
2008 108,291,747.35$ 569,956,565.00$ 38,191,625.01$ 115,732,197.00$ 146,483,372.36$ 685,688,762.00$ 3.6600$
2007 95,681,432.72$ 503,586,488.00$ 40,994,830.80$ 124,226,760.00$ 136,676,263.52$ 630,035,040.00$ 3.6600$
2006 89,929,565.76$ 473,313,504.00$ 43,385,090.76$ 131,469,972.00$ 133,314,656.52$ 604,783,476.00$ 3.6600$
2005 79,075,029.54$ 416,184,366.00$ 35,921,539.83$ 108,853,151.00$ 114,996,569.37$ 525,037,517.00$ 3.6693$
2004 75,742,447.02$ 398,644,458.00$ 37,723,753.98$ 114,314,406.00$ 113,466,201.00$ 512,958,864.00$ 3.6031$
2003 70,100,715.27$ 368,951,133.00$ 34,804,630.08$ 105,468,576.00$ 104,905,345.35$ 474,419,709.00$ 3.6031$
Source: Franklin, St. Charles, and Warren County Assessor's Offices
Note: On January 1 of every second year the property values are rendered for appraisal (reassessment). The appraisal process for the
School of Washington is conducted by the Franklin, St. Charles and Warren County Assessor's office. For the School District of
Washington residential real estate is appraised at 19% of market value, commercial at 32%of value, agricultural at 12% of value and
personal property at 33% of value.
The Assessor's Office submits preliminary values to the school district by June. These values are usually a realistic eestimate of the
ultimate certified values that come by August. The preliminiary values are good estimates upon which to base the tax levies for the
operating and debt service budgets. Once the certified values are received by the district, the tax rate adoption is complete prior to
September and the budgeting process can begin for the subsequent fiscal year.
Property owners (both Real Estate and Personal Property) are taxed by the various taxing authorities (including the school district) in
their county of residence. Tax levy rates (so much per $100 of assessed valuations) are set by the taxing authorities according to the
State law. Assessed valuations are set by the county in which the property resides and every other year is a reassessment year. The
tax obligation is billed by the county department of revenue and paid through that department to the taxing authorities. The tax billed
is simply the levy rate multiplied by the assessed valuation. These are normally multiple taxing authority obligations included on one
tax bill which is typically mailed to tax payers in November with a due date of December 31. The District receives the majority of its
revenue in late December and January.
School District of Washington
Assessed Value and Actual Value of Taxable Property
Last Ten Fiscal Years
TaxingDistricts2012201120102009200820072006200520042003
SchoolDistrictofWashington3.8060$3.7860$3.7923$3.6600$3.6600$3.6600$3.6600$3.6606$3.6031$3.6031$
GeneralFund3.2175$3.3260$3.1244$1.8656$1.8656$1.6831$1.6719$1.6647$1.5748$1.6231$
Special(Teachers')Fund-$-$1.2700$1.2700$1.2700$1.2700$1.2774$1.2541$1.2200$
CapitalFund0.2900$0.1700$0.3779$0.3779$0.3600$0.3600$0.3581$0.5135$0.1853$0.1300$
DebtServiceFund0.2985$0.2900$0.2900$0.1465$0.1644$0.3469$0.3600$0.2050$0.5889$0.6300$
Overlapping
CityofWashington0.6020$0.6020$0.5962$0.5959$0.5941$0.5857$0.5940$0.5177$0.5412$0.5420$
EastCentralCollege0.4385$0.4329$0.0433$0.0435$0.4313$0.4471$0.4473$0.4369$0.4691$0.4540$
TotalOverlapping1.0405$1.0349$0.6395$0.6394$1.0254$1.0328$1.0413$0.9546$1.0103$0.9960$
Source:SchoolDistrictofWashington,CityofWashington,EastCentralCollege
SchoolDistrictofWashington
DirectandOverlappingPropertyTaxRates
LastTenFiscalYears
(rateper$100ofassessedvalue)
Taxable
Assessed
Valuation Rank
Percentage
of Total of
Taxable
Value
Taxable
Assessed
Valuation Rank
Percentage
Of Total
Taxable
Value
Real Estate
Creekside Land and Dev Co LLC 10,462,853.00$ 1 3.17% -$ 1 0%
Wal-Mart Real Estate Business 5,748,464.00$ 2 1.74% -$ 2 0%
Parker-Hannifin Corp 3,624,292.00$ 3 1.10% -$ 3 0%
MCW-RD Washington Crossing LLC 3,217,589.00$ 4 0.97% -$ 4 0%
Phoenix Center II Development 2,960,635.00$ 5 0.90% -$ 5 0%
Lowe's Home Centers, Inc. 2,688,355.00$ 6 0.81% -$ 6 0%
Creekside Land and Dev Co LLC 2,635,229.00$ 7 0.80% -$ 7 0%
Bank of Washington 2,610,563.00$ 8 0.79% -$ 8 0%
Target Corporation Target Pro 2,607,744.00$ 9 0.79% -$ 9 0%
Hollingsworth Capital Partner 2,361,635.00$ 10 0.71% -$ 10 0%
Total Real Estate 38,917,359.00$ 11.78% -$ 0%
Personal Property
PFHC Medical Management LLC 1,641,158.00$ 1 0.50% -$ 1 0%
CG Powers Systems USA, Inc 1,183,164.00$ 2 0.36% -$ 2 0%
Parker-Hannifin Corp 1,013,162.00$ 3 0.31% -$ 3 0%
Tradco Inc. - Wash, Inc 993,616.00$ 4 0.30% -$ 4 0%
Fricks Meat Products 991,992.00$ 5 0.30% -$ 5 0%
Magnet LLC 989,116.00$ 6 0.30% -$ 6 0%
Canam Steel Corp - Midwestern 902,456.00$ 7 0.27% -$ 7 0%
GHTMLC 819,437.00$ 8 0.25% -$ 8 0%
Wal-Mart Stores, Inc 713,644.00$ 9 0.22% -$ 9 0%
Missourian Publishing Co 678,582.00$ 10 0.21% -$ 10 0%
Total Personal Property 9,926,327.00$ 3.02% -$ 0%
Source: Franklin County Collector's Office
Note: 2003 information was not available
Taxpayer
2012 2003
School District of Washington
Principle Property Taxpayers
Current Year and Nine Years Ago
June30,
Residential
Property
Commercial
Property
Agricultural
Property
Personal
Property
TotalTaxable
AssessedValue
TotalDirect
TaxRate
TotalPropertyEst.
ActualValue
2012418,369,719.00$171,363,637.00$36,179,318.00$154,736,148.00$780,648,822.00$3.8060$1,323,280,010.67$
2011414,906,635.00$172,340,260.00$14,197,152.00$136,325,753.00$737,769,800.00$3.7860$1,087,728,264.63$
2010423,434,764.00$171,554,345.00$14,651,107.00$130,499,642.00$740,139,858.00$3.7923$1,072,024,006.48$
2009420,712,831.00$162,032,431.00$14,575,537.00$124,763,515.00$722,084,314.00$3.6600$1,024,284,913.59$
2008416,757,350.00$153,342,650.00$13,953,411.00$129,316,697.00$713,370,108.00$3.6600$1,005,397,693.51$
2007405,963,073.00$147,451,557.00$14,044,522.00$119,677,053.00$687,136,205.00$3.6600$958,257,342.19$
2006361,083,409.00$129,495,253.00$13,006,596.00$124,226,760.00$627,812,018.00$3.6600$904,782,907.33$
2005344,506,862.00$124,473,705.00$12,360,391.00$131,356,861.00$612,697,819.00$3.6693$904,225,520.56$
2004292,450,213.00$112,678,248.00$11,056,095.00$108,798,531.00$524,983,087.00$3.6031$786,074,002.30$
2003280,198,399.00$107,130,129.00$11,315,930.00$114,314,406.00$512,958,864.00$3.6031$786,805,869.70$
Source:Franklin,St.Charles,andWarrenCountyAssessor'sOffices
SchoolDistrictofWashington
AssessedValueandEstimateActualValueofTaxableProperty
LastTenFiscalYears
TaxableAssessedValues
$-
$100,000,000.00
$200,000,000.00
$300,000,000.00
$400,000,000.00
$500,000,000.00
$600,000,000.00
$700,000,000.00
$800,000,000.00
$900,000,000.00
2012201120102009200820072006200520042003
2012201120102009200820072006200520042003
CapitalLeases1,765,000$18,100,000$18,500,000$18,940,000$19,430,000$7,400,000$7,590,000$7,720,000$7,845,000$7,965,000$
GeneralObligationBonds32,395,000$36,145,000$19,395,000$20,095,000$20,695,000$23,160,000$17,170,000$17,670,000$18,155,000$9,245,000$
TotalPrimary34,160,000.00$54,245,000.00$37,895,000.00$39,035,000.00$40,125,000.00$30,560,000.00$24,760,000.00$25,390,000.00$26,000,000.00$17,210,000.00$
EstimatedActualValueofTaxableProperty1,323,280,010.67$1,087,728,264.63$1,072,024,006.48$1,024,284,913.59$1,005,397,693.51$958,257,342.19$904,782,907.33$904,225,520.56$786,074,002.30$786,805,869.70$
%ofGeneralBondedDebttoEstimated
ActualValueofTaxableProperty2.58%4.99%3.53%3.81%3.99%3.19%2.74%2.81%3.31%2.19%
PersonalIncome(Countydata)N/AN/A3,529,8503,472,1413,611,3483,408,6743,210,3953,005,1362,859,5122,708,017
%ofPersonalIncomeN/AN/A10.74%11.24%11.11%8.97%7.71%8.45%9.09%6.36%
Population(Countydata)N/AN/A10154310142210114910026599341984179746596480
PerCapitaN/AN/A373$385$397$305$249$258$267$178$
Note:N/A-NotAvailable;InformationisforFranklinCounty,2011&2012demographicinformationnotavailableatthetimeofpublication.
Source:SchoolDistrictofWashingtonrecordsandBureauofEconomicAnalysis
SchoolDistrictofWashington
LastTenFiscalYears
OutstandingDebtByType
Taxing Body
General
Obligation Debt
as of 6/30/12
Approx. Percent
of Applicable
Overlap
Estimated Share
of Direct and
Overlapping
Debt
Direct
School District of Washington 32,395,000$ 100% 32,395,000$
Subtotal Direct Debt 32,395,000$ 100% 32,395,000$
Overlapping
City of Washington 42,411,137$ 100% 42,411,137$
East Central College 18,780,930$ 39.54% 7,425,980$
Subtotal Overlapping Debt 61,192,067$ 49,837,117$
Total 93,587,067$ 82,232,117$
Source: Individual entities
School District of Washington
June 30, 2012
Direct and Overlapping Governmental Debt
Notes: Overlapping governments are those that coincide, at least in part, with the
geographic boundaries of the District. This schedule estimates the portion of the
outstanding debt of those overlapping governments that is borne by the residents and
businesses of the District. Percentage of overlap is calculated by the Collector of
Revenue's Office as follows: For the purpose of determing the appropriate composite
property tax rates, all properties are within areas defined by what are called school
district sub-codes. Each sub-code accounts for what taxing districts have jurisdition
over a particular parcel or property. Periodic ledgers comprising the total assessed
values for each sub-code are are generated by County Revenue. Appropriate
percentage overlap values have been culled from appropriate ledger.
AssessedValue744,141,411.00$
DebtLimit(15%ofAssessedValue)111,621,211.65$
DebtApplicabletoLimit(32,395,000.00)$
AmountAvailableinDebtServiceFund9,139,000.57$
LegalDebtMargin88,365,212.22$
2012201120102009200820072006200520042003
DebtLimitation111,621,212.00$111,539,154.00$107,983,822.00$107,814,198.00$103,385,662.00$94,505,256.00$92,150,581.00$78,921,849.00$76,992,175.00$70,993,607.00$
GeneralObligationBondsPayable(32,395,000.00)$(36,145,000.00)$(19,395,000.00)$(20,095,000.00)$(20,695,000.00)$(23,160,000.00)$(17,170,000.00)$(17,670,000.00)$(18,155,000.00)$(9,245,000.00)$
Avail.DebtServiceFundBalance9,139,001.00$11,754,059.00$8,272,199.00$7,416,642.00$7,580,868.00$10,823,649.00$1,973,369.00$996,783.00$963,271.00$786,140.00$
NetDebtApplicable(23,255,999.00)$(24,390,941.00)$(11,122,801.00)$(12,678,358.00)$(13,114,132.00)$(12,336,351.00)$(15,196,631.00)$(16,673,217.00)$(17,191,729.00)$(8,458,860.00)$
LegalDebtMargin88,365,213.00$87,148,213.00$96,861,021.00$95,135,840.00$90,271,530.00$82,168,905.00$76,953,950.00$62,248,632.00$59,800,446.00$62,534,747.00$
LegalDebtMarginasa%ofDebtLimit79.17%78.13%89.70%88.24%87.32%86.95%83.51%78.87%77.67%88.09%
Note:LegalDebtMarginistheadditionalamountofdebttheDistrictmayincur.LegalDebtLimitistheassessedvaluation(A/V)multipliedby15%.
Source:SchoolDistrictofWashingtonrecords
LegalDebtMarginCalculationforFiscalYear2012
SchoolDistrictOfWashington
LegalDebtMarginInformation
LastTenFiscalYears
$-
$10,000,000.00
$20,000,000.00
$30,000,000.00
$40,000,000.00
$50,000,000.00
$60,000,000.00
$70,000,000.00
$80,000,000.00
$90,000,000.00
$100,000,000.00
2012201120102009200820072006200520042003
LegalDebtMargin
2012201120102009200820072006200520042003
RevenueN/AN/AN/AN/AN/AN/AN/AN/AN/AN/A
DebtServiceN/AN/AN/AN/AN/AN/AN/AN/AN/AN/A
PrincipalN/AN/AN/AN/AN/AN/AN/AN/AN/AN/A
InterestN/AN/AN/AN/AN/AN/AN/AN/AN/AN/A
CoverageN/AN/AN/AN/AN/AN/AN/AN/AN/AN/A
Notes:SchoolDistrictofWashingtondoesnothaveanypledgedrevenue
SchoolDistrictofWashington
Pledged-RevenueCoverage
LastTenFiscalYears
2012201120102009200820072006200520042003
AssessedValuations780,648,822.00$737,769,800.00$740,139,858.00$722,084,314.00$713,370,108.00$687,136,205.00$627,812,018.00$612,697,819.00$524,983,087.00$512,958,864.00$
TaxRate3.8060$3.7860$3.7923$3.6600$3.6600$3.6600$3.6600$3.6693$3.6031$3.6031$
TaxesLeviedfortheFiscalYear29,711,494.17$27,931,964.63$28,068,323.83$26,428,285.89$26,109,345.95$25,149,185.10$22,977,919.86$22,481,721.07$18,915,665.61$18,482,420.83$
Amount26,705,721.30$26,203,084.59$25,166,277.61$24,308,027.80$22,673,715.25$21,808,861.24$21,150,715.85$18,313,757.67$17,743,367.58$-$
%ofLevy90%94%90%92%87%87%92%81%94%0%
CollectedinSubsequentYears
Amount1,395,181.34$1,655,918.39$1,605,707.12$1,651,239.78$1,937,880.67$1,121,958.83$749,414.55$812,062.24$556,245.02$-$
%ofLevy95%100%95%98%94%91%95%85%97%0%
Note:BasedonFiscalYear,FY2003informationnotavailable
Source:SchoolDistrictofWashingtonrecordsandFranklin,St.CharlesandWarrenCountyDepartmentofRevenue
SchoolDistrictofWashington
PropertyTaxLeviesandCollections
LastTenFiscalYears
TaxesLeviedDelinquentTaxesCollected
CollectedwithinFiscalYearof
Levy
$-
$5,000,000.00
$10,000,000.00
$15,000,000.00
$20,000,000.00
$25,000,000.00
$30,000,000.00
123456789
$-
$200,000.00
$400,000.00
$600,000.00
$800,000.00
$1,000,000.00
$1,200,000.00
$1,400,000.00
$1,600,000.00
$1,800,000.00
$2,000,000.00
123456789
Year Population
Personal
Income
Per Capita
Personal
Income
Unemployment
Rate
2012 N/A N/A N/A 7.3%
2011 101938 N/A N/A 9.3%
2010 101543 3,529,850.00$ 34,762.00$ 10.7%
2009 101422 3,472,141.00$ 34,235.00$ 12.3%
2008 101149 3,611,348.00$ 35,703.00$ 7.2%
2007 100265 3,408,674.00$ 33,997.00$ 5.5%
2006 99341 3,210,395.00$ 32,317.00$ 5.3%
2005 98417 3,005,136.00$ 30,535.00$ 5.7%
2004 97465 2,859,512.00$ 29,339.00$ 5.9%
2003 96480 2,708,017.00$ 28,068.00$ 5.6%
Note: N/A - Not available
Source: Bureau of Economic Analysis and Federal Reserve Bank of St. Louis
School District of Washington
Demographic and Economic Statistics - Franklin County Only
Last Ten Fiscal Years
7.3%
9.3%
10.7%
12.3%
7.2%
5.5% 5.3%
5.7% 5.9% 5.6%
0.0%
2.0%
4.0%
6.0%
8.0%
10.0%
12.0%
14.0%
2012 2011 2010 2009 2008 2007 2006 2005 2004 2003
Unemployment Rate
EmployerTypeEmployeesRank
Percentof
Total
EmploymentEmployeesRank
Percentof
Total
Employment
ParkerHannifin(Sporlan)Manufacturer119515.95%73223.64%
MercyHospitalHealthCare100024.98%75113.74%
WashingtonSchoolDistrictEducation62032.99%55432.75%
HarmanBeckerAutomotiveManufacturer45542.26%00.00%
WalmartSuperCenterRetailMerchant42752.13%45052.24%
PatientsFirstHealthCareHealthCare41362.06%00.00%
CGPowers(Pauwels)Manufacturer36471.81%26071.29%
MagnetManufacturer25581.27%35061.74%
RTITradcoManufacturer22091.09%133100.66%
RawlingsSportingGoodsCoManufacturer173100.86%00.00%
EagleOPGManufacturer055042.74%
ClemcoManufacturer014090.70%
JeffersonProductsManufacturer015980.79%
Source:CityofWashington,FinanceDepartment-BusinessLicenses
20122003
SchoolDistrictofWashington
PrincipleEmployers
LastTenFiscalYears
POSITION 2012-13 2011-12 2010-11 2009-10 2008-09 2007-08 2006-07 2005-06 2004-05
ADMINSTRATION
SUPT/ASST. SUPT 3 3 3 3 3 3 2 2 2
CFO/DIR OF BUSINESS SERVICES 1 1 1 1 1 1 1 1 1
PRINCIPAL HS AND MS 3 3 3 3 3 4 3 3 2
PRINCIPAL/ BLDG. SUPV. - ELEMENTARY 9 9 9 9 9 8 8 6 6
ASSOC & ASST. PRINCIPAL HS & MS 3 3 3 1 2 3 4 3 1
DIRECTOR/COORDINATORS 5 5 5 4 4 4 4 4 4
SUB TOTAL 24 24 24 21 22 23 22 19 16
TEACHERS (INCLUDES COUNSELORS, LIBRARIANS, SPEECH PATHOLOGISTS, PSYCH EXAMINERS)
ELEMENTARY 170 158 150 164 158 159 152 145 148
MIDDLE SCHOOL 45 43 45 44 42 43 38 42 40
HIGH SCHOOL 92 86 82 85 85 96 81 73 76
CAREER CENTER 20 20 20 20 17 17 17 15 19
EARLY CHILDHOOD SPECIAL ED 9 9 9 13 9 9 9 9 8
INSTRUCT. COOR/PROCESS COOR 4 3 3 3 3 1 1 1 1
SUB TOTAL 340 319 309 329 314 325 298 285 292
SUPPORT STAFF
DISTRICT OFFICE SUPPORT STAFF 10 10 13 13 11 12 10 6 8
ALL OTHER SEC/ADMIN. ASST. 29 26 24 25 27 28 27 20 18
TECHNOLOGY 8 7 7 7 6 5 4 3 2
PARAPROFESSIONAL 67 63 61 65 64 62 58 54 54
NURSE / HEALTH COORD 11 11 10 10 8 8 7 5 5
PT /OT AND ASST. 5 4 4 4 4 3 2 2 3
PARENT EDUCATOR 8 10 12 13 14 9 9 6 6
SOCIAL WORKER 1 n/a n/a n/a n/a n/a n/a n/a n/a
FOOD SERVICE DIRECTOR 1 1 1 1 1 1 1 1 1
FOOD SERVICE COOK & KITCHEN MGR. 43 40 40 40 41 39 40 38 40
NOON AIDE/CROSSING GUARD 16 16 17 18 17 18 18 14 11
BLDG GROUNDS DIR/MAINT. FOREMAN 2 2 2 2 2 2 2 2 2
GROUNDS/DELIVERY/MAINT. 12 12 12 11 12 12 12 7 6
CUSTODIANS/CUST. SUPERVISOR 41 42 44 44 46 48 46 42 49
SUB TOTAL 254 244 247 253 253 247 236 200 205
GRAND TOTAL 618 587 580 603 589 595 556 504 513
Note: Does not include substitutes, temporaries or seasonal employees
Source: School District of Washington HR records
SCHOOL DISTRICT OF WASHINGTON
2012201120102009200820072006200520042003
EnrolledPupils(September)3950.273928.983993.964050.134018.324001.663990.563891.683912.993853.69
OperatingExpenditures40,327,088.00$39,291,088.00$38,700,152.00$39,045,810.00$36,860,351.00$34,009,354.00$33,552,075.00$28,597,383.00$28,598,613.00$27,187,291.00$
CostPerEnrolledPupil9,341.00$9,074.00$8,810.00$8,798.00$8,690.00$8,720.00$8,062.00$6,799.00$6,769.00$6,668.00$
%ofChange1.03%1.03%1.00%1.01%1.00%1.08%1.19%1.00%1.02%1.03%
TeachingStaff336308316319320296290301295294
EnrolledPupils/TeacherRatio18191918191918181818
#ofFree&Reduced10901196.061169.57944.18793.43746716.76716.51669.21700
%ofEnrolledPupilsQualifying
forFree/Reduced27.59%30.44%29.28%23.31%19.75%18.64%17.96%18.41%17.10%18.16%
FundBalance%(Reserves)44.29%41.23%36.02%31.27%30.32%23.97%23.36%26.85%20.59%20.48%
Note:OperatingExpendituresarebeforetransfers;TeachingStaffincludesCounselors
Source:SchoolDistrictofWashingtonrecords
SchoolDistrictofWashington
OperatingStatistics
LastTenFiscalYears
SCHOOLDISTRICTOFWASHINGTON
TEACHERBASESALARIES
LASTTENFISCALYEARS
2012201120102009200820072006200520042003
SchoolDistrictofWashington
MinimumSalary34100329503180031800318003100029800294512828727851
MaximumSalary69960690856859168591689516686559092573785508253896
SDOWAverageSalary46121457644549545046438514188039808394483939538357
CountyAverageSalary402423921239077393023814037213360103577934338
StatewideAverageSalary46740462884694546069450504352442063406853978639280
Note:Amountsdonotincludebenefitssuchaspension,healthinsurance,disability,etc.;CountyAv-
erageSalaryforFY03notavailable
Source:St.LouisCooperatingSchoolDistrict;DistrictdatafromSchoolDistrictofWashing-
tonrecords
Location 2012 2011 2010 2009 2008 2007 2006 2005 2004 2003
Elementary
Augusta - 1939
Square Feet 27350 27350 27350 27350 27350 27350 27350 27350 27350 27350
Capacity 235 235 235 235 235 235 235 235 235 235
Enrollment 139 146 141 144 158 156 153 161 149 146
Campbellton - 1958
Square Feet 32682 32682 32682 32682 32682 31012 31012 31012 31012 31012
Capacity 280 280 280 280 280 158 158 158 158 158
Enrollment 152 149 154 167 186 182 156 122 139 141
Clearview - 1963
Square Feet 35246 35246 35246 35246 35246 295 35246 35246 35246 35246
Capacity 324 324 324 324 324 324 324 324 324 324
Enrollment 323 335 330 317 309 295 278 288 266 257
Fifth Street - 1938
Square Feet 26392 26392 26392 26392 26392 26392 26392 26392 26392 26392
Capacity 236 236 236 236 236 236 236 236 236 236
Enrollment 130 136 139 121 136 134 145 177 187 187
Labadie - 1962
Square Feet 25326 25326 25326 25326 25326 25326 25326 25326 25326 25326
Capacity 229 229 229 229 229 229 229 229 229 229
Enrollment 108 118 127 144 149 163 158 168 167 168
Marthasville - 1940
Square Feet 29315 29315 29315 29315 29315 29315 29315 29315 29315 29315
Capacity 275 275 275 275 275 275 275 275 275 275
Enrollment 241 252 247 228 211 181 177 180 180 183
South Point - 1952 354 467
Square Feet 49436 49436 49436 49436 49436 49436 49436 49436 49436 49436
Capacity 445 445 445 445 445 445 445 445 445 445
Enrollment 471 458 484 477 477 487 467 469 459 454
Washington West - 1998
Square Feet 58385 58385 58385 58385 58385 58385 58385 58385 58385 58385
Capacity 500 500 500 500 500 500 500 500 500 500
Enrollment 418 396 385 402 376 354 339 307 312 310
Source: September Official Enrollment, Facilities Department
School District of Washington
School Building Information
Last Ten Fiscal Years
Location 2012 2011 2010 2009 2008 2007 2006 2005 2004 2003
Middle School
Washington Middle School - 1970
Square Feet 77131 77131 77131 77131 77131 77131 77131 77131 77131 77131
Capacity 563 563 563 563 563 563 563 563 563 563
Enrollment 589 605 640 588 542 545 602 638 600 605
High School
Washington High School - 1955
Square Feet 252468 252468 252468 252468 252468 252468 252468 252468 252468 252468
Capacity 1713 1713 1713 1713 1713 1713 1713 1713 1713 1713
Enrollment 1355 1396 1400 1428 1456 1491 1416 1400 1393 1401
Other Structures
Administration Building - 1889
Square Feet 19160 19160 19160 19160 19160 19160 19160 19160 19160 19160
Capacity N/A N/A N/A N/A N/A N/A N/A N/A N/A N/A
Enrollment N/A N/A N/A N/A N/A N/A N/A N/A N/A N/A
Augusta Preschool - 2008
Square Feet 2038 2038 2038 2038 2038 N/A N/A N/A N/A N/A
Capacity N/A N/A N/A N/A N/A N/A N/A N/A N/A N/A
Enrollment N/A N/A N/A N/A N/A N/A N/A N/A N/A N/A
Central Warehouse - 1960
Square Feet 16725 16725 16725 16725 16725 16725 16725 16725 16725 16725
Capacity N/A N/A N/A N/A N/A N/A N/A N/A N/A N/A
Enrollment N/A N/A N/A N/A N/A N/A N/A N/A N/A N/A
Family Resource Center - 1979
Square Feet 1600 1600 1600 1600 1600 1600 1600 1600 1600 1600
Capacity N/A N/A N/A N/A N/A N/A N/A N/A N/A N/A
Enrollment N/A N/A N/A N/A N/A N/A N/A N/A N/A N/A
Four Rivers Career Center - 1979
Square Feet 88210 88210 88210 88210 88210 88210 88210 88210 88210 88210
Capacity N/A N/A N/A N/A N/A N/A N/A N/A N/A N/A
Enrollment N/A N/A N/A N/A N/A N/A N/A N/A N/A N/A
Technology and Learning Center - 2008
Square Feet 21868 21868 21868 21868 21868 N/A N/A N/A N/A N/A
Capacity N/A N/A N/A N/A N/A N/A N/A N/A N/A N/A
Enrollment N/A N/A N/A N/A N/A N/A N/A N/A N/A N/A
Source: September Official Enrollment, Facilities Department
Last Ten Fiscal Years
School District of Washington
School Building Information (Concluded)
CAFR 2012
CAFR 2012
CAFR 2012
CAFR 2012

CAFR 2012