The document discusses trends in real estate investment and development in major US cities. It notes that as the US economy strengthens and the US dollar appreciates, US cities are attracting more overseas investment in real estate. It profiles five US cities - Chicago, San Francisco, Los Angeles, Miami, and New York - and their dominant industries. Real estate trends in US cities often influence trends in other parts of the world, particularly in terms of urban regeneration and repopulation in cities.
The Global Cities Index (GCI) provides a comprehensive ranking of the leading global cities from around the world. It is designed to track the way cities plan as their populations grow and the world continues to shrink.
The costs of living and doing business in New York City are high, but not as high as in some others, including London and Tokyo, Mr. Abruzzese said. New York’s most glaring weakness has been in the management of the environment and preparation to cope with storms and other natural disasters, he said. (The New York Times)
GLOBAL CITIES Tomorrow: Paris, London, New York, Hong Kong, Dubai, Moscow,… W...Azamat Abdoullaev
Global Urbanization and Smart Sustainable Cities
FUTRE WORLD
SUSTAINABLE WORLD
SMART WORLD
SMART SUSTAINABLE COUNTRIES, CITIES AND COMMUNITIES
SUSTAINABLE DEVELOPMENT
SUSTAINABLE NATIONAL GROWTH
SUSTAINABLE URBAN GROWTH
Columbus 2020 and the Ohio Development Services Agency held a special Columbus 2020 Investor Update where Columbus Global Connect, the Columbus Region's global trade and investment strategy, was unveiled. Brad McDearman, fellow and director of global special projects at the Brookings Institution, presented on the Global Cities Initiative.
The A.T. Kearney Global Cities Index, now in its fifth edition, provides a unique assessment of global engagement for 125 cities across all continents and regions. The companion Global Cities Outlook evaluates the future potential of those same cities based on how quickly they are improving across the leading dimensions of personal well-being, economics, innovation, and governance.
The Savills Prime Office Cost (SPOC) Index presents a quarterly snapshot of occupancy costs for prime office space throughout the world as provided by expert, local tenant representation professionals.
Colombia, key destination for new businessesprospectappt
Market research article that analyzes the opportunities for Foreign Direct Investment in Colombia. This article was written by Prospecta, a consultancy firm specialized in strategy, corporate governance and market entry based in Bogotá, Colombia
Welcome to the Cushman & Wakefield Atlas Outlook 2016,
an update on the International Investment Atlas that reviews
how the market performed last year and, more particularly,
what we should anticipate for the year ahead.
We have examined a series of questions when approaching this publication:
what are the key forces driving and transforming the global market? Who will be
the winners in this volatile environment? How should a subsequent investment
strategy be most advantageously aligned?
Of course, in a highly uncertain but fast changing world, the need for insightful
research is increased – but the task of delivering a robust and well-considered
view is made more difficult. By bringing together expert opinion from across our
capital markets, occupier and research teams around the world, we have sought
to answer this challenge and hope you agree we have delivered a concise but
thoughtful review of the state of the market and the outlook for the year ahead.
Serendipity, Microsoft Oslo and the Office Graph (London SUGUK)Antony Clay
A conceptual, relatively non-tech session on Serendipity, Microsoft Oslo and most importantly the Office Graph presented at the London SharePoint User Group, June 2014
ACCT 504 MART Perfect Education/acct504mart.comsarathkum12211
FOR MORE CLASSES VISIT
www.acct504mart.com
Case Study 1 (Part A)Analyze the impact of business transactions on accounts; record (journalize and post) transactions in the books; construct and use a trial balance) During the first month of operation of Gordon Construction, Inc., completed the following transactions:June2Gordon received $55,000 cash and issued common stock to the stockholders. Current assets
This report has been prepared by the
Cushman & Wakefiled Research team to identify the winning
cities in today’s international real estate investment market. The
report looks at the largest and fastest growing cities in investment
terms and differences in pricing, as well as crossborder demand
and activity.
WINNING IN GROWTH CITIES /ACushman & Wakefield Capital Markets Research Publi...Guy Masse
This report has been prepared by the Research and
Capital Markets teams at Cushman & Wakefield to
identify the winning cities in today’s international real
estate investment market. The executive summary
looks at the largest and fastest growing cities in
investment terms and the differences in pricing,
as well as demand and activity between sectors.
For a decade The Wealth Report has served as the industry’s leading publication documenting the performance of the luxury market and its interaction with wealth creation around the world. No other outlet covers the trends and flow of wealth as comprehensively as The Wealth Report.
The world is becoming an ever smaller place and operates more as a global marketplace.The impact of how one region performs can positively or negatively affect another. The Wealth Report offers invaluable insight into global trends and what will impact personal assets.
What cities make the best destinations for career-oriented professionals? How do locations stack up against each other?
Find out in the Career city index.
Jones Lang Lasalle Report on Global Real Estate Prospective for Third quarter of 2014.
World GDP output is now forecast to rise by 3% in 2014. The prediction has been revised lower this quarter largely as a consequence of the steep U.S. downgrade, and GDP growth now stands at a similar rate to last year.
Even before this change, emerging markets had the most dynamic outlook, continuing the post-crisis trend. But the balance is still slowly tipping back towards the developed world, where a steady upturn is in prospect.
There is no doubt that the lives of cities and of the businesses located in them are inextricably intertwined. But how closely linked are cities' economic growth and their liveability?
A survey of urban professionals conducted by the Economist Intelligence Unit shows that the idea of liveability has a number of different components. Jobs and cost of living, public transport and roads, safety and security and culture and nightlife all rank highly among our respondents' list of factors contributing to a city's attractiveness as a place to live and work.
The glittering power of cities for luxury growthAnil GROVER
The global economy is experiencing an unprecedented shift toward emerging-market cities. Here’s a road map of where luxury-goods companies should compete in the next decad
Jamestown Latin America Trends + Views Urbanization Trends in Latin AmericaFerhat Guven
Our latest “Trends and Views” piece addresses the concept of urbanization in Latin America,
and its potential impact on the region’s real estate market.
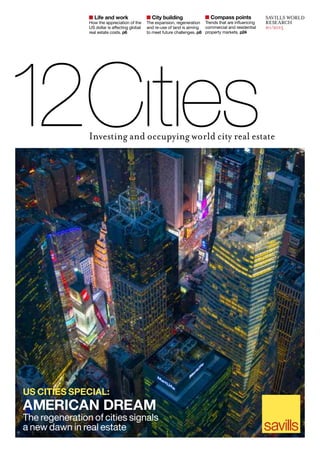
1. Investing and occupying world city real estate
City building
The expansion, regeneration
and re-use of land is aiming
to meet future challenges. p8
Compass points
Trends that are influencing
commercial and residential
property markets. p24
Life and work
How the appreciation of the
US dollar is affecting global
real estate costs. p6
SAVILLS WORLD
RESEARCH
h1/2015
AMERICAN DREAM
The regeneration of cities signals
a new dawn in real estate
US CITIES SPECIAL:
2. 2
A
s the US economy strengthens and the dollar
appreciates against a wide range of world currencies,
now is a good time to take a closer look at several of
its world cities. So, in this issue, we have added
Chicago, Miami, Los Angeles and San Francisco to our usual
world city mix. As a result, Rio, Sydney, Mumbai and Dubai are
taking a bit of a back seat in this issue of 12 Cities, but they will
return in the next edition.
Each of the additional US cities we have selected, alongside
12 Cities regular New York, have very different characteristics
but all are globally renowned.As such,they command world city
status and attract,for different reasons,a wide variety of overseas
investment while playing host to a wide range of international
companies and enterprises.
US WORLD CLASS CITIES AT A GLANCE
Chicago: Finance, publishing, medical services
San Francisco: Technology, tourism, bio-tech
LosAngeles: Media and entertainment,port services,education
Miami: Tourism, construction, Latin American regional HQs
New York: Finance, business services, entertainment
It is perhaps appropriate that our special feature is about the
physical form of world city urbanisation. US real estate trends
often lead the way for other parts of the globe and the
repopulation,regeneration and city renaissance experienced in so
many US cities over the past 20 years has been echoed in Europe
and other ‘old world’ regions, while the urban growth in many
‘new world’ cities has tended to emulate an earlier, mid-20th
century auto-oriented and high-rise US model of city-making.
We explore the latest trends and urbanisation issues faced by
each of our world cities, examine the challenges they have in
common, how some of them have been solved and consider
what lessons can be learnt from different parts of the world.
WELCOME
‘US real
estate trends
often lead
the way for
other parts
of the globe’
YOLANDE BARNES
Director of Savills
World Research
ybarnes@savills.com
Twitter: @Yolande_Barnes
H1 2015 savills.com
USedition
3. H1 2015 savills.com
3
CONTENTS
TOPLINE
How US city trends compare with
the rest of the world in terms of
economy, real estate and populations
COMMERCIAL AND RESIDENTIAL
From the rise of digital to the huge
value reductions in Moscow, we
examine the latest real estate trends
SPECIAL REPORT
The growth of urbanisation and
the extension and regeneration
challenges facing city building
COMPASS POINTS
Four trends that are shaping world
real estate and what they mean for
developers, investors and occupiers
4-5 6-7 8-13
14-15
12 CITIES ONLINE
For additional content, please visit:
www.savills.com/12cities
In order truly to compare the cost of residential and
commercial real estate across different global cities,
we use the Savills Executive Unit (SEU), which
measures the cost of housing an identical group of
people living and working in different countries.
The people who make up our SEU include one
middle-aged expat CEO, one senior expat director,
a locally employed director and four locally employed
administrative staff. They each live in different types of
household and each member of the group chooses
different types of locations and different types of property
in which to live.
To measure office costs, we place the same seven
people in an office of a small financial services firm and
again in a creative start-up – each located in the most
appropriate district for their industry type.
RESEARCH METHODOLOGY
26
SUMMARY
With rents growing in all five of our
featured American cities, investors
are increasingly looking Stateside
COVER:JASONHAWKES
SAVILLS LIVE/WORK INDEX
The latest shifts in our live/work
city rankings and the affects
of the US dollar appreciation
CITY PROFILES
An exclusive insight into the
commercial property markets of
our 12 world cities
16-23
‘In the 21st
century the
emphasis on and
need for human
interaction on
city streets is as
great as ever’
24-25
4. 4 5
H1 2015 savills.comH1 2015 savills.com
ECONOMY
Speed of US recovery sees its
investors back in driving seat
The US economy is in its fifth
year of recovery – having moved
out of recession it grew at a
faster-than-world-average rate
in 2014 and significantly out-paced the
European Union (see fig. 1).
As a consequence, real estate investment
and development became fundable in many
US locations where it had remained
moribund since 2008.
Economic recovery and the tapering of
quantitative easing have seen a pick up in the
dollar exchange rate against a basket of
world currencies,notably the euro (see fig. 2).
This has put US companies back in the
driving seat when it comes to making
overseas investments, both in new set-ups,
scale-ups and start-ups, and in real estate
purchase and leasing.
REAL ESTATE
US cities are some of the biggest
markets for property owners
Global investors and occupiers
are now more focused on the
US as a region as it looks
relatively sheltered from
some of the headwinds blowing across the
rest of the world. It may have remained
longer in recession and seen its real estate
markets fall significantly after 2007, but
both the economic and real estate recovery
have been marked.
US cities did not have the highest
levels of cross-border inward investment
in real estate during 2014 – that honour
belongs to London and Paris – but they
do have among the highest levels of
overall investment (see fig. 3).
This is because the size of the domestic
real estate market is the largest in the
world. New York tops the league at
$44.8 billion in big deals in 2014, while
Los Angeles and San Francisco were the
fourth and fifth most invested world
cities at $23.2 billion and $21.5 billion
respectively.
Most of these big deals were
indigenous: US property owners selling
to US property buyers.This makes the US
cities some of the biggest world markets
but with far less reliance on global players
than other world cities.
SnapshotofhowtheUScompareswithrestoftheworld
TOPLINE
GETTYIMAGES
POPULATIONS
San Francisco and Miami set for
double-digit population growth
The rate of economic growth in
US cities over the past five years
has generally not been as rapid
as in many of the other cities
that we look at, but they may have more
wind left in their sails as a result.
US cities generally represent stable, ‘old
world’ rates of economic growth, but have
also been suppressed of late by the broader
economic malaise experienced through the
rest of the country. The out-performer has
been San Francisco, which has led the US
tech-based economic recovery.
Most notable is the forecast rate of
population growth that San Francisco and
Miami are set to see in the next 15 years,
which approach those forecast for Shanghai
and London (see fig. 4).
Meanwhile, Chicago, Los Angeles and
New York, with a metro population of
43 million between them, are set to show
slower population growth, but already have
critical mass to easily compete on the
economic stage of world metropolises.
Source: RCA, Deals over US$10m apiece
Right: San
Francisco has
attracted a lion’s
share of new
investment in the
digital economy.
Ranked by size
of cross-border
investment
City Public listed /
REITS
Institutional User / other Private Cross-border Total investment
(US$million)
3 New York 22% 20% 7% 37% 13% 44,827
1 London 3% 17% 3% 8% 68% 37,182
4 Tokyo 41% 9% 14% 19% 17% 28,420
5 Los Angeles 12% 26% 8% 44% 11% 23,163
6 San Francisco 19% 38% 14% 21% 8% 21,471
2 Paris 15% 22% 7% 9% 46% 20,292
9 Chicago 14% 27% 8% 41% 9% 11,997
8 Hong Kong 16% 11% 19% 41% 13% 8,720
11 Singapore 64% 0% 8% 23% 5% 4,392
10 Moscow 0% 7% 25% 57% 11% 4,059
12 Miami 15% 27% 6% 49% 3% 3,531
7 Shanghai 2% 23% 40% 8% 26% 3,245
FIG. 3 Real estate investment in world cities during 2014
2007 20102006 2011 2013 2014
8%
4%
-2%
6%
2%
-4%
AnnualGDPgrowth
FIG. 1: US, China, EU and Asia Pacific economic growth 2009-14
Source: World Bank/Oxford Economics
Asia Pacific World European UnionUnited States
FIG. 2: US dollar trade-weighted index
Source: Federal Reserve
115
100
105
95
90
USdollartrade-weightedindex
0.4%
3.5%
16.9%
22.4%
9.2%
8.5%
6.5%
12.7%
FIG. 4 Global forecasted population growth 2014-2030
TOKYO
SHANGHAI
NEW YORK
MUMBAI
LONDON
Metro area population
2014 (m)
Forecast additional
population 2014-2030 (m)
Forecast %
population
growth
2014-2030
LOS ANGELES
PARIS
RIO DE JANEIRO
MOSCOW
CHICAGO
HONG KONG
MIAMI
SINGAPORE
SYDNEY
SAN FRANCISCO
DUBAI
17.1%
5.2%
6.8%
14.2%
24.2%
15.2%
7.7%
51.7%
2008
2009
2010
2011
2012
2013
2014
2015
2007
110
0%
20122008 2009
5. 6
H1 2015 savills.com
T
he cost of accommodating a
workforce in both residential
and commercial premises in
world cities has fallen over the
past year. The Savills Executive Unit – a
workforce of 14 people and their families –
now costs an average of US$75,738 per year
per person in rents and property costs,
compared to US$78,831 a year previously.
A significant component of this falling
cost is the US dollar’s appreciation against
other world currencies,which makes annual
property costs look cheaper in dollar terms.
But, even in local currencies, several
countries have seen falling rents, while
others are experiencing static or low growth.
This is good news for companies who
occupy office space and have to house their
employees – or pay wages commensurate
with local housing costs. These companies
had seen the total cost of living and working
accommodation rise by 9.4% in local
currency terms during the five years to
December 2013, but are now enjoying
dollar costs back to 2011 levels.
The three most expensive cities –
London, Hong Kong and New York – are
distinctly more expensive than the rest,
revealing their status as dominant world-
class metropolises (see fig. 5). Rents in these
cities have been pushed to high levels in the
past by a supply-demand mismatch, but are
sustained by the very strong economic
growth and rewards companies have
enjoyed from locating in these cities.
Still looking expensive in light of its
recent, relatively lacklustre, economic
performance is Paris.This is largely the result
of growing demand for central Parisian
accommodation from a variety of companies
– some of whom are seeking to ‘re-relocate’
Accommodating
the city
back from the suburbs, but finding a limited
number of premises.Landlocked by its inner
suburbs,Paris does not enjoy the same extent
of regeneration potential that vacant
docklands and post-industrial sites have
afforded, say, London,Tokyo and New York,
so has a limited commercial offering –
particularly for creative businesses.
The biggest changes in our rankings in
the past six months have been seen in the
dollar costs of the lower-tier cities, with
Moscow the most notable example. The
plummeting value of the rouble has
demoted Moscow from seventh to eighth
place, still above Shanghai but now cheaper
The appreciation of the US dollar has seen a fall
in annual desk-and-bed space costs
7
H1 2015 savills.com
OFFICE
HOME
GETTYIMAGES
$69,000Average cost per person to
accommodate a workforce in
the five US cities
than Dubai and Sydney (not featured on
the chart this issue), thanks to 25% cost
falls between June and December 2014.
Tokyo remains competitive thanks to yen
depreciation against the dollar and despite a
modest rise in office and residential rents in
yen terms. This has allowed Singapore to
rise in dollar expense terms, with it
remaining in sixth place. This rise is the
result of the pegged Singapore dollar staying
strong against the US dollar – but also rising
office rents. Singapore is a city that is still
attracting global businesses, but one where
the supply of office stock has not increased
at the same pace as occupier demand – or
residential stock.
Chicago is the second
cheapest for living and
work accommodation.
SAVILLS
LIVE/WORK INDEX
Businesses occupy
different spaces in different
buildings and these
change from city to city
– even if they are occupied
by the same company.
Similar-sized companies in
different industries may
also occupy very different
spaces in the same city.
This means that headline
comparisons of grade A
rents per square metre are
inadequate. Office workers
in the finance sector are
more likely to be densely
packed into a small unit in
Tokyo, but take far greater
space in Dubai, for
example. To build a true
picture, a variety of
property and locations
should be taken into
consideration.
Employers are also
interested in the cost of
living accommodation for
their workers. This is
particularly relevant as
upward pressure on wages
may be stronger in
locations where the
residential cost of
accommodation is high. It
will also be easier to attract
the best staff in the most
liveable, vibrant and
stimulating living spaces.
The Savills Executive
Unit (SEU) measure of
accommodation costs
takes all this into account,
as well as additional costs
such as local taxes and
rates. We think this is a
more effective measure of
city competitiveness and
value for real estate.
Source: Savills World Research
LONDON
$118,0851
3
5
HONG KONG
$113,0192
PARIS
$97,1984
SINGAPORE
$71,8626
TOKYO
$66,6997
MOSCOW
$53,1638
SHANGHAI
$43,72912
SEU Live/work cost per
employee per yearRank
SAVILLS
LIVE/WORK
INDEX
Ranking the cost of
renting residential
and commercial
space in 12 global
cities, including
the five US cities
SAN FRANCISCO
$85,598
9
10
11
LOS ANGELES
$52,137
CHICAGO
$46,588
MIAMI
$48,962
FIG. 5:
NEW YORK
$111,811
6. H1 2015 savills.com
– a force in real estate
8 9
GETTYIMAGES
The importance of cities for
many aspects of life – not just
the world of real estate – is
increasing,but what we mean
by ‘city’ varies greatly from location to
location. In some places, it is the first-
time experience of dense urban living
resulting from migration from rural areas;
in others,it is the rediscovery and reuse of
centuries-old centres of economic and
human activity. Each gives rise to a
different range of social, economic and
real estate tensions and can result in some
very different built forms.
The predominant theme in the West,or
rather in the ‘old world’ – the pre 20th
century cities of North America, Europe,
Australia and Japan – has been the
rediscovery of the city. Since the 1990s,
patterns of depopulation dating from
various points in the 20th century have
been almost universally reversed in these
old cities and businesses of many types
have once again created revenues and
wealthafterpreviousdecadesofpopulation
decline,and in some cases,urban decay.
The shift in city economies during the
mid-1980s away from manufacturing
and toward financial and business services
made the location of goods and markets
less important and once again put the
interactions of people at centre stage.This
has given cities a new currency: there is
value in human interaction and the
marketplaces that cities provide. Little
wonder that London and New York rose
from the ashes at this time to dominate
the world city scene. This economic,
geographical and financial phenomenon
had big impacts on the real estate industry
and these cities remain heavily invested
by institutions, funds, private companies
and individuals.
In the 21st century, the emphasis on
and need for human interaction on city
streets is as great as ever. The rise of
new technologies and the creative,
entrepreneurial and agglomerating
industry that has been spawned by them
is particularly in thrall to the city. Cities
not only allow for the inception,
nurturing, funding and development of
new ideas and products, but actively
provide the human experiences and
The growth of urbanisation is a global phenomenon. Half of the
world’s population now live in cities and this is forecast to grow to
nearly three-quarters by 2050. In this special feature we look at how
our 12 cities are being extended, regenerated and rebuilt, what is
working and what threatens their future, and how the availability of
land, or lack of it, is playing out in these global real estate markets
H1 2015 savills.com
37million
The metro area population
of Tokyo (pictured) in 2014
City building
‘Old world’ countries, such as
those is North America,
Europe and Japan, have seen
the rediscovery of the city.
SPECIAL
REPORT
7. 1110
ALAMY,GETTYIMAGES
H1 2015 savills.com H1 2015 savills.com
interactions that spark the disruptors in
the first place.
So cities with growing tech sectors
would appear to have assured futures, but
only if they can continue to attract young,
creative and entrepreneurial workforces
and residents. Real estate developers and
investors need to understand the drivers
of city success in these circumstances if
their location decisions are to be
profitable, and the type of real estate they
provide adds to the city’s success rather
than detracts from it.
RENAISSANCE
OR NAISSANCE?
It is perhaps appropriate to be looking at
city development and expansion in this
special US edition of 12 Cities because so
many real estate trends have emanated
from that country. Not only has the US
given the world the first new ‘automobile
cities’ zoned and organised around the
movement of traffic, but some of the
older colonial and industrial-age cities
have introduced ‘regeneration’ and
‘gentrification’to the lexicon of real estate
through the repopulation, reuse and
reinvigoration of previously run-down
inner-city areas.
It is impossible to separate the influx
of investment in cities from the influx of
workers,residents and visitors; they are all
part of the same phenomenon – city
renaissance. But in the ‘new world’,
especially the emerging economies of
Asia, the story has not been so much of
renaissance as ‘naissance’ – the birth of
whole new cities of a type and scale the
world has not seen before, sometimes
from the rubble of what was there before
and sometimes on rural farmland.
COUNTRYSIDE
The development of
surrounding natural land
as city or suburbs is most
common in the emerging economics
of the new world. A few cities, such
as Shanghai and Dubai, are still
expanding into surrounding
countryside and desert.
SEA STEALING
Some cities are so
land-constrained that they
have created it by forming
islands or an extended shoreline in
the sea. This type of expensive
development is found most frequently
in ‘new world’ cities such as Hong
Kong, Dubai and Singapore, but has
also taken place in older Asian cities
such as Tokyo, and we even found
early 20th century examples of
island-making in Miami.
CHANGE
Some cities, notably
Shanghai and Moscow,
have demolished
significant swathes of the city to build
new sectors. Tokyo also has a high
rebuild rate but at an individual plot
level, as does Hong Kong.
Existing neighbourhoods, such as
Silver Lake in Los Angeles, are
experiencing ‘creative colonisation’.
SPECIAL
REPORT
The seven
‘Cs’ of city
building
C
loser examination of
development and building
within all our world cities
(including the US cities)
reveals a rich mixture of urban forms
and a great many districts with
different characters and a vast mix of
commercial, retail, visitor and other
uses. All human life is there and the
best cities are noticeable for having a
wide variety of districts, all catering
for a wide range of different
occupants.The following pages give a
few examples of the different types of
building we found going on in our
world cities.
4.7million
Forecast additional population
in the five US cities combined
by 2030
CONVERSION
The story in most old,
established cities in Europe
and the US is of an
extensive and fully developed urban
landscape offering limited opportunity
restricted by planning policy, for
physical expansion. Economic
development, therefore, depends on
the effective use and reuse of existing
land supply. We see in almost every
case where land is constrained that
old industrial land is being reused.
London’s old docks in the east and
its disused manufacturing sites in the
outer boroughs are good examples
of this type of redevelopment and
regeneration, but this can be capital
intensive and costly, especially when
infrastructure projects, such as roads,
transit and decontamination, are
needed to open up these sites for
public use.
GAME CHANGING
Four of our world cities
– Sydney, London, Rio and
Tokyo – have either had
or will have an injection of public
money for regeneration projects by
hosting the Olympic Games in the
recent past or future. This can, and
has, been the catalyst for infrastructure
projects that these cities need and has
or will open up new areas for more
intensive urban development.
CREATIVE
COLONISATION
World cities have
responded to restrictions
on sprawling development by re-using
and reinventing existing run-down
neighbourhoods and districts.
Economic regeneration is often led by
creative people: artists, designers and
tech entrepreneurs who agglomerate
in a cheap, run-down city sector,
attracted by low rents. When
successful, many of these districts
become reinvigorated, with more jobs
and higher economic activity.
CONSERVATION
Another response to limited
land supply is to both
preserve what is already in
place and re-use and intensify its use,
recreating it as a visitor attraction and
economic generator. The conservation
and preservation of old buildings and
city districts is often organised at a
city level (or international level in the
case of World Heritage sites). It goes
against the short-term consequences
of land price inflation and resists high
bid rents for the longer-term legacy of
historic quarters. Perhaps an
unintended consequence is that this
has helped create some of the highest
value areas, as this legacy is valued by
visitors and occupants and eventually
becomes monetised.
The Venetian Islands in Miami are a good
but expensive example of city building.
1
2
5
7
6
3
4
8. ALAMY,CORBIS,GETTYIMAGES
1312
H1 2015 savills.com H1 2015 savills.com
SHANGHAI
The Bund/Xintiandi, Jewish
Quarters, Former French concession
Yangshan Deep Water Port
(above), Nanhui New City
Expo Site, New Jiangwan town,
CITIC Pacific Shipyard
Numerous locations
Jing’an, Xujiahui, Dongjiadu
Tianzifang, Moganshan Rd
2010 Expo, Shanghai Free Trade
Zone in 2013, Pudong New Area
MIAMI
SINGAPORE
Peranakan, Joo Chiat and Katong
Districts
Marina Bay
Jurong
Punggol
Tiong Bahru (above)
Singapore Sports Hub
LOS ANGELES
West Adams
Port of Los Angeles
Central City East
Downtown, Bunker Hill
Silver Lake, Echo Park
Miami Beach Art Deco District
(above)
Hibiscus, Palm and other islands
(circa 1922)
Downtown/Bayfront
Wynwood
NEW YORK
The High Line
Battery Park
Hudson Yards (above)
Williamsburg, Brooklyn
5
5
4 9
12
7
8
6
10
11
2
1
3
2
4
12
HONG KONG
Hong Kong International Airport
Kennedy Town
Most of central
Sheung Wan
10
City
buildingFrom land reclamation to big catalyst projects,
we examine the seven ‘Cs’ of city building
that are transforming our 12 cities
SPECIAL
REPORT
CHICAGO
Bloomingdale Line
Shoreline
Bucktown/Wicker Park River North
3
MIAMI ART
DECO DISTRICT:
designated a US historic
district, comprising 960
historic buildings in Miami
Beach. The postcard view
of Miami, it attracts tourists
to the bars, restaurants
and hotels they house,
and investors to the
condominium
developments that
surround it.
HUNTER’S POINT
SHIPYARD:
former Navy shipyard
under redevelopment
as a new neighbourhood
for San Francisco,
characterised by low
rise townhouses, parks,
retail and office space.
HUDSON YARDS:
a 28-acre mixed-use
development over rail
yards, comprising of
16 towers containing
more than 12.7 million
sq ft of office, residential
and retail space,
including a subway
extension, underpinning
wider regeneration of
Manhattan’s west side.
TIONG BAHRU:
one of the oldest
housing estates in
Singapore, it achieved
heritage status in
2003. Home to
markets, independent
bookshops and cafés,
it has been revitalised
by ‘hipster’ culture.
2020 OLYMPICS:
the majority of new
infrastructure will be
located in the Tokyo Bay
area, with the athletes’
village on the Harumi
waterfront. The games
are anticipated to be
a catalyst for new
condominium and
commercial development
in this traditionally
overlooked area.
LONDON
Covent Garden
Docklands and Thames Gateway
Shoreditch, Dalston
2012 Olympics
6
GRAND PARIS:
a strategic plan for the
Paris metropolitan region,
aiming to develop the
inner suburbs, reduce
inequalities and expand
the city through urban
planning, governance and
investment in transport
infrastructure.
MOSCOW
The Bolshoy Theatre, Detskiy Mir
Park Rossii
Moscow City
Ostozhenka, Patriarshie Prudy
ArtKvartal, Gorky Park
2018 FIFA World Cup
7
YANGSHAN DEEP
WATER PORT:
built to allow the
expansion of the Port
of Shanghai given
shallow waters close to
shore. Constructed on
reclaimed land attached
to islands in Hangzhou
Bay, it is connected to
Pudong New Area by
one of the longest sea
bridges in the world.
TOKYO
Tokyo Station, Marunouchi/Hongo,
‘Yanesen’
Tokyo Bay
Tokyo Bay
Toranomon
Shibuya, Harajuku,
Minami-Aoyama
2020 Olympics (above), Tsukiji fish
market relocation
9
11
SAN FRANCISCO
Presidio
San Francisco Bay
(Financial District)
Mission Bay (above), Hunter’s
Point Shipyard
Bayview
Hayes Valley/Fillmore,
Mission District
1
Conservation
Sea stealing
Conversion
Countryside
Change
Creative
colonisation
Game changing
KEY
‘Thebestcitieshave
avarietyofdistricts,
allcateringforawide
rangeofoccupants’
PARIS
Musée D’Orsay
La Defense
13th arrondissement
Canal St Martin, Belleville
Grand Paris (above)
8
9. 14 15
H1 2015 savills.com
YIELD COMPRESSION –
OR JUST HOT AIR?
Recent research by Savills, in conjunction
with Deakin University of Australia, has
taken a close look at how real income
returns to grade A office investors differ
from quoted market yields in cities
around the world. It found that a
combination of investor costs and tenant
incentives, like rent-free periods or
rebates, reduce investment yields –
sometimes very considerably.
What at first glance appears to be a
diverse range of income returns from
world cities turns out, in reality, to be a
much closer range of yields. The average
world city ‘effective yield’is 4.2%,ranging
from 6% in Chicago to 2.9% in Hong
Kong. What is interesting is that the
range around the average between cities is
HOW DIGITAL IS CHANGING
THE FACE OF CITIES
The key trend this year is the continued
rise of the tech industry in almost all of
our world cities.The telecommunications,
media and technology sector is so
important to eight of our 12 cities that we
have included them in our special Tech
Cities research programme for 2015
(savills.com/techcities).
The disruption of conventional city
economies by the digital economy is
showing up in the changing geography of
cities. The traditional financial and legal
districts are no longer those experiencing
the highest leasing activity, nor even the
highest growth in rental levels.
Even those not featured in Tech Cities
are seeing strong influence from digital
technology occupiers, with the world city
status of places like Paris and Chicago
helping to attract the human talent so vital
to their industry. As a result, demand for
‘creative space’is rising and office rents are
outstripping those for financial space in all
our world cities, except Moscow.
OFFICE TRENDS
GETTYIMAGES
COMMERCIAL
AND
RESIDENTIAL
THE RESURGENCE OF
US CITIES
The American cities featured in this issue
are experiencing high demand resulting
from economic growth, but are singularly
diverse in what they are offering occupiers.
New York and San Francisco are fast-
growing talent magnets and the most
expensive American cities for occupiers,
while Chicago continues to supply
corporate headquarters for big hitters –
even if they are digital companies.
Meanwhile, Miami has attracted the
‘eds and meds’: the research institutes and
those at the forefront of medical and life
sciences. It also draws in real estate
investment from Latin America.
Los Angeles seems to be offering
something else again: cheaper space for
backroom and corporate America in an
extensive and high-supply city. Whatever
the story,office rental growth in 2014 was
strong across all the major American
cities featured here and, with continued
GDP and jobs growth, is likely to
continue (see fig. 6).
TrendsettersHowthetechindustryishelpingtodrivetheworld’scommercial
economy,andwhyMoscowisaproblemforglobalresidentialvalue
H1 2015 savills.com
RENTS
Further evidence that US capital values
have some headroom is that, while capital
values were falling, rents have been rising
(see fig. 9). The SEU average rent for the
UScitiesisup42.6%since2008,compared
to a 19.2% rise in our 12 cities overall.
The all-cities rental index is distorted
in the short term by huge rent falls in
Moscow, totalling over 50% in
mainstream markets and leaving them
42% below their 2008 levels. With rent
reductions greater than capital value falls,
we expect yields to move out further.
Residential yields across the rest of our
cities are stable and rental growth is
broadly steady. Only Singapore has
experienced small rental falls across the
board and Hong Kong in the prime
markets. Meanwhile, Paris and Shanghai
rental growth levels are low. The weaker
fundamentals of occupier demand in these
cities make them look vulnerable to near-
term small capital value falls.
CAPITAL VALUES
The capital value of residential properties
occupied by the SEU across all 12 world
cities (including US cities) fell by 1.1% in
the second half of 2014 – the first overall
fall since 2008 (see fig. 8).
This was almost entirely due to huge
value reductions in Moscow, which
totalled 33% in just six months in US
dollar terms and pushed the all-city
average down.
Small falls were also seen in Paris and
Singapore in all sectors, and London’s
prime sector. Meanwhile, the US cities in
the group were growing by an average of
3.1% across the board,with San Francisco
the star performer, showing 7.1% in the
six months to December 2014.
The value of all residential property
occupied by the SEU now totals 31%
more than it did in December 2008.
Recovery occurred later in the US cities,
totalling 21%, which suggests that it may
have further to run.
FIG. 7 Investment market reality
FIG. 6 Office rental growth of American cities versus rest of our world cities
TOKYO
PARIS
CHICAGO
SYDNEY
SHANGHAI
LONDON (WEST END)
HONG KONG
SAN FRANCISCO
NEW YORK (MIDTOWN)
AVERAGE
SINGAPORE
LOS ANGELES (WEST)
MIAMI
STANDARD DEVIATION
3.1 2.9 -0.3
Quoted
marketyield
Savills‘net
effective’yield
Difference
5.0 3.3 -1.8
5.3 3.3 -2.0
3.8 3.5 -0.3
4.0 3.7 -0.3
4.5 3.8 -0.7
6.6 4.2 -2.4
4.7 4.3 -0.5
5.3 4.9 -0.4
8.4 4.9 -3.5
7.0 5.4 -1.6
12.5 6.0 -6.5
5.9 4.2 -1.7
2.6 1.0
smaller for these ‘true yields’ than the
more misleading quoted market yields
(which range from 3.1% to 12.5%).
It would appear that global investors
do value the ‘in the pocket’ returns from
institutional investment grade office
buildings across the foremost world cities
in much the same way. Prime grade A
offices in New York, LA, London,Tokyo
and Paris are all being bought off effective
yields of around 3.5%; Sydney, Shanghai
and Singapore, off 4.5%.
Fig. 7 shows how our 12 world cities
fare in this measurement.It shows how an
average reduction of 1.7 percentage points
is experienced by grade A office investors
when they receive actual rental income net
of costs rather than headline rent.
Chicago has the most reduced net
effective yields – 6.5 percentage points
below the quoted market yields. Hong
Kong,Tokyo and London (West End) see
the smallest reductions from market to
net effective yield at 0.3 percentage points.
So,while yield compression does seem
to have occurred in most world cities, its
extent and impact does not differ as much
as headline market yields might suggest.
Investors looking for ‘in pocket’
income returns would do well to look at
net effective yields, particularly in the
US where high gross market yields could
be misleading.
FIG. 8 SEU capital value index.
US vs All
FIG. 9 SEU rents US vs All
Index2008=100
Source: Savills World Research
World city rents US city rents
DEC2008
110
100
90
80
70
JUN2009
DEC2009
JUN2010
DEC2010
JUN2011
DEC2011
JUN2012
DEC2012
JUN2013
DEC2013
JUN2014
DEC2014
150
140
Index2008=100
Source: Savills World Research
World city capital values
US city capital values
DEC2008
130
120
110
100
90
80
70
JUN2009
DEC2009
JUN2010
DEC2010
JUN2011
DEC2011
JUN2012
DEC2012
JUN2013
DEC2013
JUN2014
DEC2014
150
140
Index2008=100
Source: Savills World Research
World city rents
US city rents
DEC2008
130
120
110
100
90
80
70
JUN2009
DEC2009
JUN2010
DEC2010
JUN2011
DEC2011
JUN2012
DEC2012
JUN2013
DEC2013
JUN2014
DEC2014
4.2%
Savills’ average world city net
effective yield
RESIDENTIAL TRENDS
Residential
Capital values
Residential
Rents
Prime grade A offices
in Paris are being
bought off effective
yields of around 3.5%.
10. Working
space
17
LONDON’S OFFICE markets
set new records in 2014,with £20.9
billion ($31 billion) of investment
deals undertaken across central
London commercial markets –
figures that eclipse the volumes
achieved in 2006/07.
In the office sector, Asian buyers
accounted for 33% of investors,with
an average lot size of £156 million,
reflecting demand from this group
for large trophy assets. This is in
contrast to an average lot size of £26
million among UK buyers, the next
largest purchasing group (21%).
The London office investment
market is especially international,
with 65% of all investment deals
coming from overseas.
Records were set in the leasing
markets, too, with 8.2 million sq ft
of space leased in the City of
London. Rents for office space
occupied by financial firms were
flat in 2014, while those for
‘creative’space increased by 8.3%.
The technology, media and
telecommunications (TMT) sector
was especially active, accounting
for 32% of take-up in the West
End alone, significantly ahead of
the five-year average of 24%. EXPERT VIEW
‘Thedriftof
occupierswest
toeastisa
trendweforsee
continuing
in2015’
PAUL TOSTEVIN
Savills World Research
ptostevin@savills.com
As global business becomes ever
more international, we take
a look at the commercial property
markets in our world cities
33%
Percentage of investors
in the London office sector
in 2014 from Asia
H1 2015 savills.com H1 2015 savills.com
Reaffirming London’s status as
one of the most global centres of the
creative industry, media and
entertainment companies have
dominated this sub-sector, and
account for 35% of TMT sector
take-up. This was followed by tech
companies,with 28% ofTMT stock
absorbed,much in East London.
The UK capital continues to be a magnet
for international investors
LONDON
1
2014 Since 2008
Financial sector office rents 0.0% 14.3%
Creative sector office rents 23.3% 32.1%
Residential rents (for SEU) 4.1% 14.7%
16
WORLD
CITIES
INDEX
JASONHAWKES
11. 1918
H1 2015 savills.comH1 2015 savills.com
THE CONSEQUENCES of
the US economic recovery, coupled
with the legacy of recent recessions,
are exemplified in New York City’s
real estate markets.
New York’s office market is the
largest in the US – when taken as a
metro area it saw $27.1 billion of
big ticket investment deals in 2014.
Just 15% of these were cross-
border, which is high for the US
but low by international standards.
The market saw the completion
of some major projects in 2014,
most notably the 3.5 million sq ft
One World Trade Center. In spite
of this, shrinking availability
characterises the office market in
the wake of recessionary low supply
and growing demand in an
improving job market.
Areas such as midtown, which
are reliant on traditional space
users such as banks and law firms,
are seeing reduced leasing activity,
which has fallen for three
consecutive quarters. Some tenants
are moving to more affordable
locations downtown, attracted by
OFFICE RENTS in Hong Kong
remained largely flat in 2014,
although performance varied by
sub-market. Office space of the
type occupied by financial firms
slid by 8% last year.
The financial services sector is
pivotal to the Hong Kong office
market, and occupier demand is
currently coming primarily from
mainland financial companies
(rather than the multinationals), a
trend compounded by existing
occupiers expanding in-house
rather than relocating.
Falling rents for financial office
space were offset somewhat by a
5% growth in office rents for
WHILE FRANCE continues to
experience a weak economic
recovery, the Paris office market
has proved to be resilient.This is,in
part, due to limited speculative
development activity, having had
the effect of restricting new supply.
Parisian office rents have grown
by 20.5% since 2008, although the
pace did slow in 2014.
Yields stand at 5%, making the
market attractive to investment,
which has rebounded with a
mixture of domestic and foreign
players. Investment by the Chinese
was up 25% in 2014 alone.
In common with other major
cities, the TMT sector is an
important and growing one in
Paris, accounting for 15% of the
annual take-up (exceeding 1,000
sq m) in the Île-de-France region
over the past three years.
A Savills survey of the French
marketfoundthatTMTemployees
are less concerned with the ‘basics’
of their office (levels of noise,
security, lighting, etc), but give
higher priority to the quality of
WiFi and leisure-related facilities
(gyms, games rooms, etc).
Understandingthesepreferences
provides insight into what occupiers
want from their office space and
what landlords/developers need to
provide to fulfil these.
AS THE city’s tech industry
continues to expand, San Francisco
is set to see a new peak of office
workers this year, overtaking levels
last achieved in the 2000 dotcom
boom. Commercial rents in San
Francisco,as measured by our SEU,
grew by 8.5% in 2014, the fastest
growth among the US cities studied
here. Since 2008 commercial rents
have grown 23.5%, second only to
Hong Kong (33.2%).
Capitalised tech and creative
firms are focused on securing the
right space in the right location to
attract talent.It is the city itself that
is attracting human capital, as
much as the new companies setting
up in it. The cost of leasing and
fitting out office space is of
WORLD
CITIES
INDEX
‘creative’ space, reflecting the more
domestic nature of that market.
Hong Kong’s importance to
China’s capital markets was
reaffirmed in November by the
introduction of the Shanghai-
Hong Kong Stock Connect,which
allows investors to trade across the
border for the first time. This has
boosted confidence and should
generate additional occupier
demand from investment and
securities firms from the mainland.
Meanwhile,the‘Occupy Central’
protestors, which disbanded in
December, appear not to have had
any major lasting impact on demand
in the office market sector.
There’s a gold rush on the West Coast as
the city attracts talent in tech and creative
SANFRANCISCO
5
A Seine market as office rents show
resilience and attract Chinese investment
PARIS
4
2014 Since 2008
Financial sector office rents 0.0% 20.5%
Creative sector office rents 4.1% 12.8%
Residential rents (for SEU) 0.8% 7.6%
Cooling continues for office space, but rise in
creative demand reflects domestic market
HONGKONG
2
Changing city geography as affordable
downtown boosts its live/work desirability
NEWYORK
3
Top: Paris real estate
hampered. Above:
Japan sees gain in
momentum.
Clockwise from far left:
Hong Kong sees creative
demand; Chinese
investment for Paris;
San Francisco attracting
tech talent; downtown
transformation for New York.
CORBIS,GETTYIMAGES
$27.1bn
Value of 2014 New York
big ticket investment deals
lower rents and tax benefits.
Downtown is transforming rapidly,
with a growing population, and
expanding retail and entertainment
offer, making it a desirable place to
both live and work.
Techisanimportantcomponent
of the market. Flush with venture
capital, tech companies are
operating with a unique set of
guidelines that were not previously
representative of the typical
corporate occupier in Manhattan.
For these tenants, the cost of
space is secondary to the pursuit
of talent.
As a consequence,tech firms are
paying top rents for poorer-quality
space, simply to have an office in
the ‘right’location.
secondary importance to the future
of the place itself. By contrast,
‘traditional’ space users (banks, law
firms, etc) are making much more
modest lease commitments at a
time when many companies and
residents are becoming increasingly
concerned about being priced out.
On the development side,rising
labour and construction costs are
taking their toll on new projects.
Massive new developments, such
as Apple’s new HQ in Cupertino,
Facebook’s campus in Menlo Park
and Google’s projects around
Mountain View, are contributing
to rising development costs across
the bay area.
San Francisco’s buoyant leasing
marketfuelledasurgeofinvestment
activity last year. The city was
second only to Manhattan,
recording an increase of 265% over
2013 volumes according to RCA.
Chinese investors have been
particularly active in the market –
those from Asia as a whole
accounted for 42% of purchases by
value in 2014.
8.5%
Rise in San Francisco’s
commercial rents in 2014
2014 Since 2008
Financial sector office rents -8.0% 14.0%
Creative sector office rents 5.0% 52.4%
Residential rents (for SEU) -10.5% -13.0%
2014 Since 2008
Financial sector office rents 8.3% -3.3%
Creative sector office rents 8.3% 15.0%
Residential rents (for SEU) -3.0% 33.2%
2014 Since 2008
Financial sector office rents 2.8% 6.2%
Creative sector office rents 14.2% 40.9%
Residential rents (for SEU) 1.1% 66.1%
12. 21
EXPERT VIEW
‘Momentumin
occupieractivity
isexpectedto
bemaintained
through2015
andbeyond’
YOLANDE BARNES
Savills World Research
ybarnes@savills.com
THE OFFICE market in
Singapore declined significantly
after 2005, which is why it was
unaffected by the slowdown in
GDP growth seen in 2014.
Office rents increased, on
average, by 12% following a rise in
office leasing and sales activity,
with sustained broad-based
demand from new firms and
expanding businesses, mainly from
the IT and telecommunications
industry and legal service providers.
Demand for smaller spaces (less
than 10,000 sq ft) from real
economy companies (production
of goods and services) continued to
dominate the market.
Rents are still well below their
2008 peak so development activity
has been relatively slow and the
resulting tight supply situation will
give landlords a window of
opportunity in 2015 to maximise
20
WORLD
CITIES
INDEX
IN MOSCOW 2014 saw a boom
in new office development, with
grade A and B supply exceeding
more than 1 million sq m over the
course of the year. But this proved
to be badly timed given the
economic conditions and global
investor sentiment in Russia.
Economic sanctions and a
plummeting oil price have taken
their toll on the market.
Record new supply, combined
with a falling number of deals, has
resulted in rising vacancy rates and
falling rents.
Many companies are seeking
to renegotiate lease terms.
Unsurprisingly, global companies,
particularly those in the finance
12%
Growth in Singapore’s office
rents in 2014
TOKYO HAS been enjoying some major in-
bound investment from foreign players,
attracted by Abenomics, but investment
activity remained predominantly domestic in
2014. With prime cap rates approaching
historic lows, questions are being asked about
the sustainability of current conditions.
Nonetheless, rents remain well below their
2007 levels, lending conditions are favourable,
and a cushion exists between headline office
yields and the 10-year government bond
interest rate. This means there is scope for
Tokyo cap rates to move further into line with
those of Hong Kong and Singapore; capital
growth is expected.
The city continues to enjoy positive
developer sentiment surrounding the 2020
Olympic Games, and the infrastructure boost
and opening up of new dockside locations that
willensue.MoriBuilding,oneofJapan’sbiggest
developers, intends to develop 10 mixed-use
projects in central Tokyo worth an estimated
¥1 trillion ($8.3 billion) over the next decade.
This is a confident move and a sign of faith in
the future of the city’s real estate market.
Momentum in occupier activity is expected
to be maintained through 2015 and beyond, on
the back of cyclical and economic tailwinds.
The volume of available space suitable for large-
scale corporate relocations is dwindling. This
will not only encourage landlords to demand
higher rents for new leases, but also accelerate
the absorption of buildings newly supplied to
the market in the near term. Rents are rising
across the market as vacancy rates fall, with
particularly strong growth recorded in the
creative and tech sector over the past year.
and business services sector, have
seen the sharpest contraction in
activity. By contrast, and in
common with many of the other
global centres monitored here, the
TMT sector is the most active and
accounted for around a quarter of
all leasing activity last year.
Due to current economic and
geopolitical issues, the outlook for
the Moscow commercial property
market is poor.
Companies are likely to be extra
cautious in their activity, with
expansion or relocations put on
hold. This, set against the glut of
new supply the market saw last
year, will put further downward
pressure on rents in 2016 and 2017.
returns in 2016/17. However, new
office supply will increase and likely
suppress rental growth again.
Occupier demand is being driven by
new-to-market companies and
those that already have a presence in
the city, as opposed to international
finance and business services firms
seeking a regional base.
This will mean more small-
space requirements with flexible
leases. Savills expects CBD grade
A rents for small spaces (less than
10,000 sq ft) to trend upward by an
estimated 12.9% in 2015.
H1 2015 savills.com
Stop-start in the office market as rents
remain below peak of 2008
SINGAPORE
6
Turning point as faith in
future of market returns
TOKYO
7
Cold snap as economic sanctions and
fall in oil price take toll on market
MOSCOW
8
GETTYIMAGES
H1 2015 savills.com
Far left: Singapore sees
office rents rise.
Left: Foreign investors
attracted to Tokyo.
Below: Economic conditions
take toll on Moscow.
2014 Since 2008
Financial sector office rents -6.3% -25.5%
Creative sector office rents -27.3% -3.1%
Residential rents (for SEU) -29.2% -31.7%
2014 Since 2008
Financial sector office rents 0.0% -11.1%
Creative sector office rents 10.0% -21.4%
Residential rents (for SEU) 4.1% -12.0%
2014 Since 2008
Financial sector office rents 14.9% -41.9%
Creative sector office rents 9.1% -21.9%
Residential rents (for SEU) -3.7% -6.9%
13. 2322
H1 2015 savills.com
ALTHOUGH SUSTAINED
job growth supported steady
demand for office space in 2014,
with leasing activity at its highest
levels since 2006, Los Angeles is
an occupiers’ market (with the
exception of Westside).The overall
vacancy rate is high and tenants
have multiple opportunities across
various sub-markets, meaning it is
a prime location for space-hungry
companies seeking cost savings.
This is the one market where
US dollar appreciation may be
suppressing investment as it makes
prices look more expensive to
overseas purchasers. In the
investment markets, deal volumes
ended 2014 18.2% down on 2013
levels, at $7.9 billion.This is 61.1%
up on 2012 volumes, but still well
below the $12.9 billion achieved in
2007. Buyers from Asia, namely
Hong Kong and China,dominated
cross-border activity in the city
(20% of all big-ticket deals last year
were from overseas).
Three factors will continue to
restrain activity in Los Angeles
during 2015: ongoing downsizing
and ‘rightsizing’ in the professional
services and corporate sectors; the
drive to less expensive space in
secondary and tertiary markets;
and new construction levels that
are increasing in line with the
economic recovery.
WORLD
CITIES
INDEX
THE OFFICE market in
Shanghai is undergoing a major
transformation. This year is
expected to see the completion of
15 new projects in the ‘core’market,
adding 9.5 million sq ft of space,
and 22 projects in the‘decentralised’
market, adding a further 17.4
million sq ft of new supply.
This represents levels of supply
never seen before, and is likely to
put downward pressure on rents,
especially in the core market as
cost-sensitive occupiers are drawn
to projects in outer areas.
Shanghai is using large-scale
infrastructure investment to unlock
these decentralised business
districts as it strives to meet the
demands of a rapidly expanding
population and economy.
Hongqiao Transportation Hub
is one example, anchored by
Shanghai Hongqiao Railway
HEALTHCARE HAS become
an important part of many office
markets around the US, including
South Florida.This occupier group
has been especially attracted to
suburban locations within easy
reach of knowledge infrastructure.
The Scripps Research Institute,
the Max Planck Institute and
nearby Florida Atlantic University
have all been instrumental in
anchoring life sciences in the region.
Momentum should help sustain
leasing activity in the coming years
as the region strives to become less
dependent on its cyclical core
sectorssuchashousing,construction
and international banking.
Despite increasing optimism on
the part of landlords, there has
been limited new speculative
development in the office sector.
This is in stark contrast to the
boom in new condominium
developments that Miami has
experienced in recent years, fuelled
by investment from Latin America.
Those office developments that are
in the pipeline are generally
a component of larger, mixed-
use schemes.
With cap rates plummeting in
markets such as Manhattan, San
Francisco and Los Angeles,
many investors are turning to
secondary markets such as South
Florida, where yields are higher
(5.5%-6% for the type of space
monitored here).
In the investment market,
volumes are up 64.6% on 2013,
with $1.6 billion of big-ticket deals
undertaken last year. Major cross-
border investment has come from
Hong Kong, Germany and Brazil,
although in far smaller volume
than the foreign investment seen in
the city’s residential sector.
H1 2015 savills.com
CHICAGO IS a city where big
corporate international and multi-
nationals go to thrive. It is on this
basis that Chicago has been sharing
in the nationwide tech boom.
The city enjoyed a number of
major leasing deals from West
Coast-based tech firms including
Google,Yelp and Uber.
Even local firms, such as
Braintree Payment, had its recent
expansion in Chicago enabled out-
of-town by San Francisco-sourced
investment. This combination of
demand and capital supported
Chicago’s downtown leasing
market throughout 2014 and
resulted in average rent increases of
7.1% last year.
A wide range of domestic
and international investors are
supporting Chicago’s investment
sales market, which, in turn, is
providing landlords with added
incentive to maintain current
asking rents.
Investment transaction volumes
ended the year up 6% over 2013
levels, totalling $6.1 billion.
This is 55% above 2012 volumes,
but some 41% below their heady
2007 peak when $10.3 billion big-
ticket office investment deals were
undertaken.
Strong market conditions are
bringing with them intensified
construction activity.
Developers are focusing on
smaller conversions catering to
tech and creative firms in River
North and Far West Loop, and a
separate set of more traditional
glass and steel structures.
Many of the tech conversions
are clustering around Google’s new
offices in the West Loop.
Station, one of Shanghai’s four
main railway stations, and the
largest in Asia by floor space. The
hub ties together the city’s domestic
airport with the main high-speed
railway terminal, a long-distance
coach terminal and two existing
metro lines.
Thefirsttwoofficedevelopments
launched here in 2014, aiming to
attract companies from industries
most crucial to the development of
Shanghai and the Yangtze River
Delta area,spreading the economic
benefits beyond the city itself.
In the short term these moves
will slow rental growth further and
may mean a cheaper ride for
occupiers. They are designed in
anticipation of and to ensure future
long-term growth,so should still be
of interest to far-sighted investors,
despite low yields and slow income
growth in the near term.
Balancing act as occupiers’ market see
opportunities for space-hungry companies
LOSANGELES
9
Momentum in ‘eds and meds’ should help
leasing activity for South Florida
MIAMI
10
Big players in technology help to support
downtown leasing market
CHICAGO
11
2014 Since 2008
Financial sector office rents 2.7% 7.7%
Creative sector office rents 11.6% 10.8%
Residential rents (for SEU) 6.5% 32.0%
The dragon pauses for breath as new project
completion sees high levels of supply
SHANGHAI
12
GETTYIMAGES,SHUTTERSTOCK
18.2%
Fall in LA deal volumes
compared to 2013 levels
Clockwise from right:
Chicago shares in tech
boom; Shanghai expects a
year of project completion;
Miami helped by ‘eds and
meds’; LA sees demand
for office space.
2014 Since 2008
Financial sector office rents 4.1% 5.2%
Creative sector office rents 0.0% 6.8%
Residential rents (for SEU) 1.1% 18.2%
2014 Since 2008
Financial sector office rents 4.0% 7.1%
Creative sector office rents 11.3% 3.7%
Residential rents (for SEU) 8.0% 39.2%
2014 Since 2008
Financial sector office rents 2.7% -16.2%
Creative sector office rents 8.4% 13.7%
Residential rents (for SEU) 8.4% 27.0%
14. 25
H1 2015 savills.comH1 2015 savills.com
Globaltrendsthatareshapingworldrealestateand
whattheymeanfordevelopers,investorsandoccupiers
24
PRIZES FOR SECOND PLACE
Quantitative easing since 2009 has led to
yield compression and a consequent surge
inrealestateprices,resultingincompetition
for opportunities in conventional asset classes in key
cities.Private and sovereign wealth,as well as new Asian
funds, joined the melee and demand for readily
investable assets has soared – against a background of
recessionary development inactivity and consequently
limited supply. Yields are back to record lows in many
first-tier cities.
We anticipate the rise of second-tier, second sector
and secondary property as buyers seek out less
heavily-invested cities showing good economic
growth where returns can be achieved. Higher yields
are available in secondary markets, even in first-tier
cities where some prime to secondary spreads have
rarely been greater.
Even the more conventional institutions will have
to venture outside their comfort zones simply to
become fully invested, competing with private wealth,
private companies and sovereign wealth.On this basis,
we like asset classes that have been less fashionable
lately: main street retail in good US centres, secondary
CITY: A COMMERCIAL ENTITY
‘New world’ cities have been growing as a
consequence of inward migration: from
rural to urban areas. In the ‘old world’,
cities seem to be experiencing inward migration because
populations have returned to formerly depopulated
urban areas. We see that, for some key commercial and
residential users,the city itself has become a commercial
entity, capable of adding more value to an enterprise
than a single building or business park.
In global markets and industries where access to
human capital is more important than access to
monetary capital, the value of location is more about
what a place is than where it is. Homogenous, out-of-
town business parks do not attract the most creative,
skilled and in-demand workers. If the success of an
enterprise depends on creating intellectual property,
then cities that allow for chance meetings, imaginative
encounters and the exchange of ideas are likely to be
more productive than segregated work environments.
FIG. 10 Total real estate investment activity
2008 2014
$40
$35
NEWYORK
$30
$25
$20
$15
$10
$5
$0
LONDON
TOKYO
LOS
ANGELES
PARIS
SAN
FRANCISCO
HONG
KONG
CHICAGO
MIAMI
SHANGHAI
SINGAPORE
MOSCOW
Transactionvolume(billions)
$45
Source: RCA
THE RISE OF THE US
Stronger than expected GDP growth, job
creation and rising incomes have all been
positive for real estate markets in the
US so real estate recovery has become more firmly
established in many locations.
US real estate markets are highly domestic and are
not reliant on overseas investors, despite attracting
foreign capital. This means that the strengthening
dollar does not discourage investment, even if US real
estate is becoming relatively more expensive on the
world stage. Perversely, this strength will even
encourage some investors looking for safe-haven stores
of wealth in solid denominations.
Asian investors and others are beginning to see
their own region and some world cities appear fully
valued, so are now casting their net toward the
US. American cities with an international
reputation,and the right stock,will attract
more Asian buyers in 2015, despite a
EXPECT THE UNEXPECTED
IN EUROPE
As the dollar becomes the currency of
choice for real estate investors, appetite
for euro-denominated assets is impaired by the
ongoing saga within the European Union and the
‘Overall, the prospects
look good for continued
real estate recovery’
EU US Germany UK Greece
FIG. 11 Performance and forecasts
6
4
2009
2
0
-2
-4
-6
-8
-10
2010
2011
2012
2013
2014
2015
2016
2017
2018
GDPannualpercentagechanges(%)
2008
2019
2020
Source: Oxford Economics
stronger greenback.Domestic US funds will be pushed
toward smaller cities – especially those with a
particularly strong recovery, regeneration or economic
story.Our world ‘secondary and second-tier’prediction
will therefore play out in the US as well.
threat of a Greek exit. But this may cause some
investors to miss out on excellent recovery performance
in key European city real estate markets.
Averygoodexampleofsecond-tiercityperformance
was shown in 2014 by Dublin. A combination of
discounted values, misplaced euro worries and a
stronger than expected economic recovery made it the
best-performing European city of 2014.
The key drivers will be re-pricing and economic out-
performance by certain cities. Germany’s out-
performance tends to be hidden within some dismal
eurozone forecasts, but is likely to continue in 2015.
German cities where wealth is created and stored, like
Dusseldorf,or which attract human capital and growing
population,like Berlin,are likely to out-perform.
Fully discounted European cities, where there will
be some economic growth, may also surprise on the
upside. A distinct characteristic of recovering markets
can be sudden, high rental growth from a low base. In
cities where recession has meant no development,
especially those with naturally supply-limited historic
cores, demand upturn is met by supply shortage
putting upward pressure on rents and paving the way
for capital growth.
The benefits of agglomeration in world cities are the
mixing and gathering of people from around the globe.
The best cities combine arts,entertainment and culture
with a benign business environment and wide range of
finance, consultancy, administrative, legal and other
support structures. In the short term, competition for
assets has suppressed yields, but economic and rental
growth should still provide returns for investors.
Longer-term growth depends on the sustainability of
these cities and their capability to continue attracting a
talented workforce.
Threats to a city’s magnetism might be characterised
as anything that starts to drive people out.Factors could
be environmental: poor living conditions, pollution or
uninspiring surroundings; they could be cultural or
economic: job loss, brain drain or over-zealous
immigrationpolicies.Realestatecoststhemselves
may start discouraging people from settling
and could enable cheaper cities to out-
compete for talent.
industrial estates with longer-term potential in key
expansion locations, other potential change-of-use
buildings and land,mixed-use development on intense
urban sites, student housing in Europe, distribution
warehousing and resort developments in global regions
where leisured middle classes are burgeoning.
1 3
2 4
OUTLOOK
Compass points
On the downside, low oil prices will suppress some
growth in American cities isolated from the rest of the
economy,notably Houston.Intractable socio-economic
issues may continue to press on others, like Detroit.
Overall,however,the prospects look good for continued
real estate recovery, improved investment performance
and rental growth,resulting in increasing domestic and
overseas investor activity in many US cities.
15. 26
SUMMARY
U
S cities are of growing interest
and importance to global
investors because GDP growth
is strong, along with the US
dollar and real estate markets.
Rents in all five US cities grew between
2009 and 2014, even though capital values
were falling or weak over most of the same
period.‘New world’cities led GDP growth –
London was top of the ‘old world’, Paris and
Tokyo the lowest performers.
US cities attract high levels of investment
but this is mainly domestic and they have a
lower proportion of cross-border deals than
London, Paris and Shanghai, for example.
The costs of accommodating a workforce
in the 12 cities has fallen since last year,
partly due to US dollar appreciation – the
average for residential and commercial
accommodation is $69,000 per person per
year, which is about the same as the average
cost of our other world cities ($70,355).
Thetotalaccommodationcosts(residential
and commercial) in the top four cities –
London, Hong Kong, New York and Paris –
are closer than they have been for a while, all
at around $100,000 per person, per year.
San Francisco is the most expensive US
city after New York at $85,598 per person,per
year, ranking between Paris and Singapore.
It has seen high demand for living and
working accommodation, largely from the
tech and creative sector,but has limited space.
LA,MiamiandChicagoaremuchcheaper
on the world stage, ranking alongside Dubai,
Moscow and Shanghai. The plummeting
rouble has demoted Moscow to ninth place
and further rent falls and currency weakness
may push it even nearer the costs of its next
rival,Shanghai.
The rediscovery and regeneration of urban
living has been an important story for our
world cities, particularly those in the older,
established economies, which had seen post-
industrial decline and deprivation.
The seven ‘Cs’
of city building
We have identified
seven different
types of city
building found in
our world cities:
1.
Countryside
2.
Sea stealing
3.
Change
4.
Conversion
5.
Game
changing
6.
Creative
colonisation
7.
Conservation
The rise of the USWith rents growing in all five of our featured American
cities, investors are increasingly looking Stateside
H1 2015 savills.com
GETTYIMAGES
One World Trade
Center, New York.
16. H1 2015 savills.com
27
28,000 EMPLOYEES ACROSS A NETWORK OF OVER 600 OFFICES IN MORE THAN 60 COUNTRIES
UNITED
KINGDOM
& IRELAND
ENGLAND
IRELAND
JERSEY
NORTHERN
IRELAND
SCOTLAND
WALES
EUROPE
AUSTRIA
BELGIUM
CROATIA
FINLAND
FRANCE
GERMANY
GIBRALTAR
GREECE
ITALY
LUXEMBOURG
MONACO
MONTENEGRO
NETHERLANDS
NORWAY
POLAND
PORTUGAL
RUSSIA
SERBIA
SPAIN
SWEDEN
SWITZERLAND
ASIA PACIFIC
AUSTRALIA
CHINA
HONG KONG
INDIA
INDONESIA
JAPAN
MACAU
MALAYSIA
MYANMAR
NEW
ZEALAND
PHILIPPINES
SINGAPORE
SOUTH KOREA
TAIWAN
THAILAND
VIETNAM
MIDDLE EAST
& AFRICA
BAHRAIN
KENYA
MAURITIUS
MOZAMBIQUE
NAMIBIA
OMAN
QATAR
SEYCHELLES
SOUTH AFRICA
UNITED ARAB
EMIRATES
ZAMBIA
ZIMBABWE
AMERICAS
MEXICO
PANAMA
US
CARIBBEAN
ANTIGUA &
BARBUDA
BARBADOS
CAYMAN
ISLANDS
GRENADA
ST KITTS &
NEVIS
ST LUCIA
AMERICAS
EUROPE
ASIA PACIFIC
AFRICA
US, MEXICO &
CARIBBEAN
51OFFICES
Savills global presence
MIDDLE EAST
& AFRICA
271OFFICES
UNITED
KINGDOM
& IRELAND
109OFFICES EUROPE
53OFFICES
ASIA PACIFIC
121OFFICES
The 12 Cities report is published on behalf of Savills plc by Seven, seven.co.uk. This report is for general informative purposes only.
It may not be published, reproduced or quoted in part or in whole, nor may it be used as a basis for any contract, prospectus, agreement
or other document without prior consent. While every effort has been made to ensure its accuracy, neither Savills plc nor the publisher
assume responsibility for effects arising from this publication. Savills and the publisher accept no liability whatsoever for any direct or
consequential loss arising from its use. The content is strictly copyright and reproduction of the whole or in part in any form is prohibited
without written permission from Savills research. Investment advice: The information and opinions contained in this magazine do not
constitute professional advice and should not be relied upon. Specific advice relating to your individual circumstances should be obtained.
For more information, please visit: www.savills.com
Yolande Barnes
Director
+44 (0) 20 7409 8899
ybarnes@savills.com
SAVILLS WORLD RESEARCH TEAM
Paul Tostevin
Associate Director
+44 (0) 20 7016 3883
ptostevin@savills.com