Download as PDF, PPTX
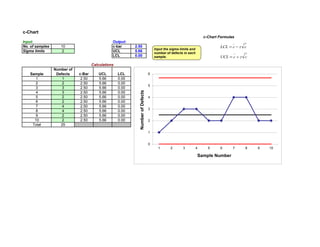
This document presents the results of a c-chart analysis of 10 samples. The average number of defects (c-bar) across all samples was 2.5, with upper and lower control limits of 5.66 and 0, respectively. The number of defects was recorded for each sample, ranging from 1 to 4 defects, with a total of 25 defects across all samples.


