Download as PDF, PPTX


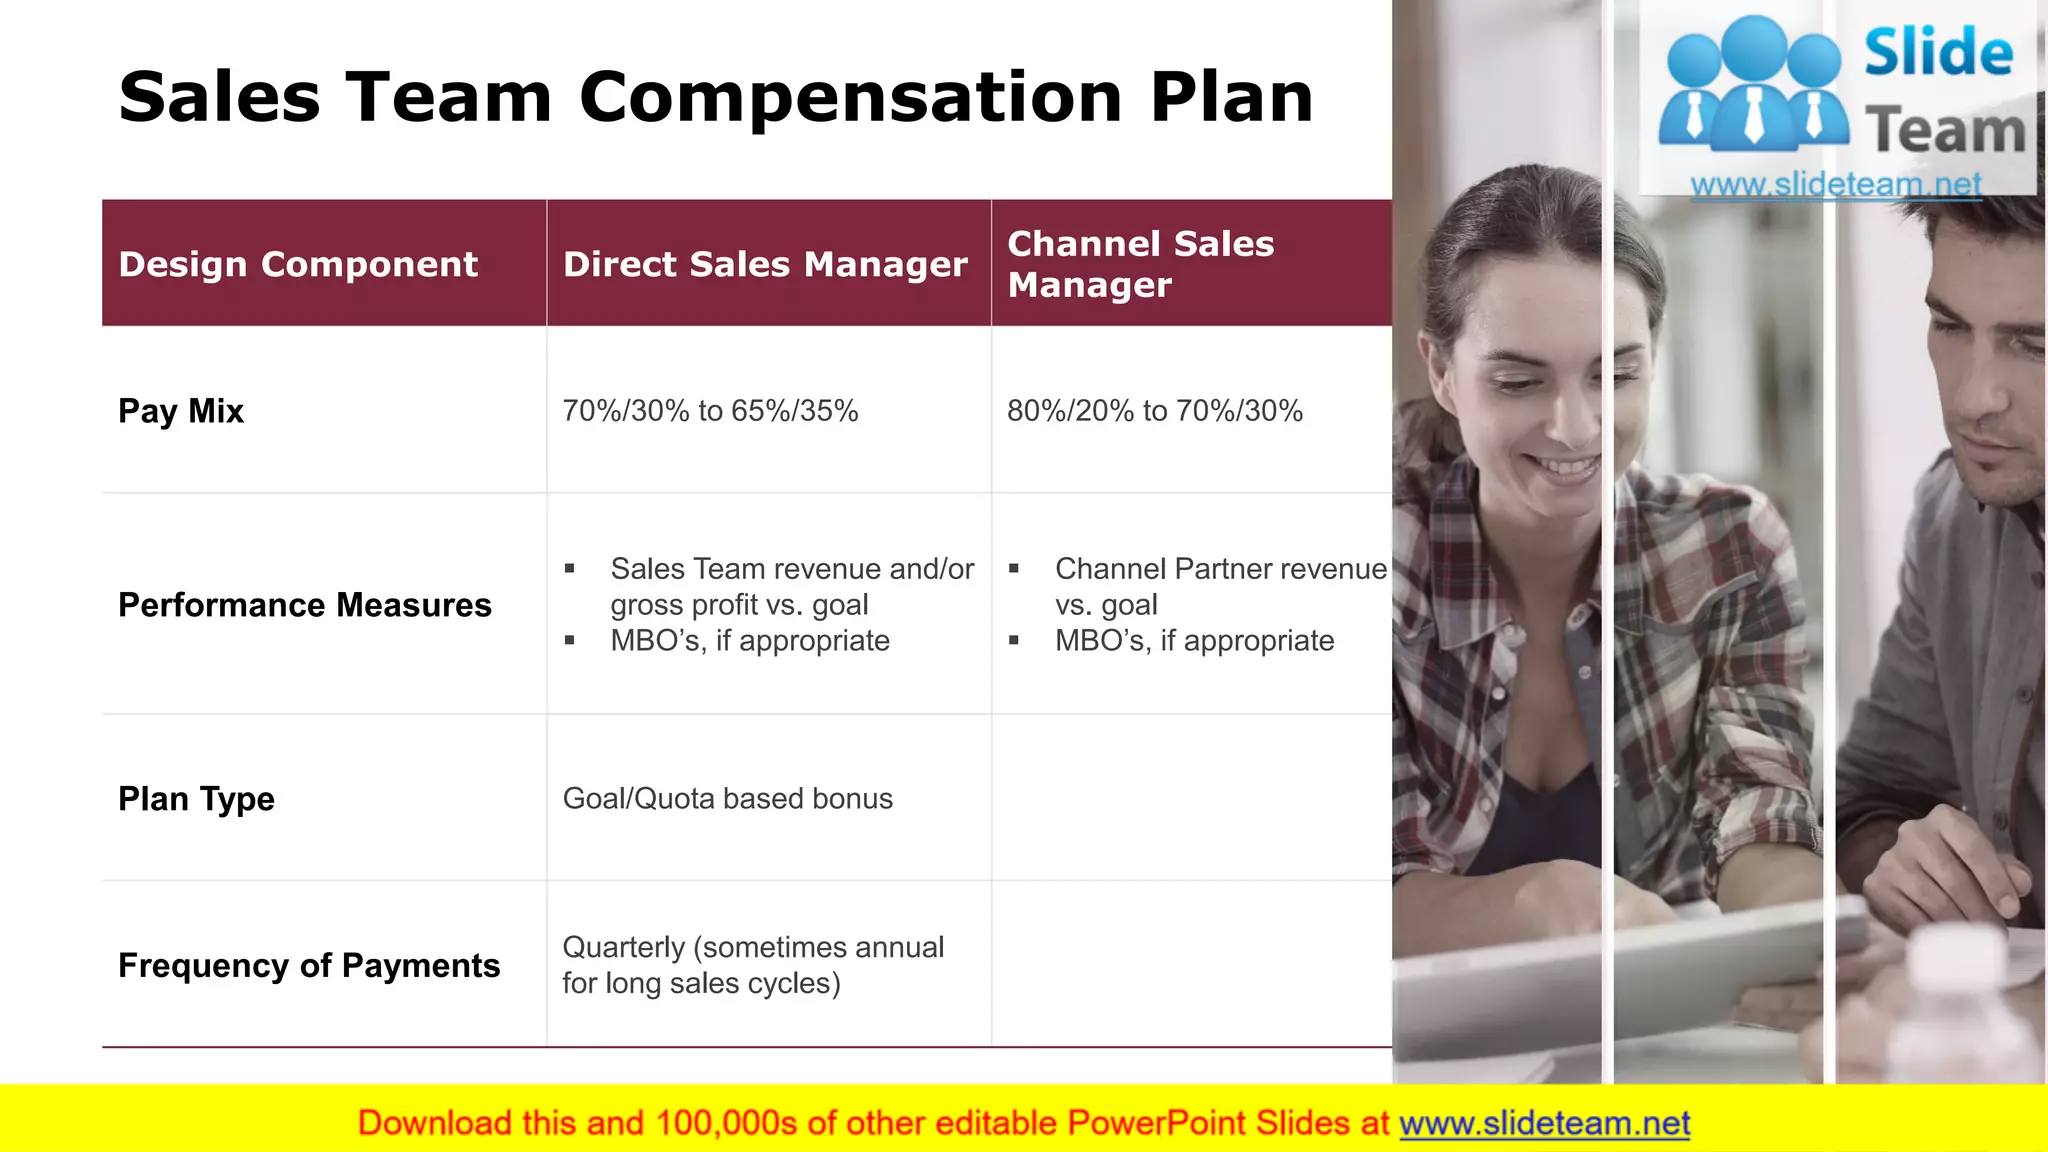


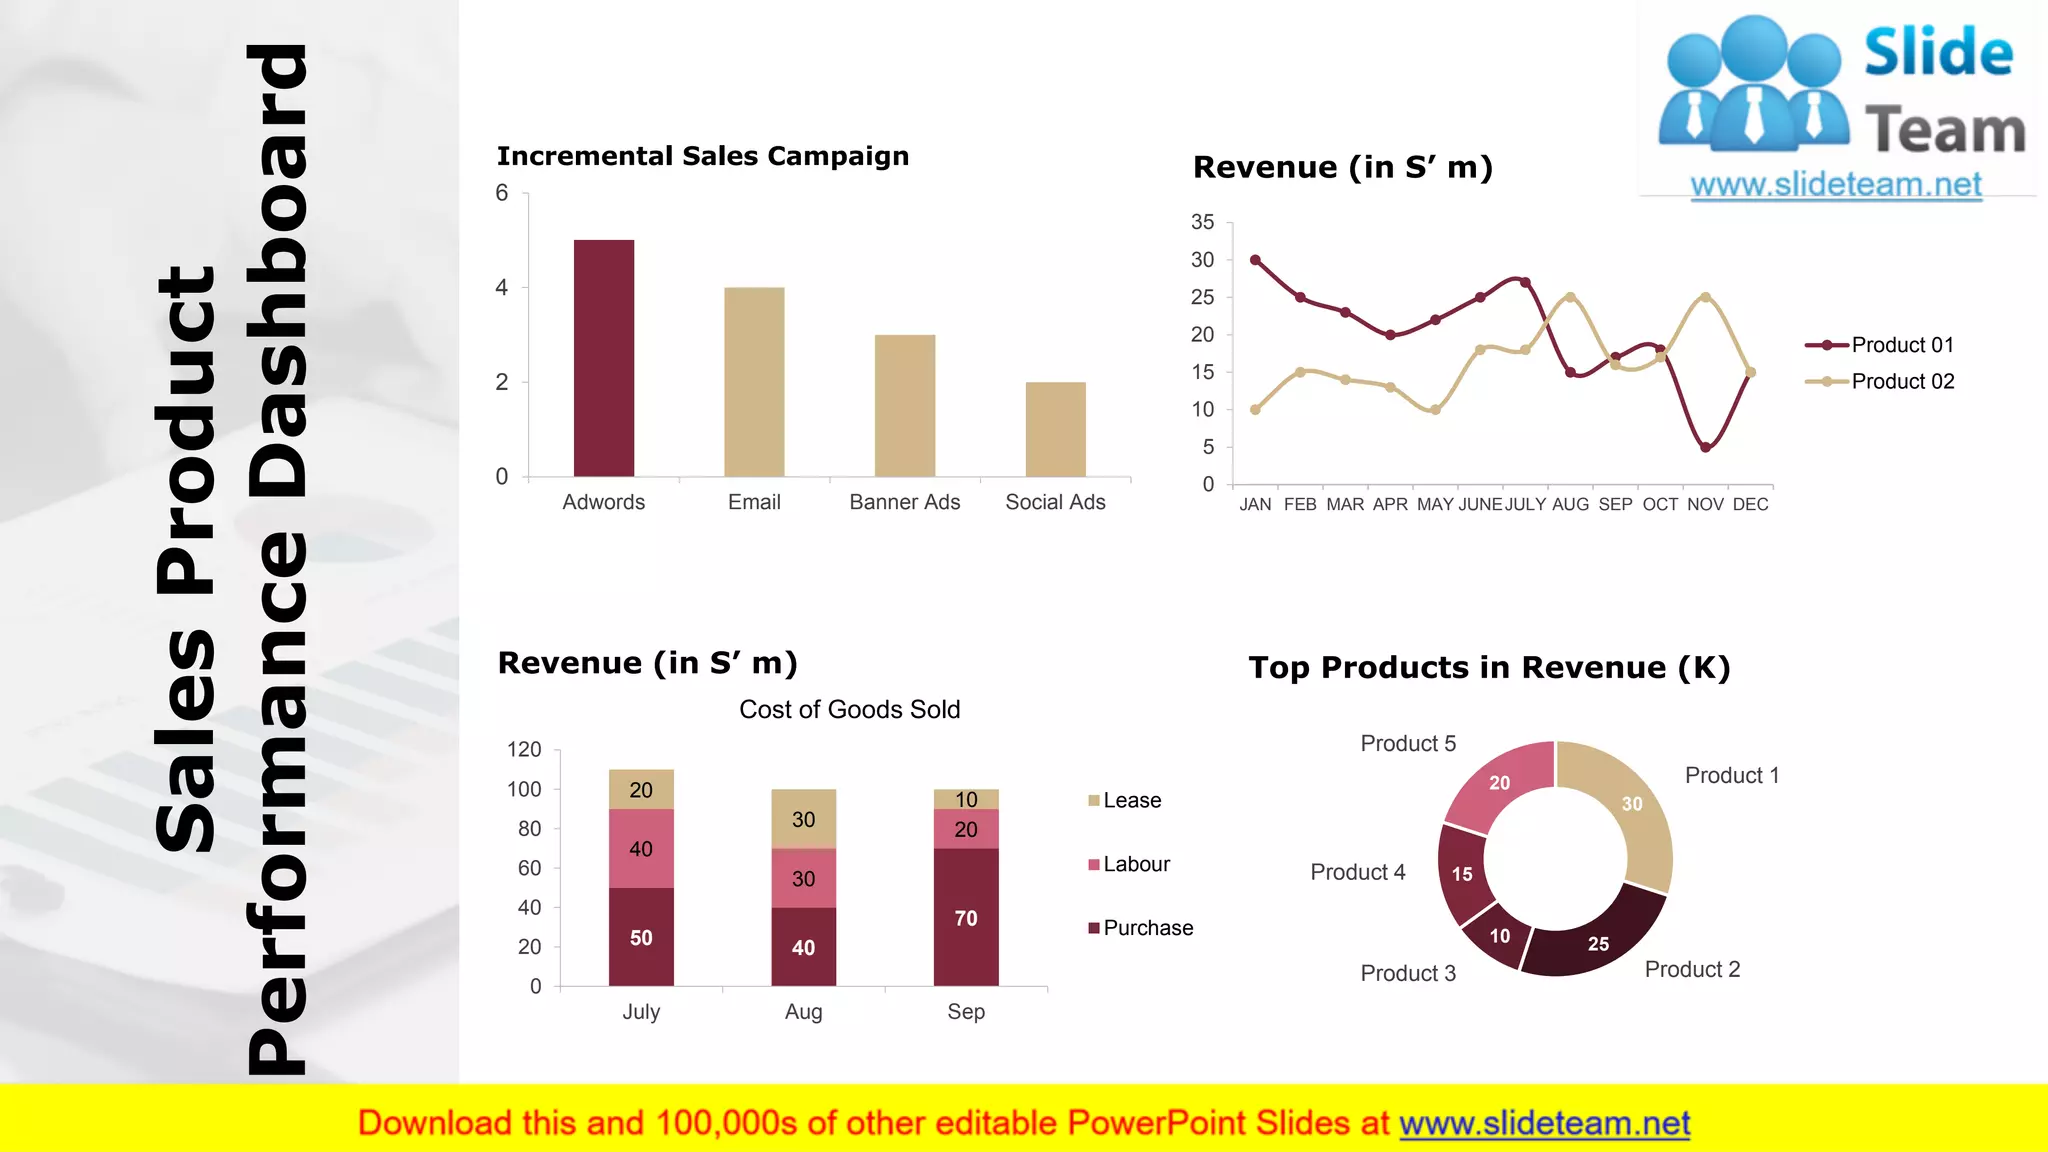


The document provides an evaluation of business performance, including financial highlights such as revenue, net profit, and gross profit margins over the fiscal years 2018 to 2020. It also outlines the company's services, sales team compensation plan, upcoming projects, and tools for sales promotion, while addressing potential roadblocks. The content is designed to be fully editable for customization to fit the audience's needs.


