

![Thank You! Gateway Court Suite 10 81 - 91 Military Road Neutral Bay, Sydney NSW 2089 AUSTRALIA ABN: 21 069 371 900 Phone: + 61 2 9953 3000 Fax: + 61 2 9953 3105 [email_address] www.ssw.com.au](https://image.slidesharecdn.com/06ssis-100915054912-phpapp01/75/Business-Intelligence-with-SQL-Server-62-2048.jpg)

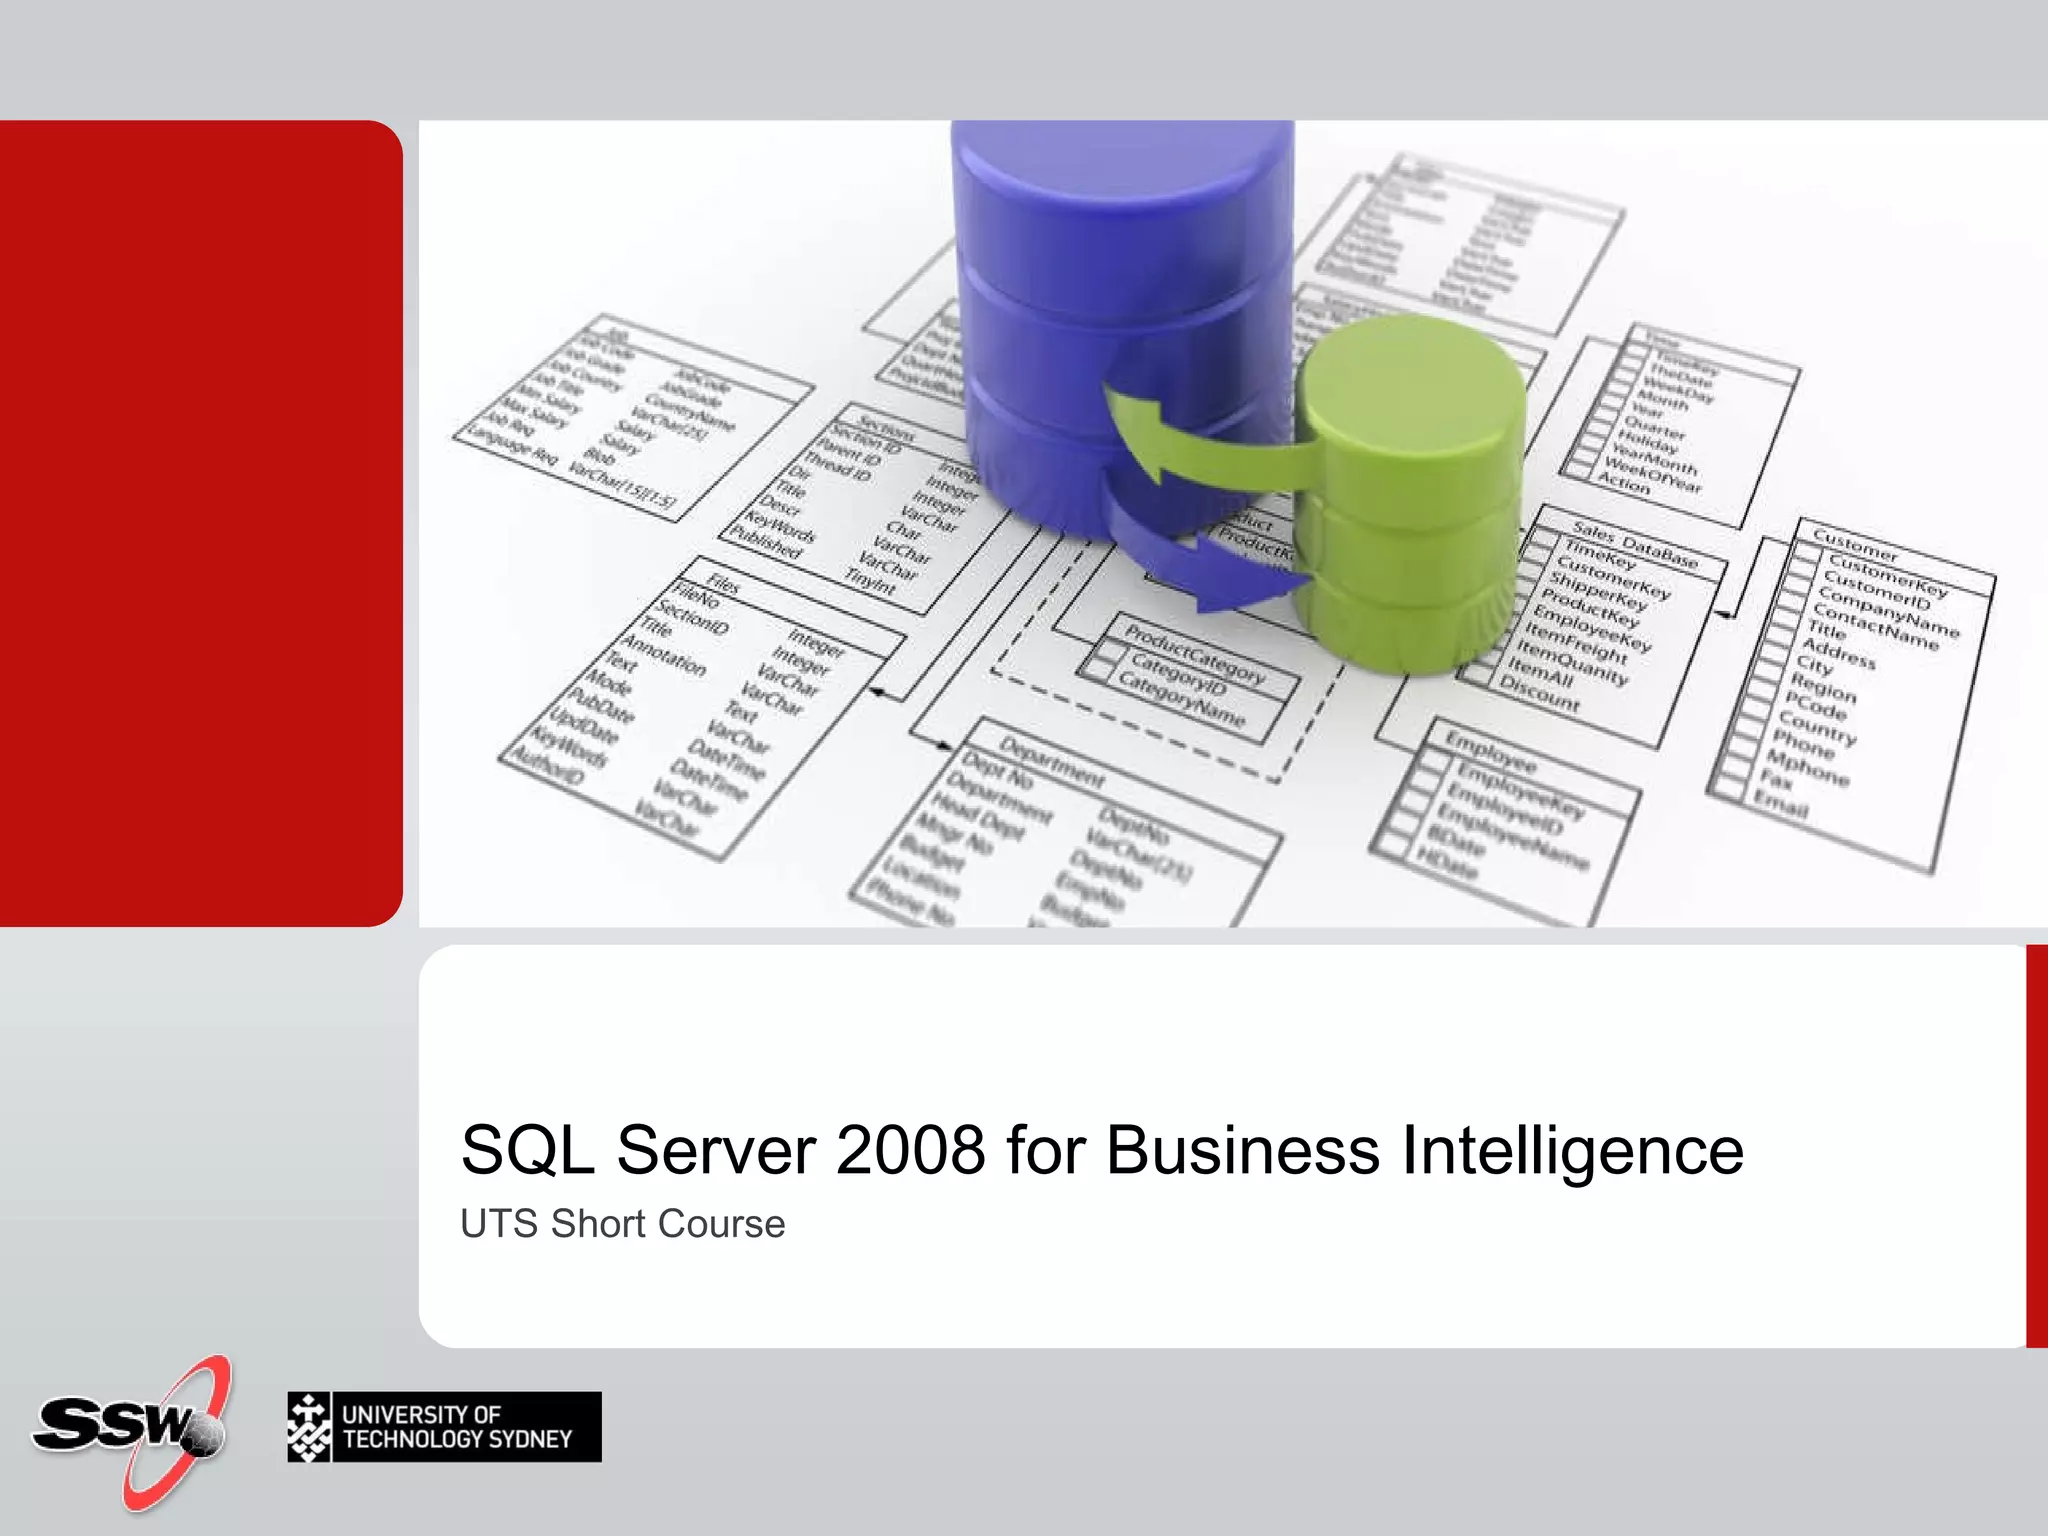
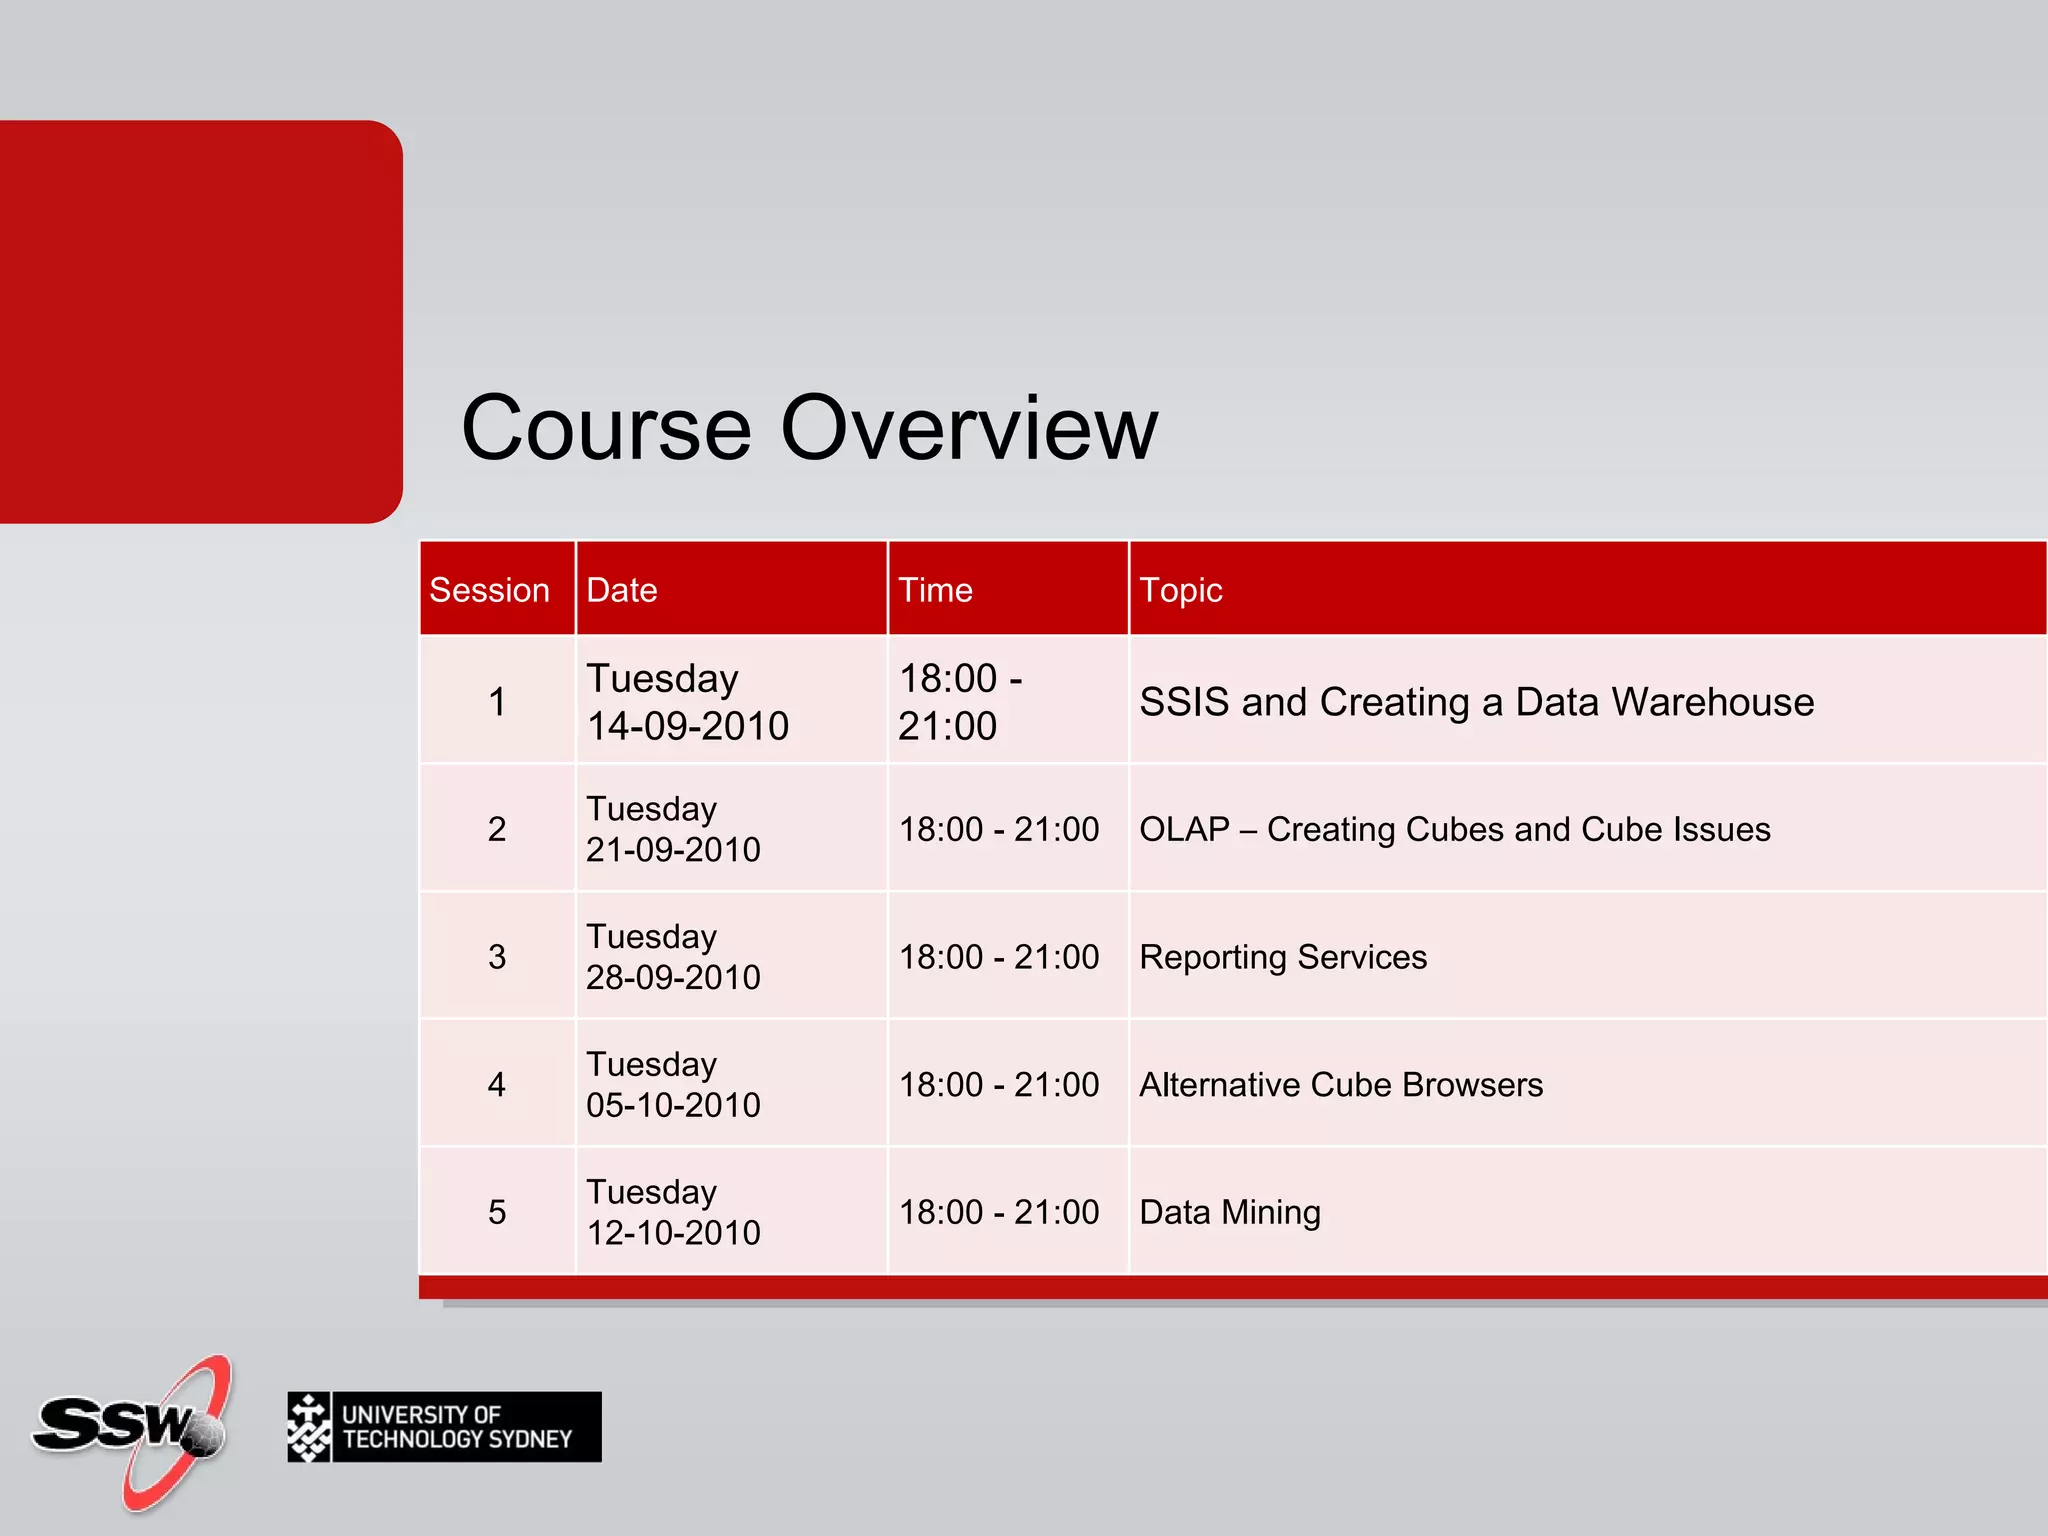
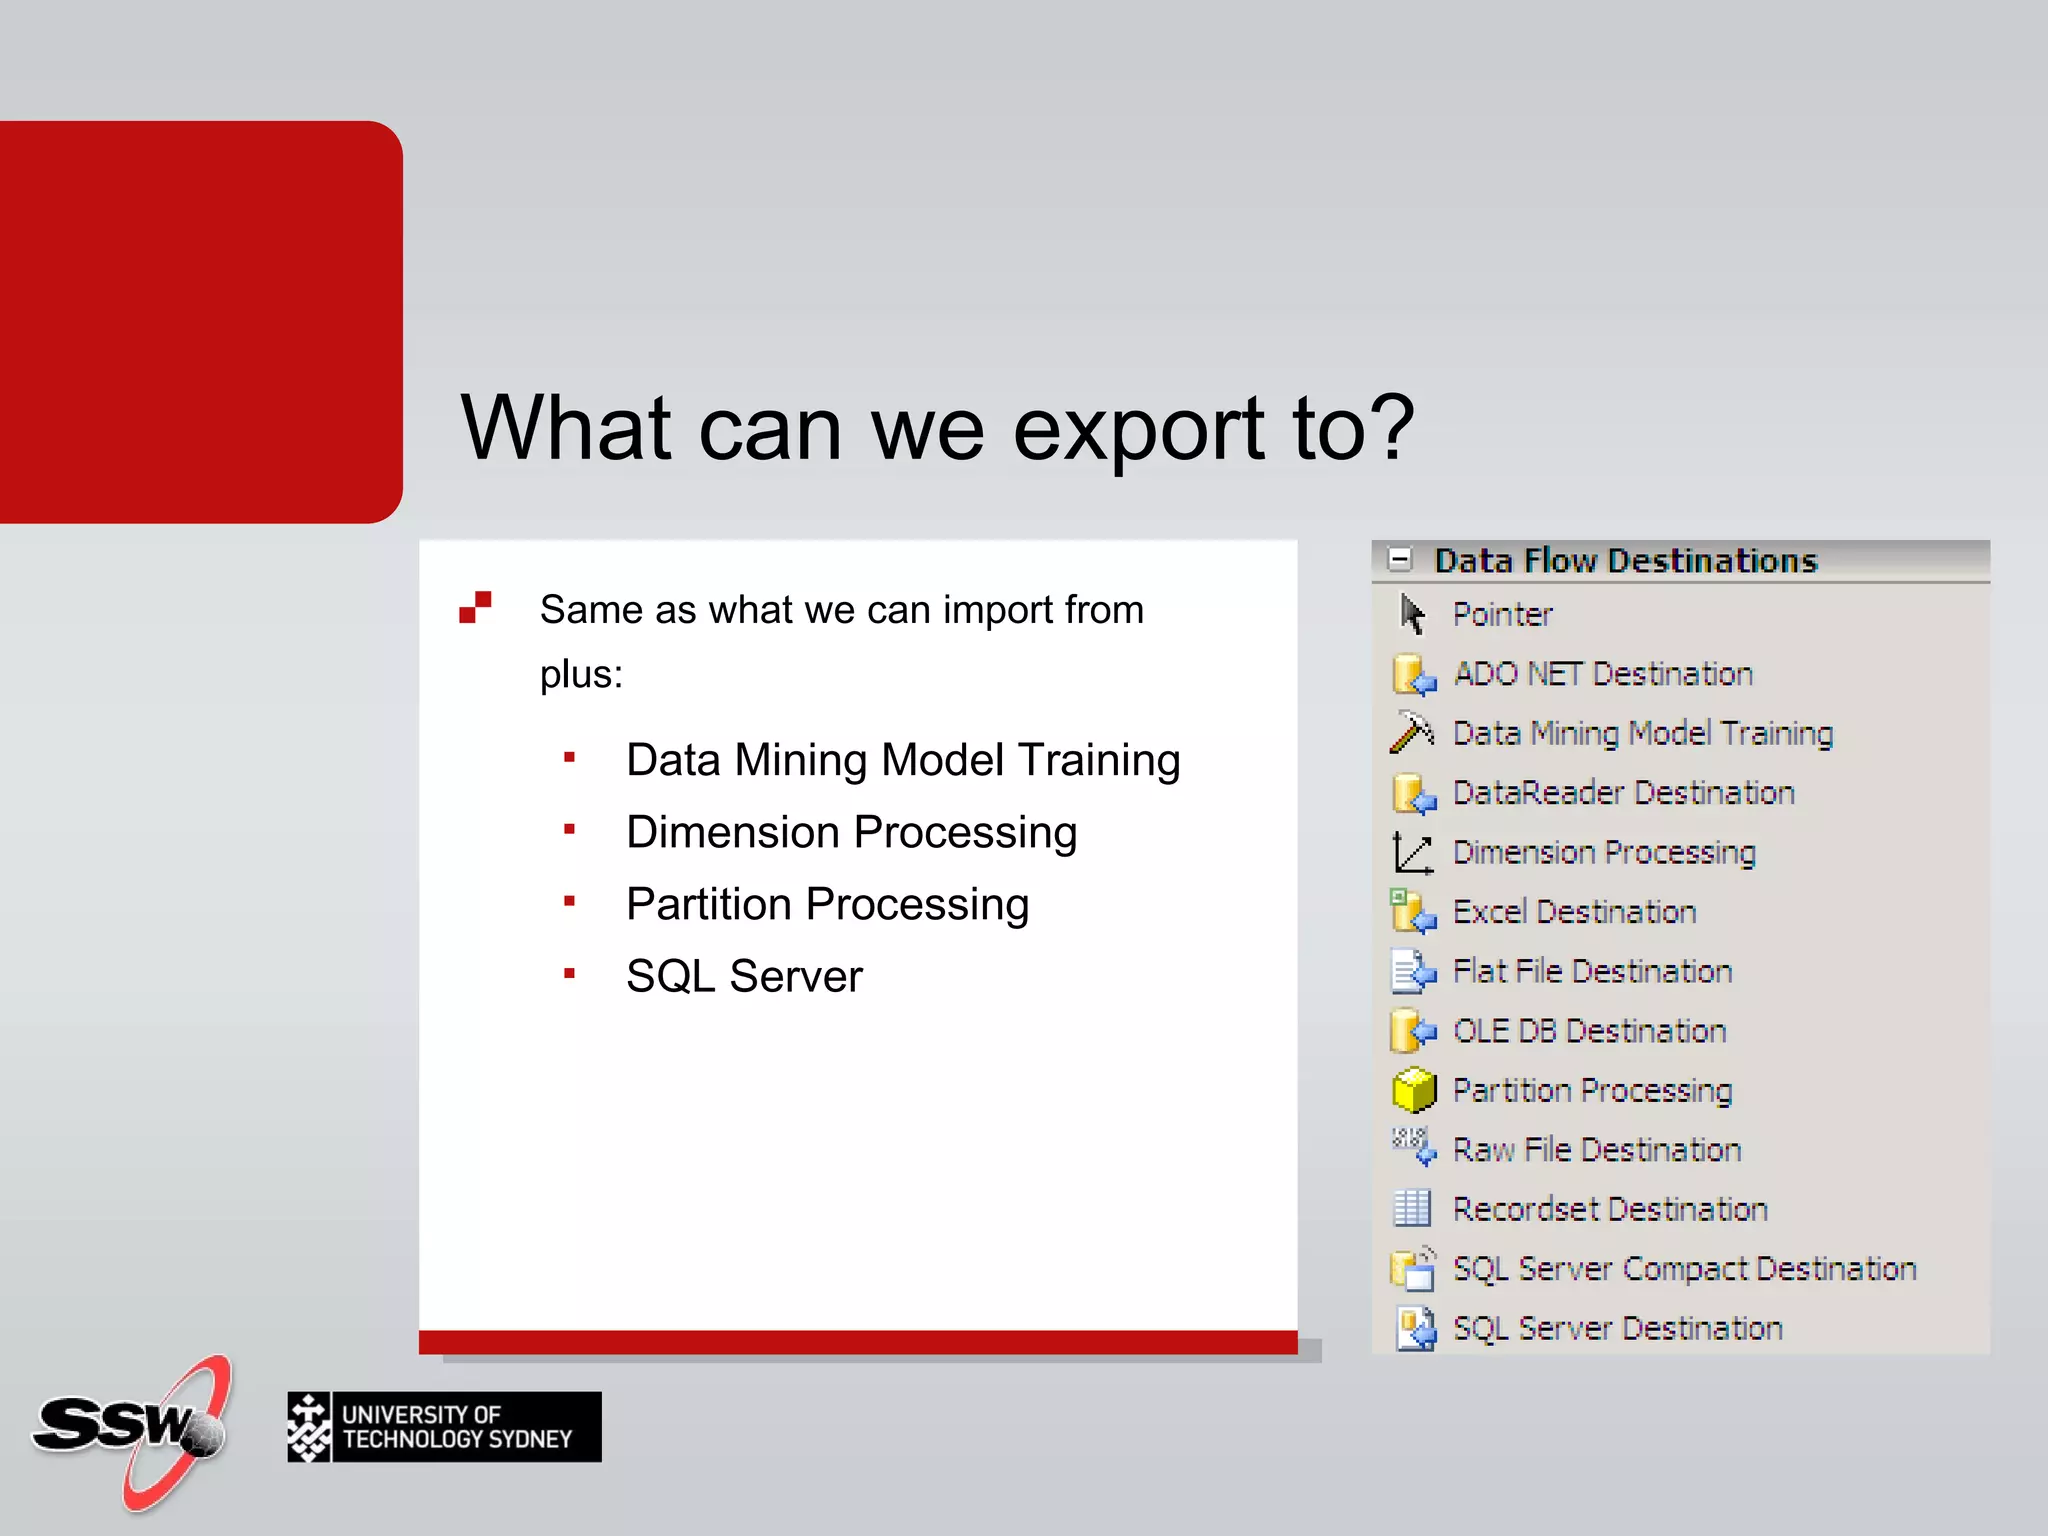
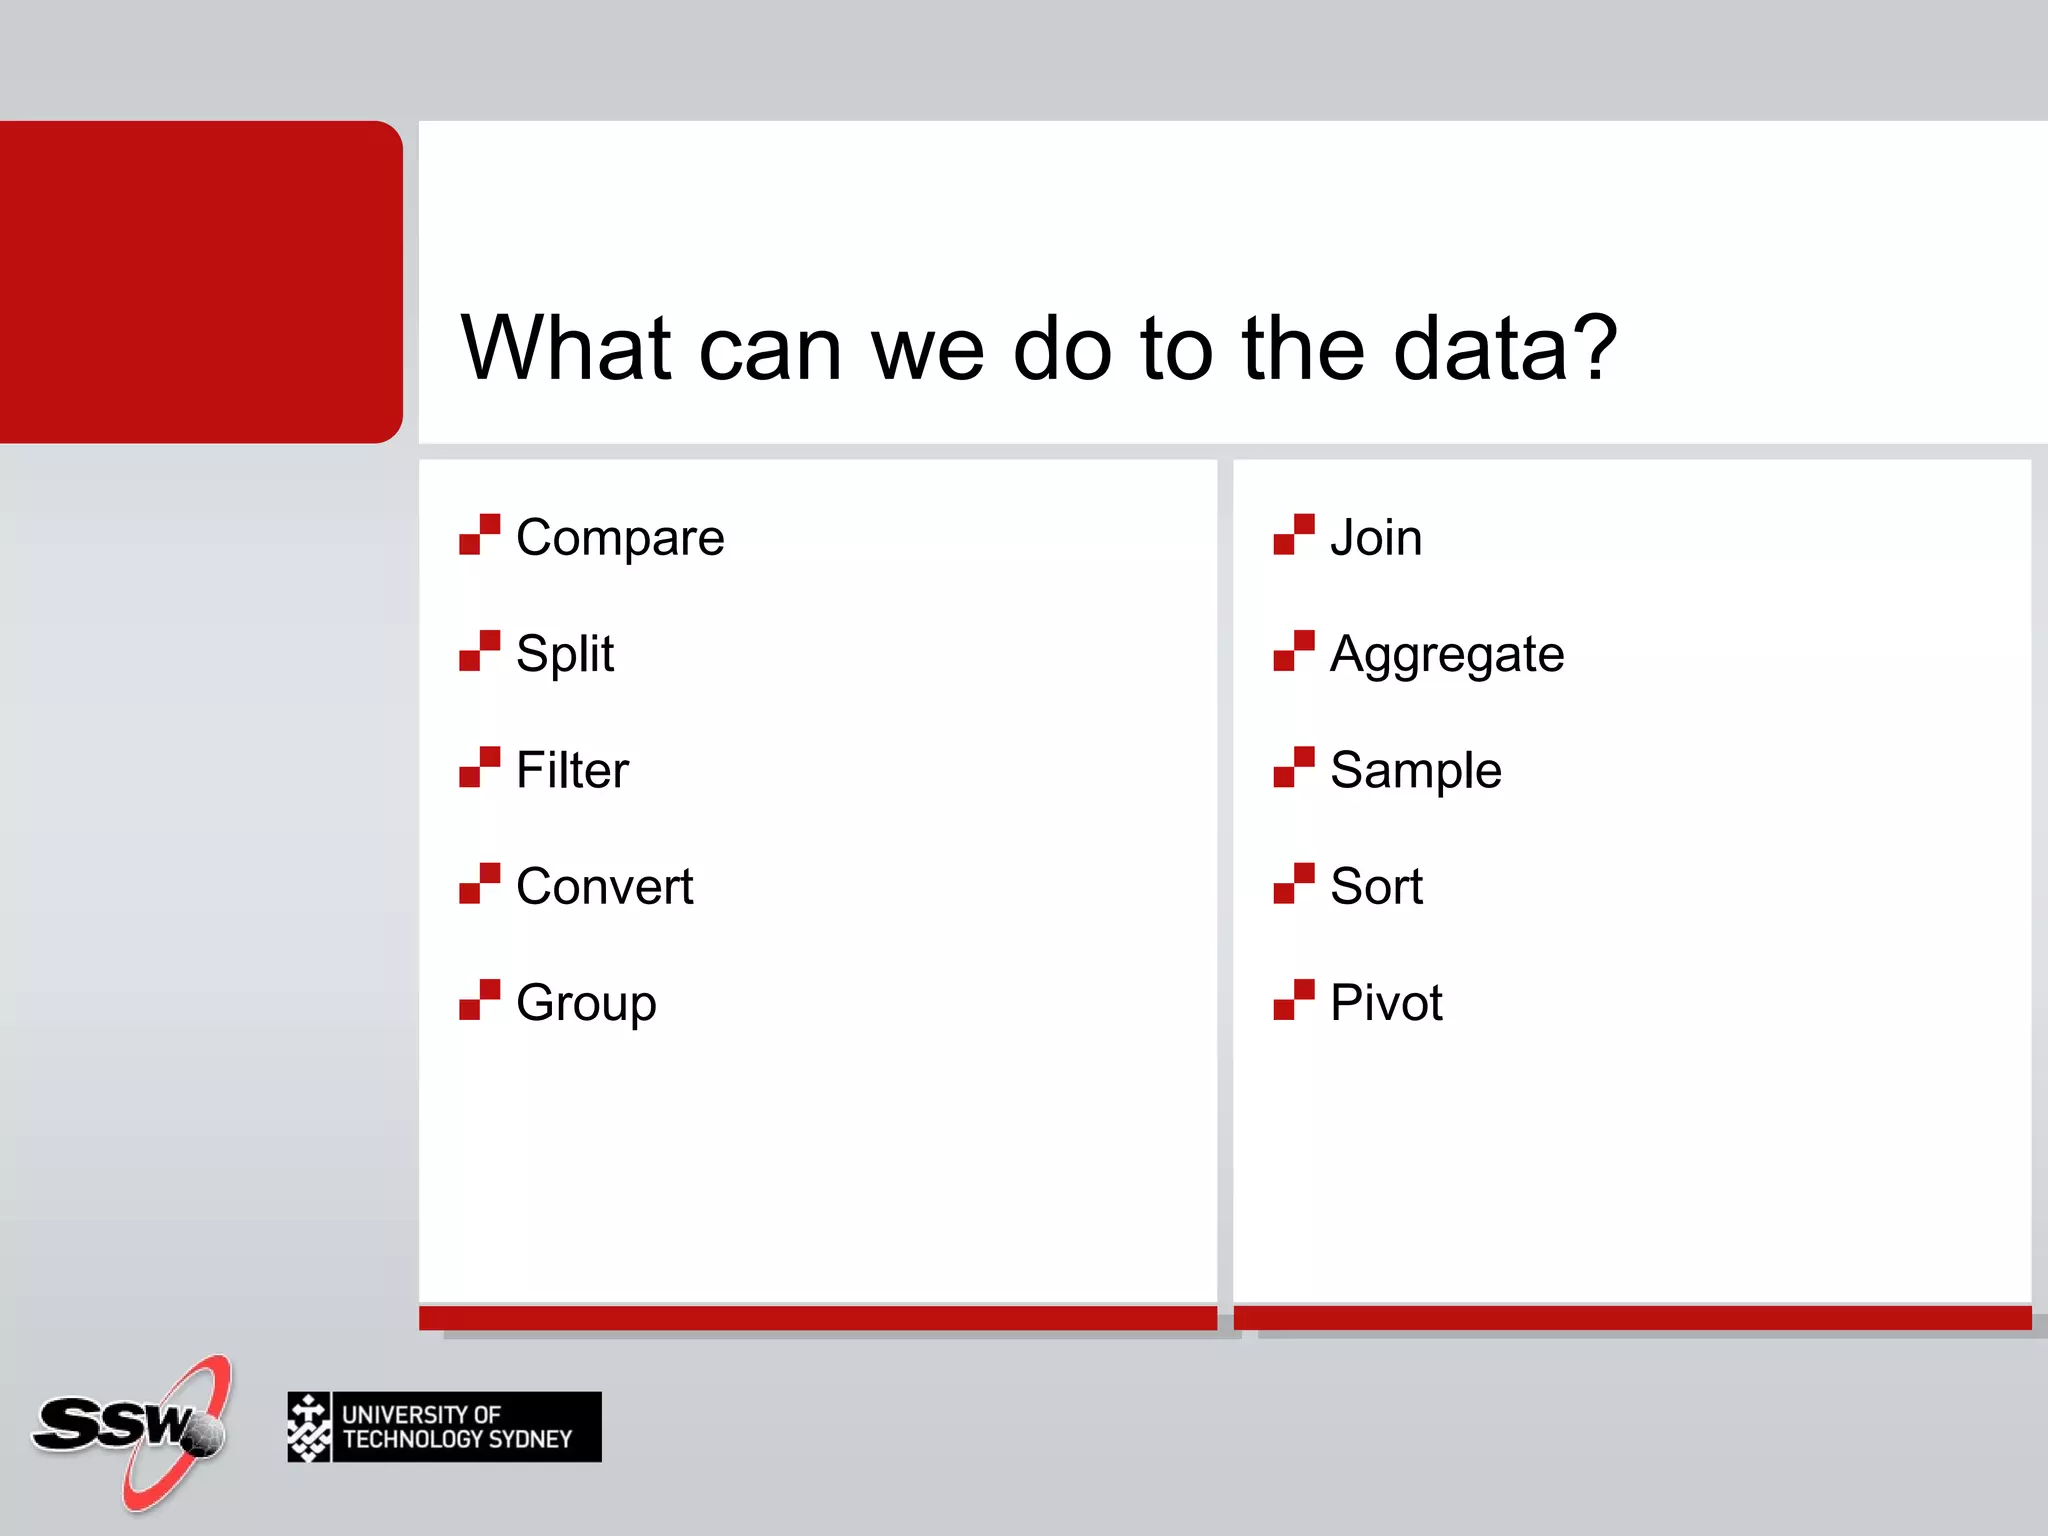
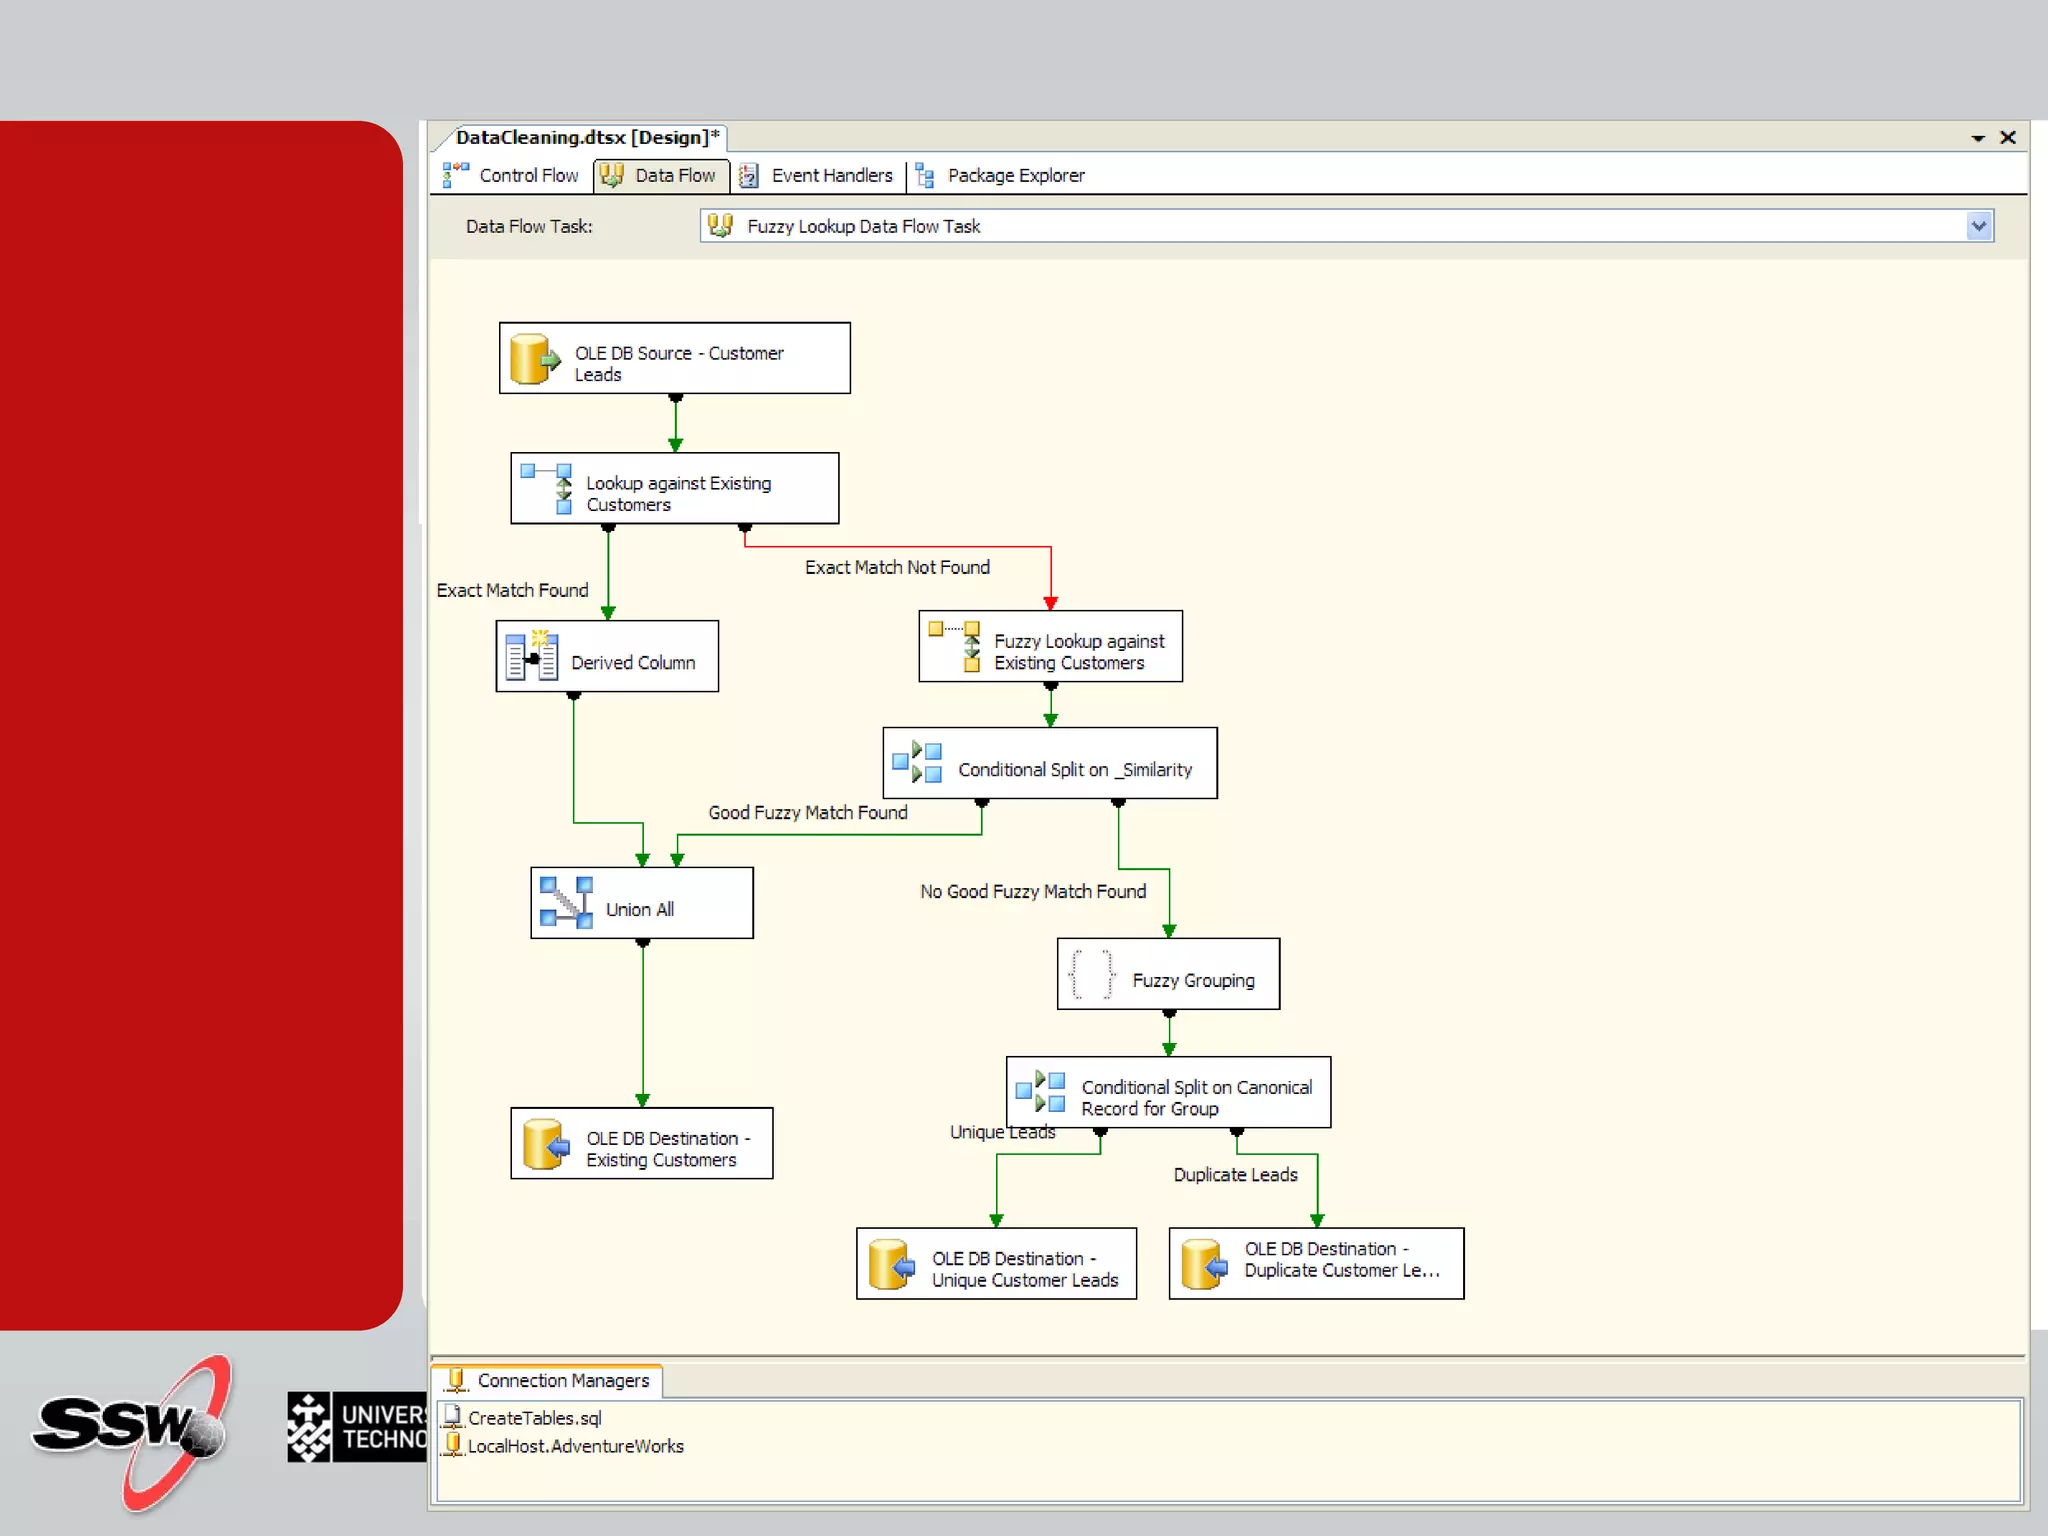
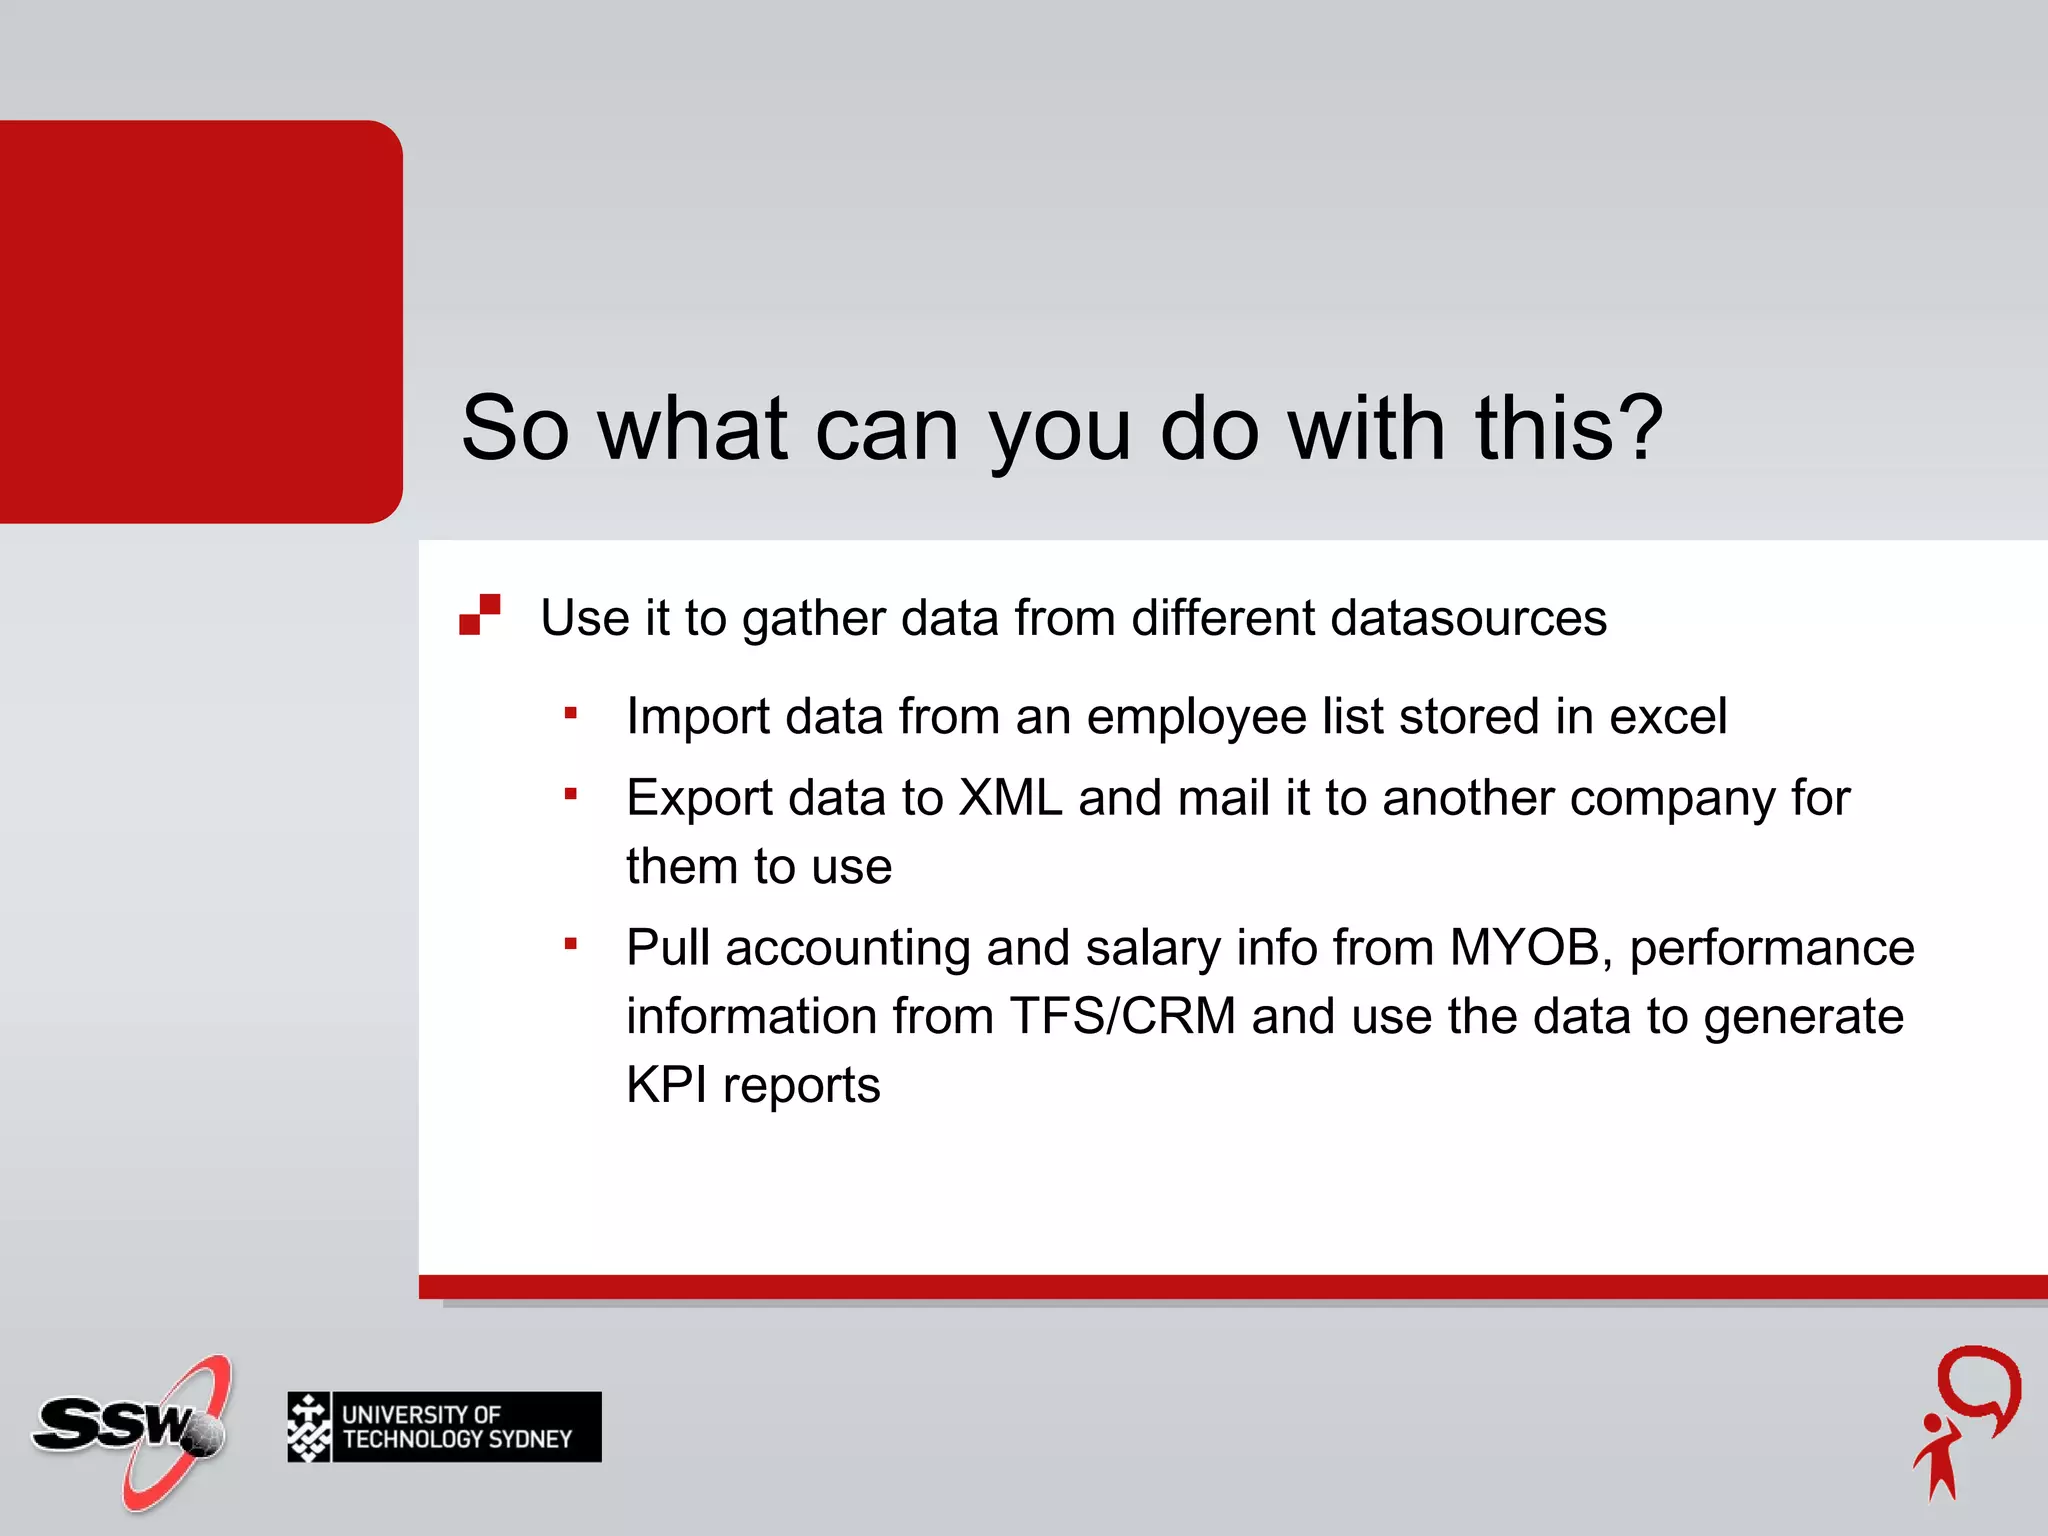
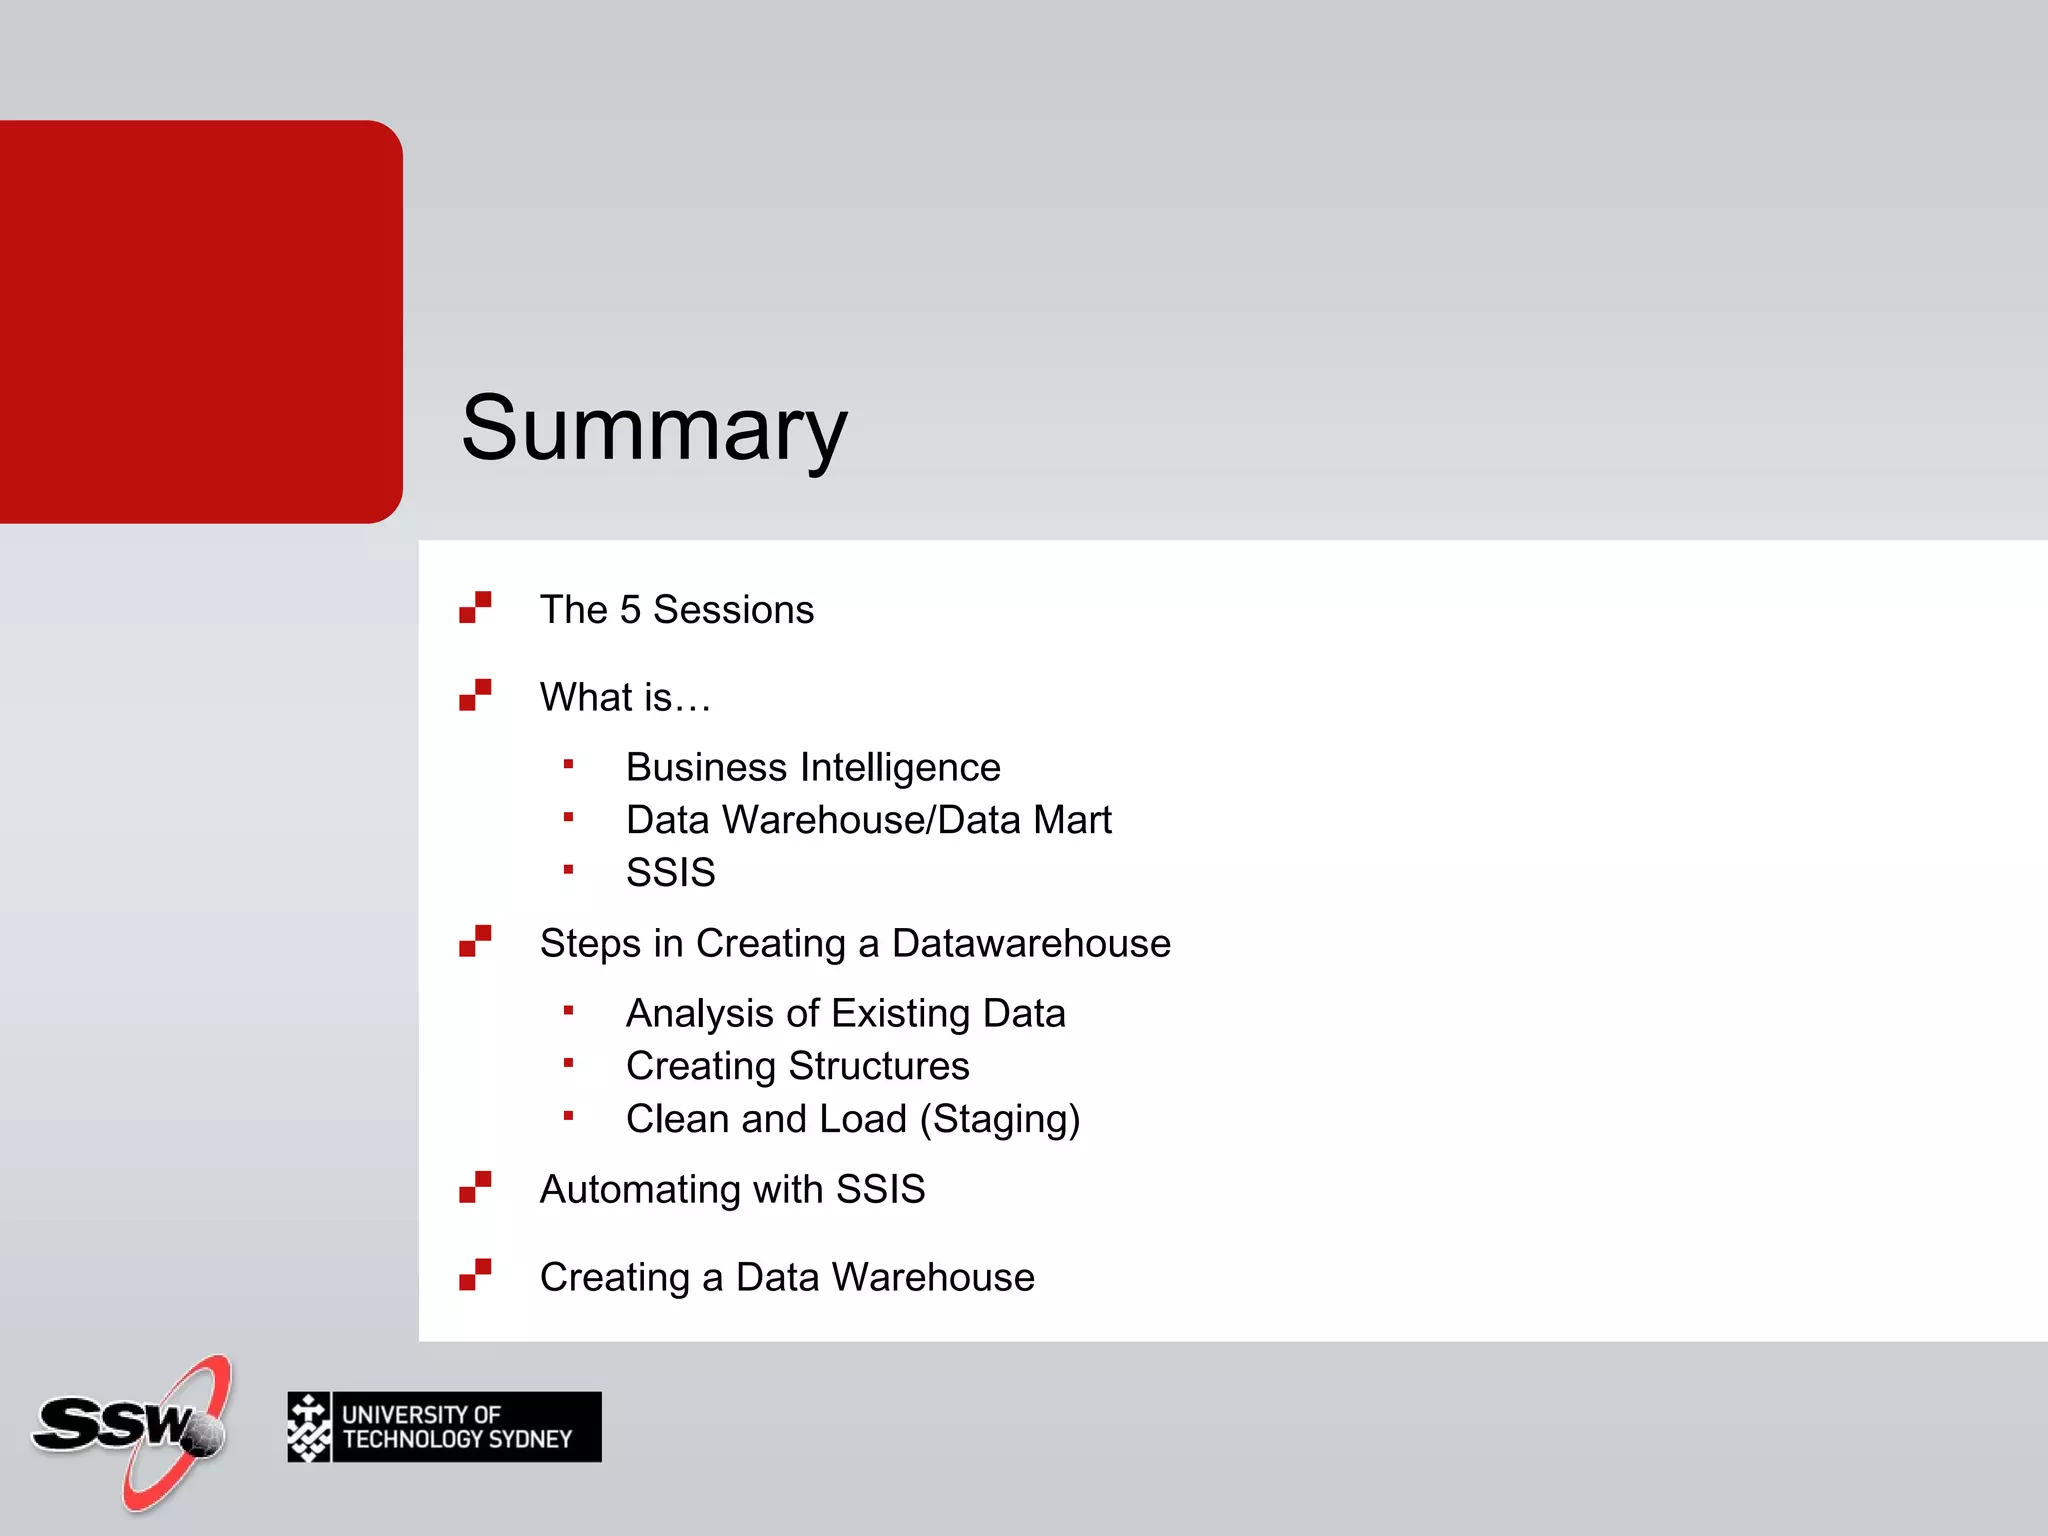
The document outlines a short course on SQL Server 2008 for Business Intelligence, covering topics like data warehousing and SSIS over five sessions. The course is designed to help participants automate data processing and utilize business intelligence techniques for better decision-making. It includes details on course structure, session topics, and resources available for attendees.