The document provides a comprehensive overview of managerial economics and financial analysis, detailing fundamental economic principles, production and cost analysis, market structures, financial accounting, capital budgeting, and methods of demand forecasting. It outlines course outcomes and the relationships between concepts applicable to business practices. Additionally, the text discusses managerial decision-making areas, the nature and types of demand, elasticity of demand, and various methods of demand forecasting.

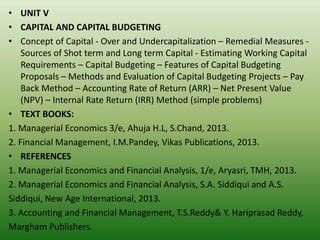


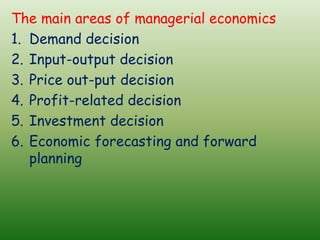


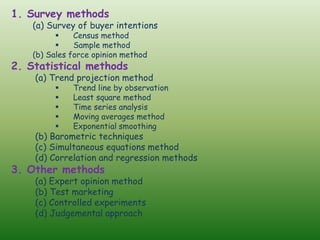


![Journal
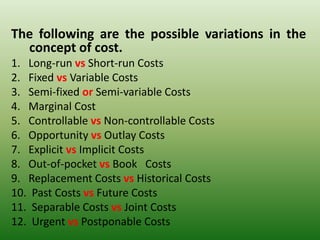
• The word Journal has been derived from the
French word “Jour” which means daily
records.
• Another name “Day book”
• Journal is the first in which transactions are
recorded in a chronological order[date
wise],the moment they take place in
business.](https://image.slidesharecdn.com/befappt-241002163731-5d882119/85/Business-economics-notes-for-btech-students-158-320.jpg)
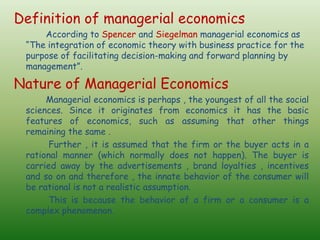
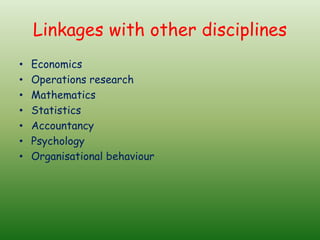
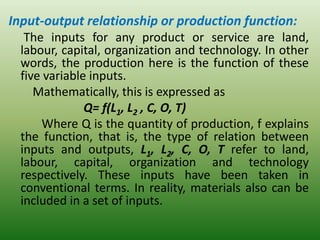
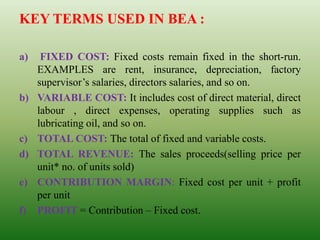
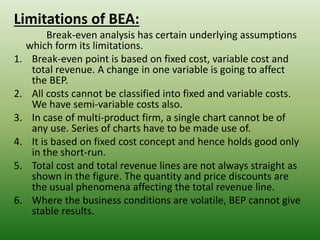
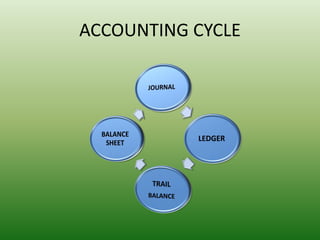
![Format of Journal
Date particulars Lf
no
Dr.
Amount
[Rs]
Cr.
Amount[
Rs]
[debit ends with] -Dr.
[credit start with] To
(narration start as being…… and must be
with in brackets)](https://image.slidesharecdn.com/befappt-241002163731-5d882119/85/Business-economics-notes-for-btech-students-159-320.jpg)