Download to read offline
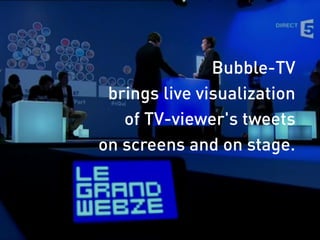

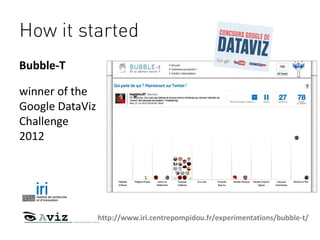
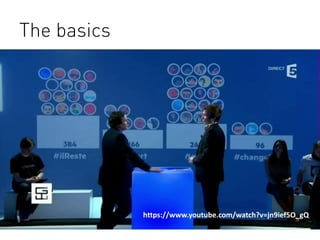
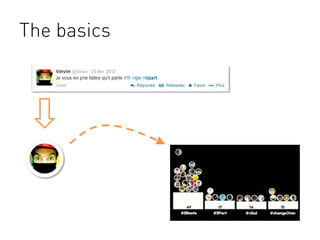
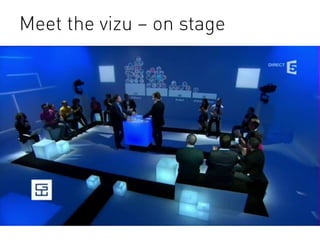
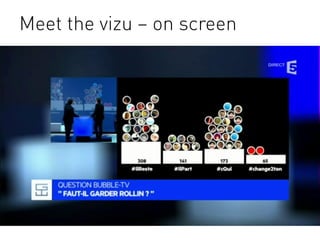
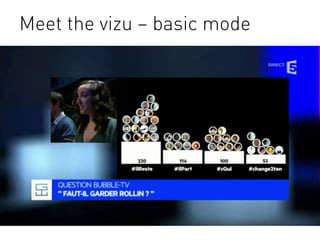
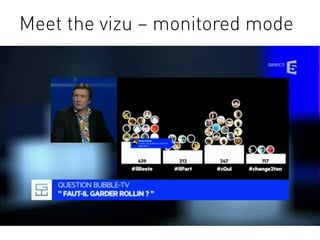
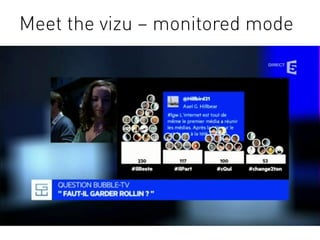
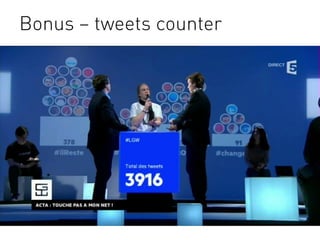
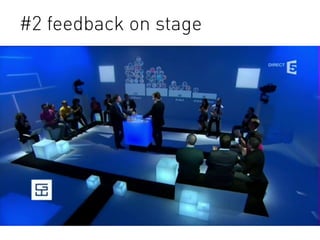
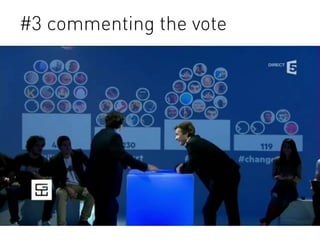

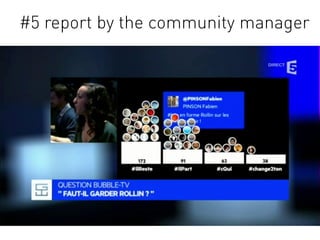
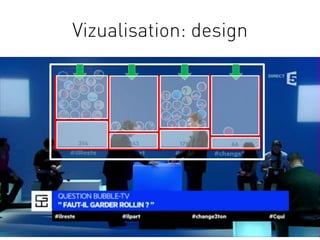
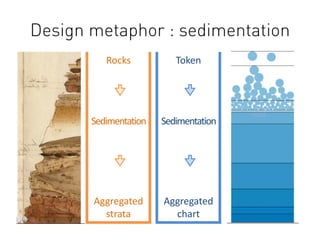
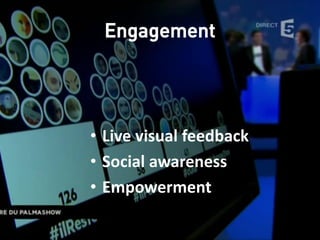
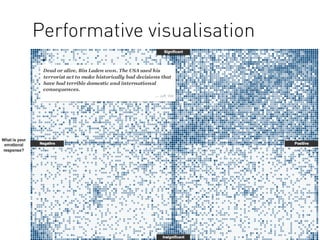
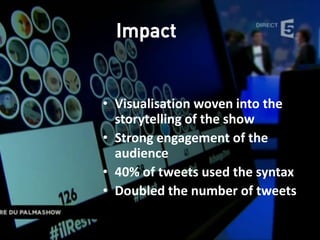

Bubble-TV is a platform that visualizes live tweets from viewers on screens and stages, initiated after winning the Google DataViz Challenge in 2012. The project emphasizes engagement and social interaction, featuring various presentation modes and feedback mechanisms. Its design metaphor and performative visualization contribute to storytelling, significantly increasing audience involvement and tweet participation.


